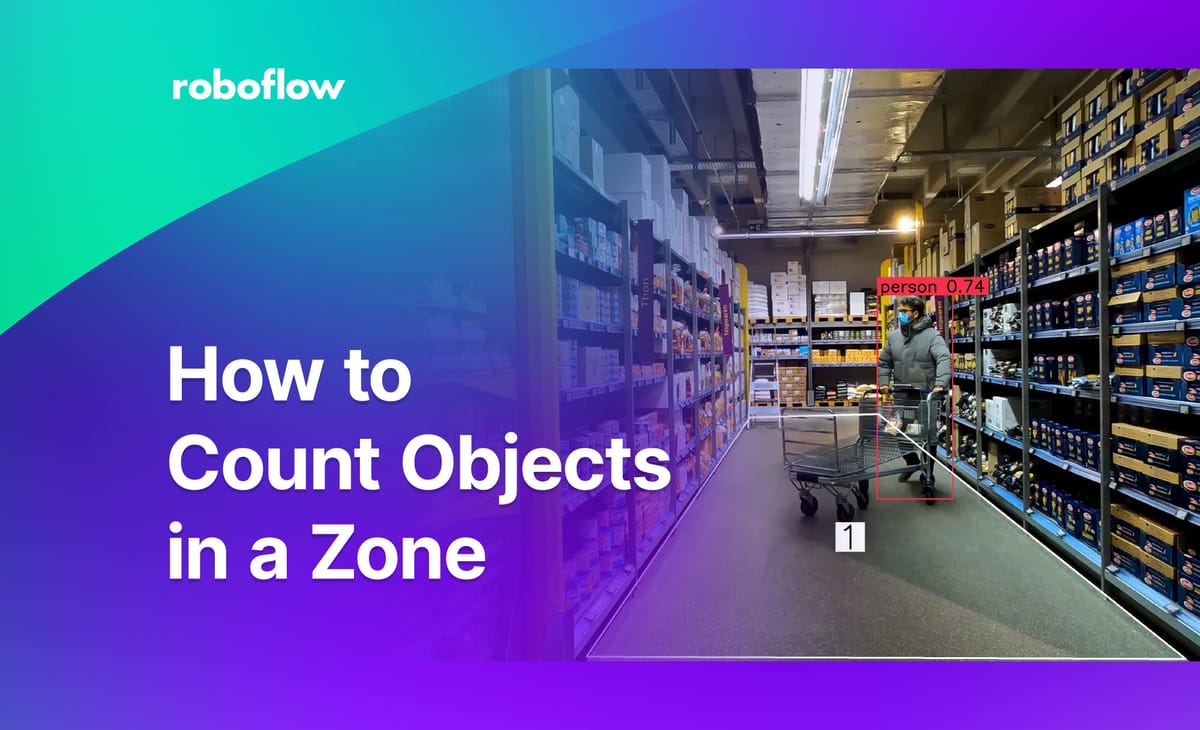
Counting objects in a zone has myriad applications in computer vision. You can count the people in a particular region on a camera, identify the number of screws located in a particular area on a car part, count holes in a piece of metal, and more.
Supervision, an open-source library with utilities to help you build computer vision projects, features a full suite of tools for counting objects in a zone. In this guide, we’re going to show how to count objects in a zone using supervision and PolygonZone, an accompanying tool for calculating the coordinates for zones in an image or video.
Without further ado, let’s get started!
Step 1: Install Supervision and YOLOv8
First, we need to install the supervision pip package:
pip install supervisionWe will use supervision to:
- Define zones in which we want to track objects;
- Count objects in each zone, and;
- Draw annotations for each zone onto an image and video.
We’ll also need to install the ultralytics pip package. This package contains the code for YOLOv8. We’ll use a pre-trained YOLOv8 model to run inference and detect people. To install the ultralytics pip package, run the following command:
pip install "ultralytics<=8.3.40"Step 2: Calculate Coordinates for a Polygon Zone
In this guide, we are going to count the number of people walking in a supermarket aisle. This application could be used to understand congestion in a store, particularly among busy seasons where stores may need to restrict how many people enter (i.e. during Black Friday or Christmas sales) for safety reasons.
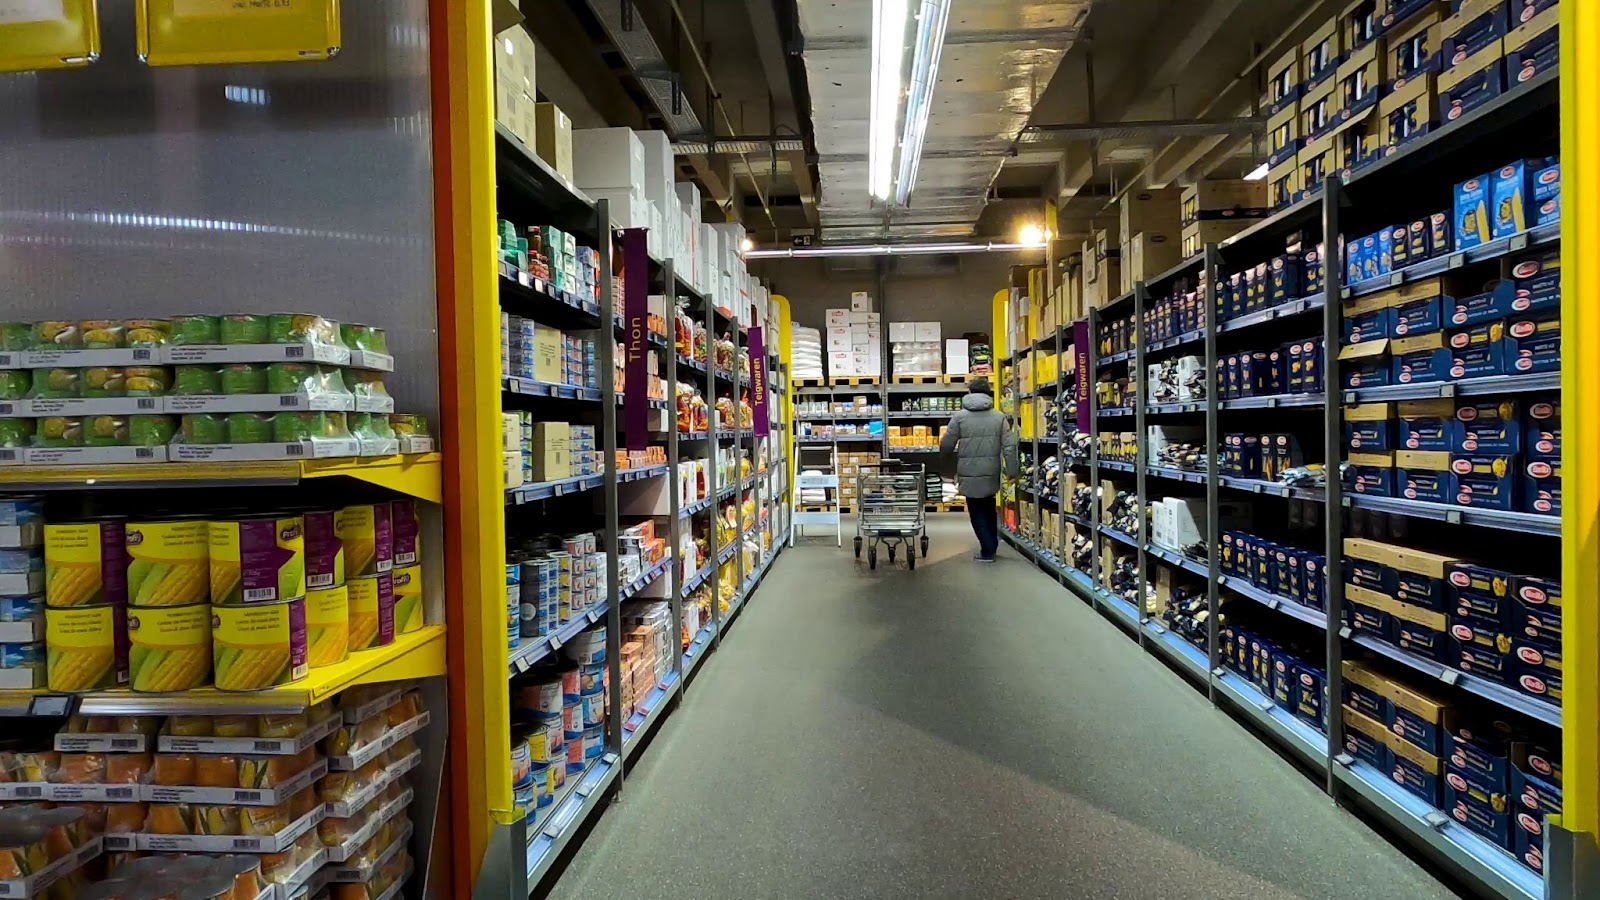
We will be working with footage that shows a person walking in a supermarket aisle. Here is an example frame from our video:

To download the video, we can use the following command:
!wget --load-cookies /tmp/cookies.txt "https://docs.google.com/uc?export=download&confirm=$(wget --quiet --save-cookies /tmp/cookies.txt --keep-session-cookies --no-check-certificate 'https://docs.google.com/uc?export=download&id=1M3UuH3QNDWGiH0NmGgHtIgXXGDo_nigm' -O- | sed -rn 's/.*confirm=([0-9A-Za-z_]+).*/\1\n/p')&id=1M3UuH3QNDWGiH0NmGgHtIgXXGDo_nigm" -O mall.mp4 && rm -rf /tmp/cookies.txtBefore we can start counting objects in a zone, we need to first define the zone in which we want to count objects. We need the coordinates of the zone. We’ll use these later to know whether an object is inside or outside of the zone.
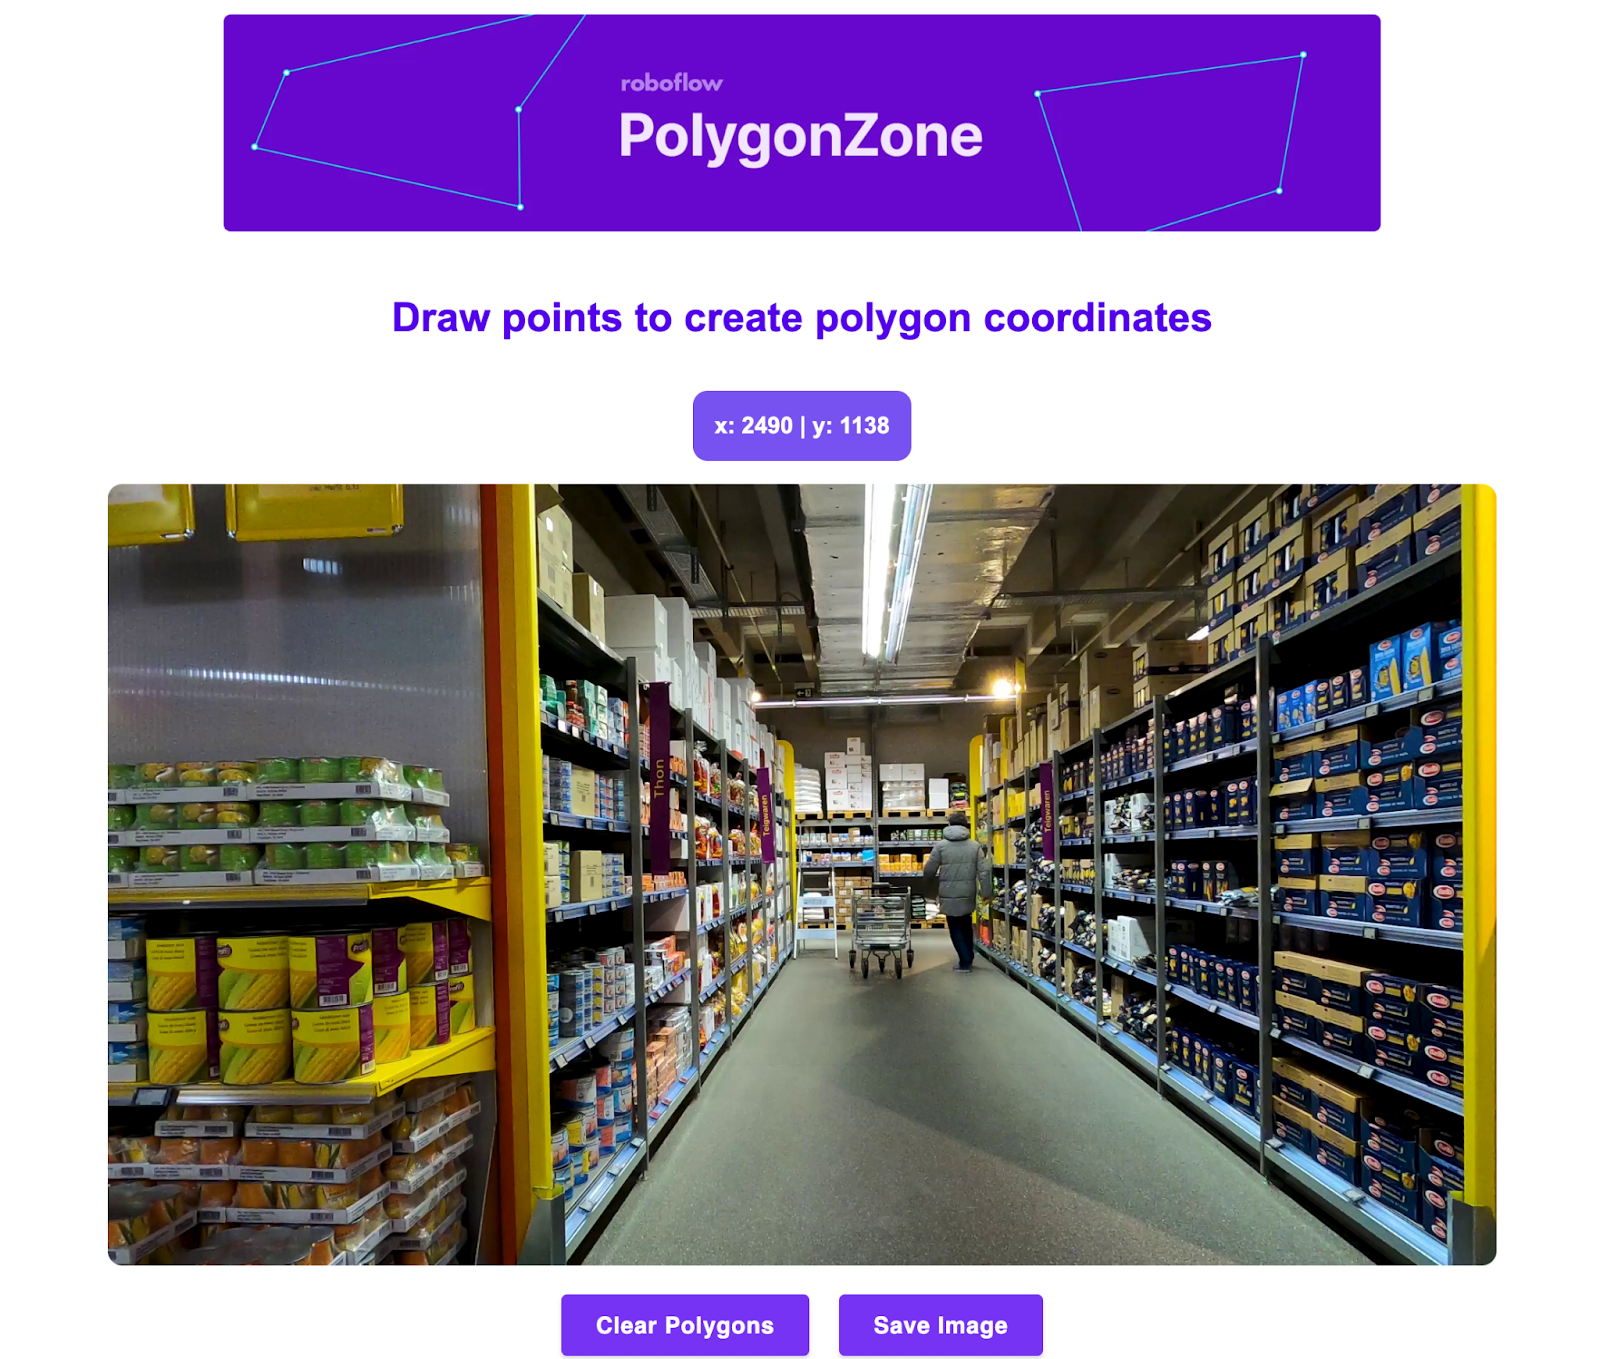
To calculate coordinates inside a zone, we can use PolygonZone, an interactive web application that lets you draw polygons on an image and export their coordinates for use with supervision.
PolgyonZone needs a frame from the video with which you will be working. We can extract a frame from our video using the following code:
import supervision as sv
import cv2

generator = sv.get_video_frames_generator("./mall.mp4")
iterator = iter(generator)
frame = next(iterator)

cv2.imwrite("frame.jpg", frame)
This code will retrieve the first frame from our mall video and save the frame as a file on our local machine. The frame is the same image we showed earlier in the article.
We can now use this image to calculate the coordinates of the zone we want to draw on our image. First, open up PolygonZone and upload the frame:

Then, click on points in the image where you want to draw lines. When you have drawn the full zone, click “enter” to connect the dots between the start and finish point.
Once you have added your points, a NumPy array will be available on the page. This array contains the coordinates for the points in our zone.
With the zone coordinates ready, we can now start counting objects in the zone.
Step 3: Count Objects in the Specified Zone
For this step, we will use a pre-trained YOLOv8 object detection model to identify people in each frame in our video.
First, import the required dependencies then define the zone in which we want to count objects using the coordinates we calculated earlier:
import numpy as np
import supervision as sv

MALL_VIDEO_PATH = "./mall.mp4"

# initialize polygon zone
polygon = np.array([
	[1310, 2142],[1906, 1270],[2374, 1258],[3494, 2150]
])
Next, initialize the objects that we’ll use for processing and annotating our video. We don’t have to worry too much about how these work. The PolygonZone object keeps track of the zones in our image and the annotators are used to specify how we want to annotate predictions in our video.
video_info = sv.VideoInfo.from_video_path(MALL_VIDEO_PATH)
zone = sv.PolygonZone(polygon=polygon, frame_resolution_wh=video_info.resolution_wh)

box_annotator = sv.BoxAnnotator(thickness=4, text_thickness=4, text_scale=2)
zone_annotator = sv.PolygonZoneAnnotator(zone=zone, color=sv.Color.WHITE, thickness=6, text_thickness=6, text_scale=4)
Next, let’s load the model which we’ll use to detect people:
from ultralytics import YOLO

model = YOLO("yolov8s.pt")
Supervision has a method called process_video() that accepts a callback function. This function takes predictions and processes them using the specified annotator.
Let’s define a callback function that uses the predictions from the YOLOv8 model we initialized to count objects in a zone and plot those zones:
def process_frame(frame: np.ndarray, _) -> np.ndarray:
   results = model(frame, imgsz=1280)[0]
   detections = sv.Detections.from_ultralytics(results)
   detections = detections[detections.class_id == 0]
   zone.trigger(detections=detections)

   box_annotator = sv.BoxAnnotator(thickness=4, text_thickness=4, text_scale=2)

   labels = [f"{model.names[class_id]} {confidence:0.2f}" for _, _, confidence, class_id, _, _ in detections]
   frame = box_annotator.annotate(scene=frame, detections=detections, labels=labels)
   frame = zone_annotator.annotate(scene=frame)


   return frame
We will use this callback function in process_video() to tell supervision how to process each frame in our video:
sv.process_video(source_path=MALL_VIDEO_PATH, target_path=f"mall-result.mp4", callback=process_frame)In this line of code, we instruct supervision to take in our supermarket video, run the process_frame() callback function over each frame, and save the result to the mall-result.mp4 file.
The pre-trained YOLOv8 model we are using detects all of the classes in the Microsoft COCO dataset. We filter out all of the classes by specifying we only want detections with the class ID 0. This ID maps to the “person” class.
If you are using your own custom model, you can find out which ID to use using this code:
print(model.model.names)This will return a mapping between the YOLOv8 class IDs and the labels, like this:
{0: 'person', 1: 'bicycle', 2: 'car', 3: 'motorcycle', 4: 'airplane', 5: 'bus', 6: 'train', 7: 'truck', 8: 'boat', ... 78: 'hair drier', 79: 'toothbrush'}
You can then use the number you want in the detections filter applied in the process_frame() function above:
detections = detections[detections.class_id == 0]Let’s run our code. Note: Inference time will depend on how long your video is and the hardware on which you are running. The shopping example in this video is quite large; inference took 17 minutes in testing. Feel free to make a cup of tea or coffee while you wait!
After running our code for a few minutes, our script returns a fully annotated video showing how many people are in the specified zone. Here is an excerpt from the video showing a person on the edge of the box, then fully entering the box:
You could add logic to take an action if a certain number of people were in a zone. For example, if there are more than 10 people in a zone, you could make a log in a spreadsheet to note that the zone was busy, or if there are fewer than one person in a zone, you could save a record indicating that the designated area was empty.
Want to count people in more than one zone? Check out our Count People in Zone YouTube guide and the PolygonZone notebook we mentioned earlier.
Conclusion
Using supervision, you can define zones in which specified objects in an image should be counted. In the example above, we counted the number of people in a defined zone in a supermarket.
We first installed supervision, retrieved the first frame of our video, then used that frame with PolygonZone to find the coordinates of the zone that we wanted to define. Then, run inference using a people detection model hosted on Roboflow Universe for each frame in our video. We used supervision to process these predictions, count people in our zone, and create an annotated video with our predictions and people counts.
Now you have the tools you need to count objects in zones for computer vision applications.
Cite this Post
Use the following entry to cite this post in your research:
James Gallagher. (May 30, 2023). How to Count Objects in a Zone. Roboflow Blog: https://blog.roboflow.com/how-to-count-objects-in-a-zone/
