
Computer vision models return prediction coordinates as raw data, not annotated images, so drawing boxes and class labels is a post-processing step your code must handle. This tutorial uses cv2.rectangle to draw the box from x, y, width, and height values and cv2.putText to place the predicted class name just above it, with an optional example showing how to connect a Roboflow Universe model to supply the predictions.
Computer vision models, by default, return the positions of predictions returned by the model, not a visual bounding box on an image. Drawing boxes showing the location of predictions, and adding labels to those boxes, is a post-processing step which requires additional code.
Once you have drawn bounding boxes – a topic about which we have written in the past – you may be wondering: how can I visualize a prediction? That’s the question we’re going to answer in this tutorial.
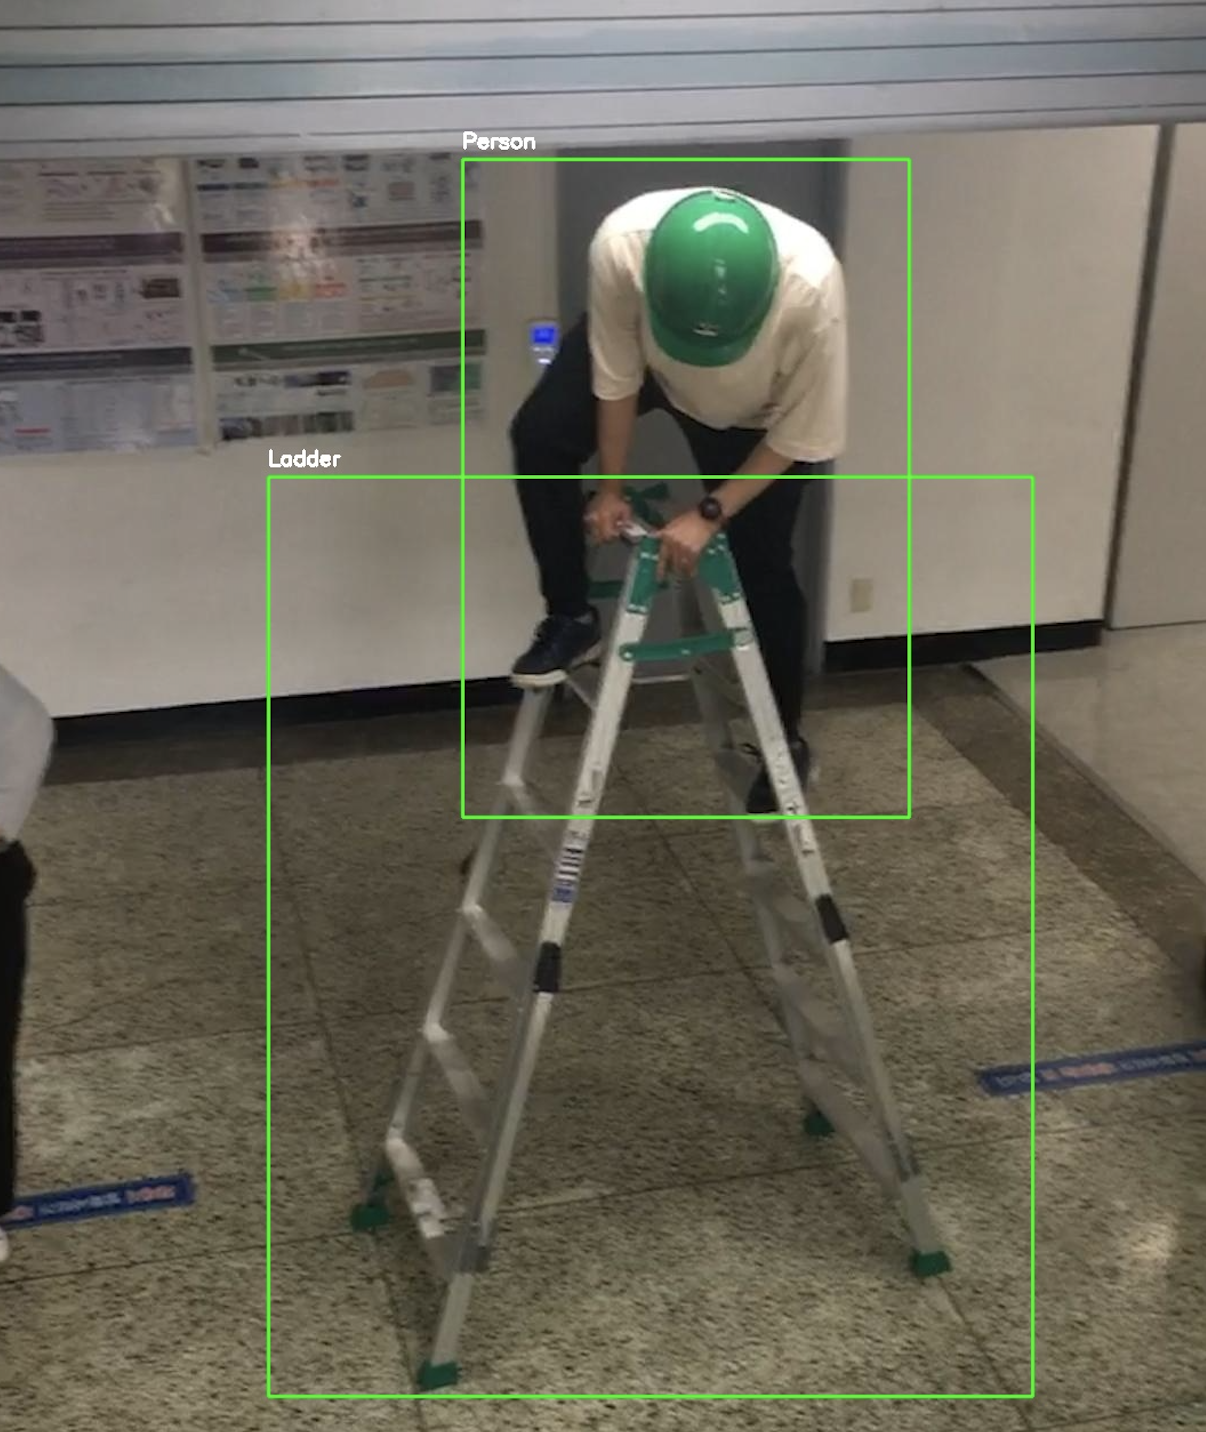
Let’s discuss how to draw a bounding box prediction using Python and the cv2.putText method. Here is the end result we'll achieve:
How to Draw a Bounding Box Label in Python
If you don't already have a model, scroll down to the bottom of this article where we'll show using an example model from Roboflow Universe.
To draw a bounding box, you’ll need:
- The starting x position of the box.
- The starting y position of the box.
- The width of the prediction.
- The height of the prediction.
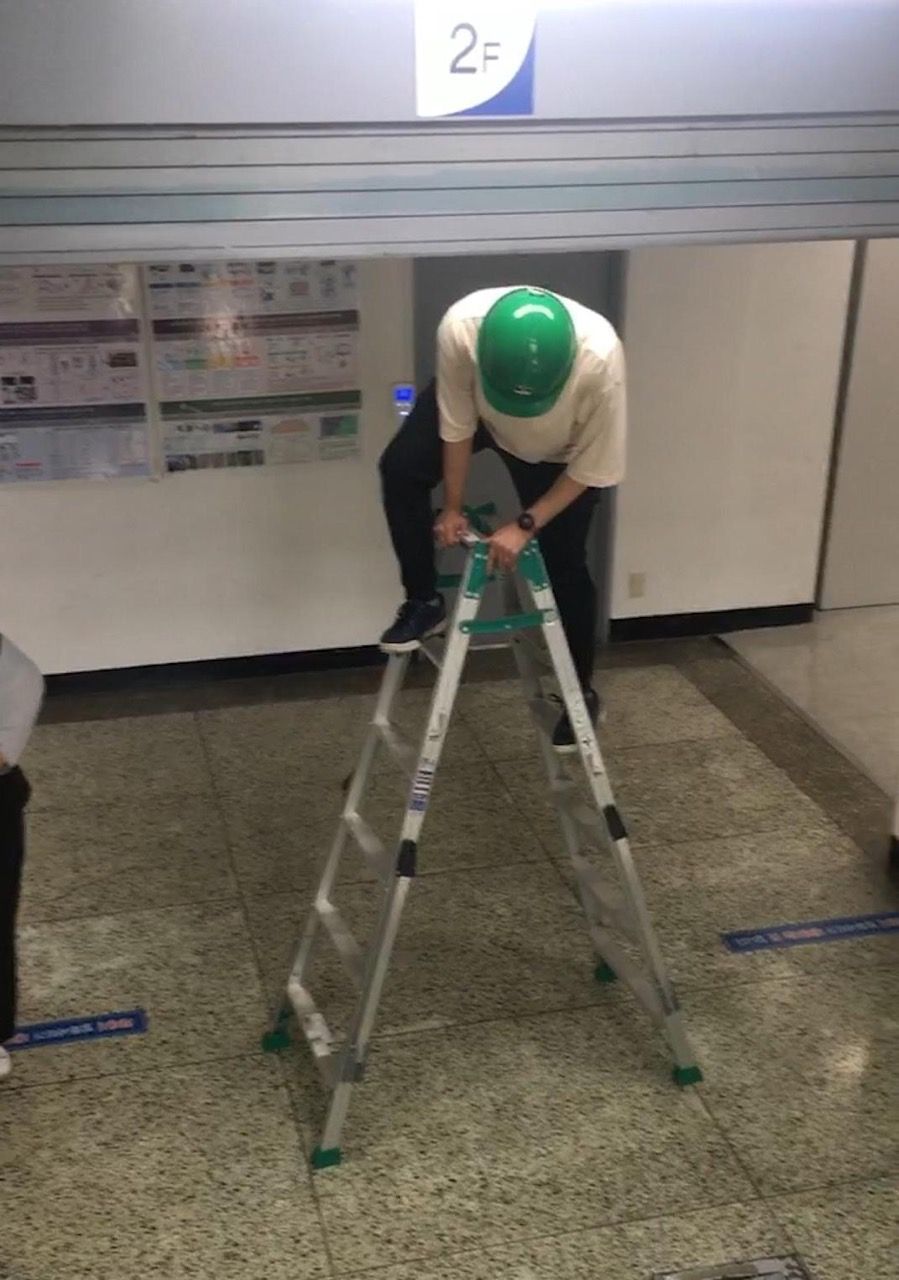
Here is the raw image to which we want to add bounding boxes and labels:
Below, we use the “predictions” list from the last section which contains all of this information. You can substitute the variables below as necessary to make the code work on your project. Here is the code we'll need to draw our bounding boxes and add labels above each bounding box:
import cv2

predictions = [...] # add your predictions here

for bounding_box in predictions['predictions']:
    x0 = bounding_box['x'] - bounding_box['width'] / 2
    x1 = bounding_box['x'] + bounding_box['width'] / 2
    y0 = bounding_box['y'] - bounding_box['height'] / 2
    y1 = bounding_box['y'] + bounding_box['height'] / 2

    start_point = (int(x0), int(y0))
    end_point = (int(x1), int(y1))
    cv2.rectangle(img, start_point, end_point, color=(0,0,0), thickness=1)

    cv2.putText(
        image,
        bounding_box["class"],
        (int(x0), int(y0) - 10),
        fontFace = cv2.FONT_HERSHEY_SIMPLEX,
        fontScale = 0.6,
        color = (255, 255, 255),
        thickness=2
    )

cv2.imwrite("example_with_bounding_boxes.jpg", image)
This code will add a label with the predicted class name above our image. The (x, y) tuple represents the place in the image where we want to add our label. We then specify a few other attributes: the typeface to use, the font scale, the color of the text (in our case above, black), and the weight of the text (how bold it is).
Let's run our code using the ladders detection model (discussed in the next section):
Now all of our bounding boxes show a label at the top.
Setting Up a Model (Optional)
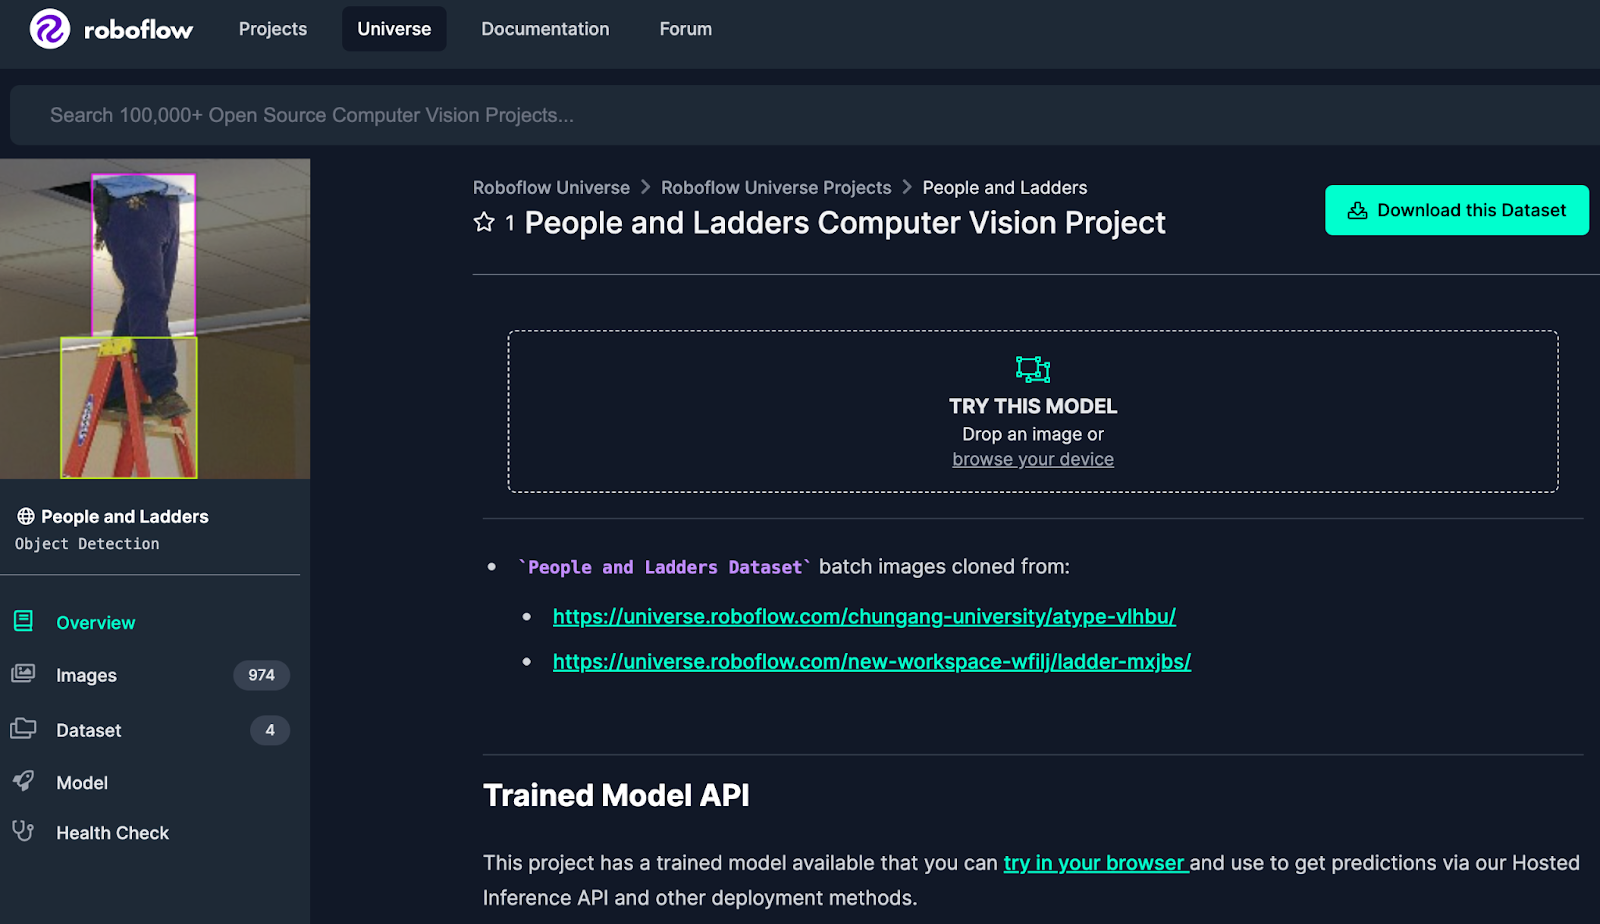
In the guide above, we drew bounding box labels around a model that detects people and ladders. If you want to use the people and ladder detection models for testing, first sign up to Roboflow and then go to our People and Ladders Universe dataset. This dataset comes with a free-to-use trained model.
Click “Model” in the sidebar, scroll down and copy the code that you see into a Python file. The code will look something like this, with your API key:
from roboflow import Roboflow

rf = Roboflow(api_key="API_KEY")
project = rf.workspace().project("people-and-ladders")
model = project.version(4).model
This code imports your model. Add a new line at the bottom to run inference on a local file:
predictions = model.predict(“image.jpg”, confidence=50).json()The “predictions” variable now contains all of the predictions returned by our model that were rated with a confidence level equal to or greater than 50%. Now we have a model on whose predictions we can draw bounding boxes and labels.
Conclusion
In this tutorial, we have discussed:
- How to use Roboflow Universe to use a trained public model;
- How to retrieve predictions from the model;
- How to draw bounding boxes around a model and;
- How to draw labels above each bounding box.
Now you have all of the information you need to represent numerical coordinates data visually in your computer vision work. Happy creating!
Cite this Post
Use the following entry to cite this post in your research:
James Gallagher. (Jan 19, 2023). How to Draw a Bounding Box Prediction Label with Python. Roboflow Blog: https://blog.roboflow.com/how-to-draw-a-bounding-box-label-python/