
Detecting hotspots on solar panels is crucial for maintaining their efficiency and longevity. Hotspots occur when a part of a solar panel becomes significantly hotter than the surrounding areas, usually due to defects, shading, or dirt accumulation. These hotspots can severely reduce the overall performance of the solar panel, leading to a drop in energy output.
If left unchecked, hotspots can cause permanent damage to the photovoltaic cells, necessitating costly repairs or replacements. By identifying and addressing hotspots early, we can ensure that solar panels operate at their maximum potential, thereby maximizing energy production and extending the lifespan of the installation.
Computer vision technology offers an advanced and effective method for detecting hotspots on solar panels. This technology involves using cameras and sophisticated algorithms to analyze images of the solar panels in real time. Thermal imaging cameras are particularly useful, as they can capture temperature variations across the panel surface.
Computer vision systems can process thermal images and identify regions that are hotter than the surrounding areas. These “hot” areas indicate the presence of hotspots. This automated approach not only speeds up the inspection process but also increases accuracy, as it can detect even minor temperature anomalies that might be missed by manual inspections.
In this guide, we are going to show you how to inspect solar panels using footage from aerial drones equipped with thermal cameras. Let’s begin!
Step #1: Build your model
First, sign up for Roboflow and create an account.
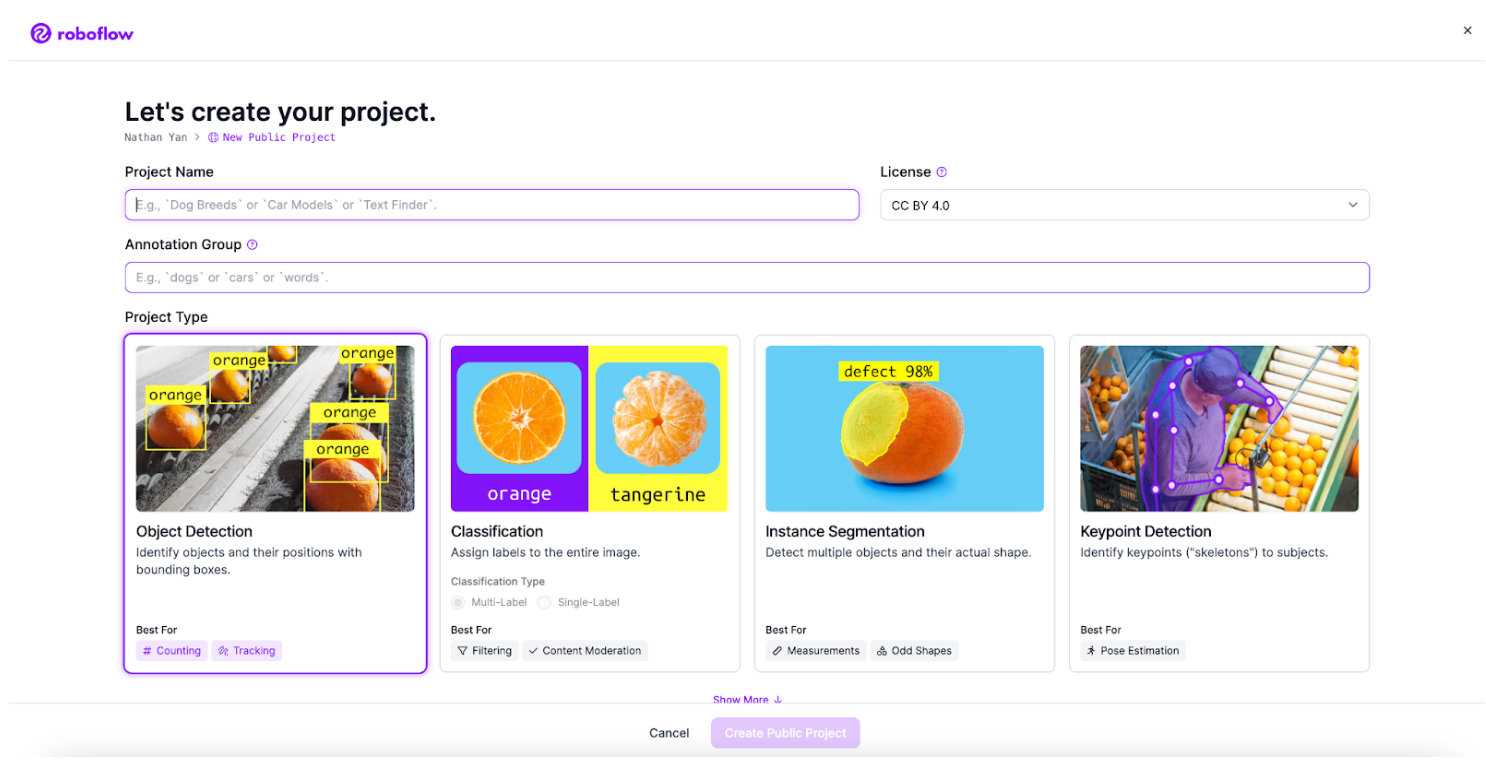
Next, go to your Roboflow dashboard and create a project. Customize the project name and annotation group to your choice. Choose “Object Detection” as the project type.
Next, add your images. The images I used were found from this Youtube video. You can upload your own images or videos, or enter a Youtube URL into Roboflow to create an example dataset to follow along with this guide.
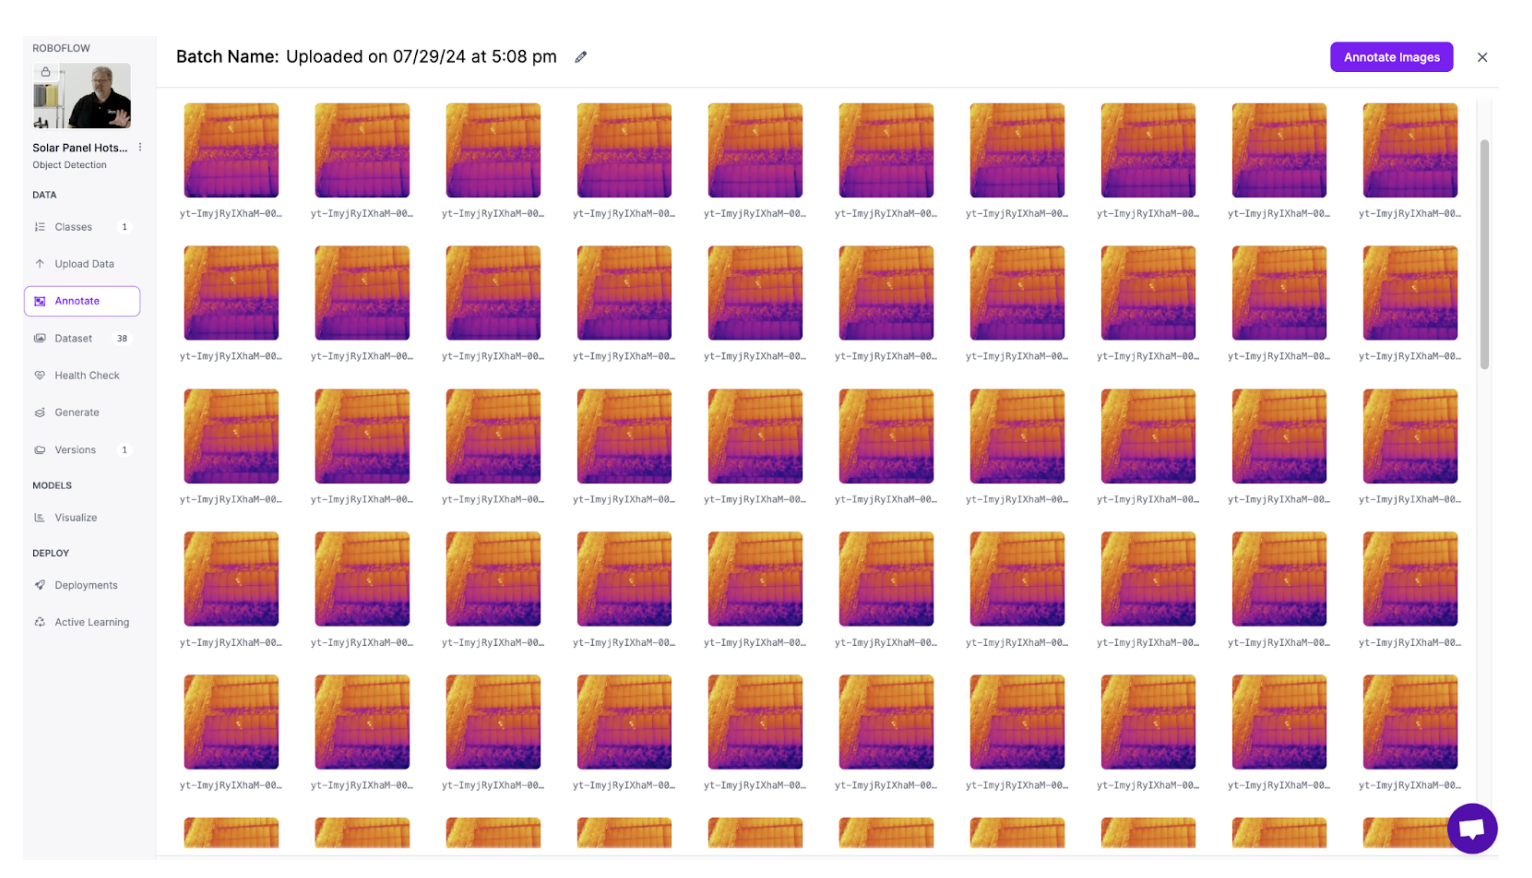
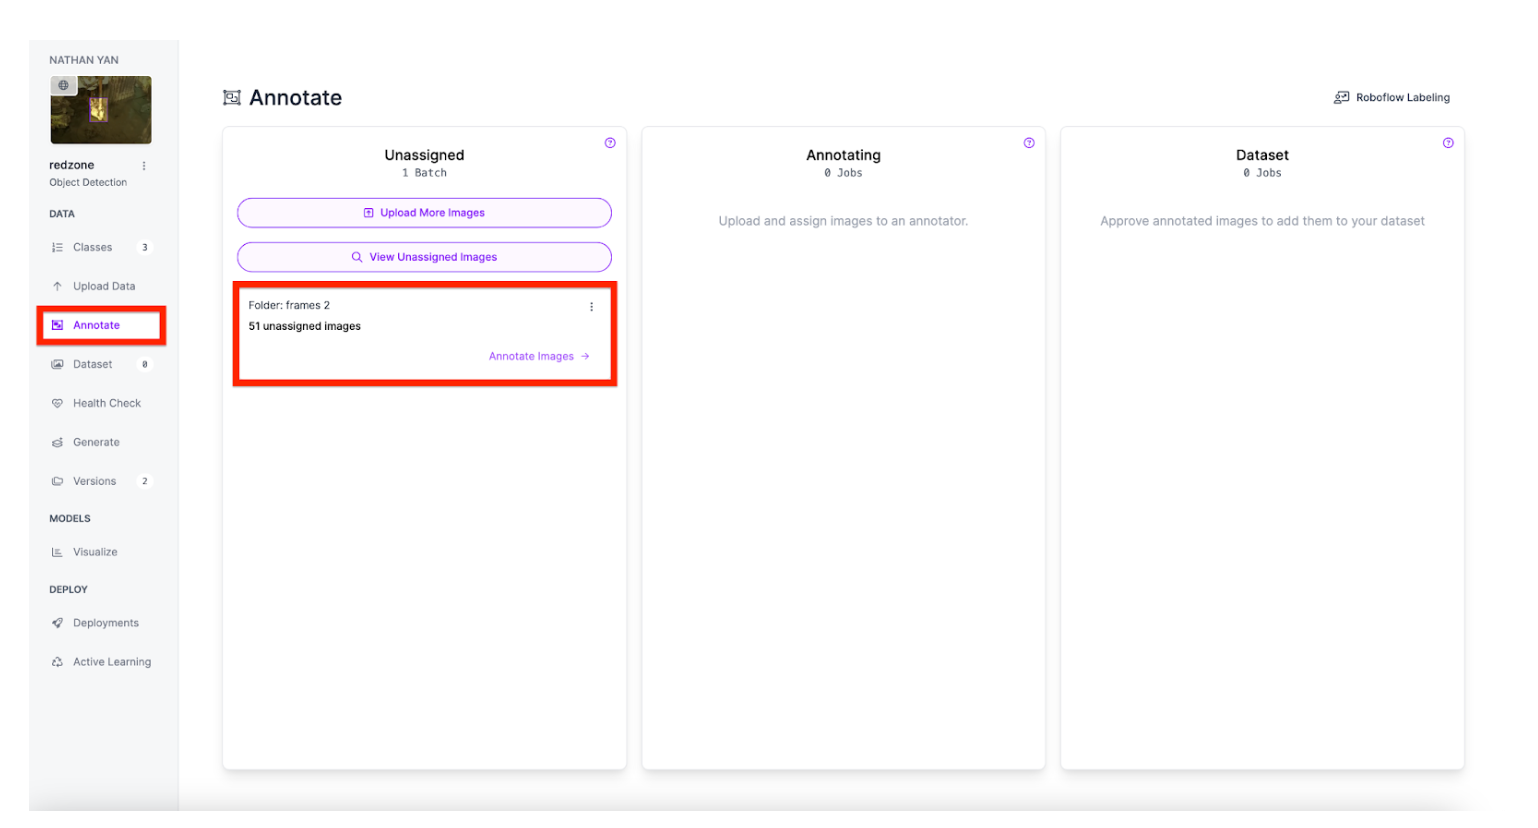
Next, start annotating your dataset. We recommend getting at least 50 annotated images before training your first model. Click on the batch of images you have uploaded to choose an image to annotate.
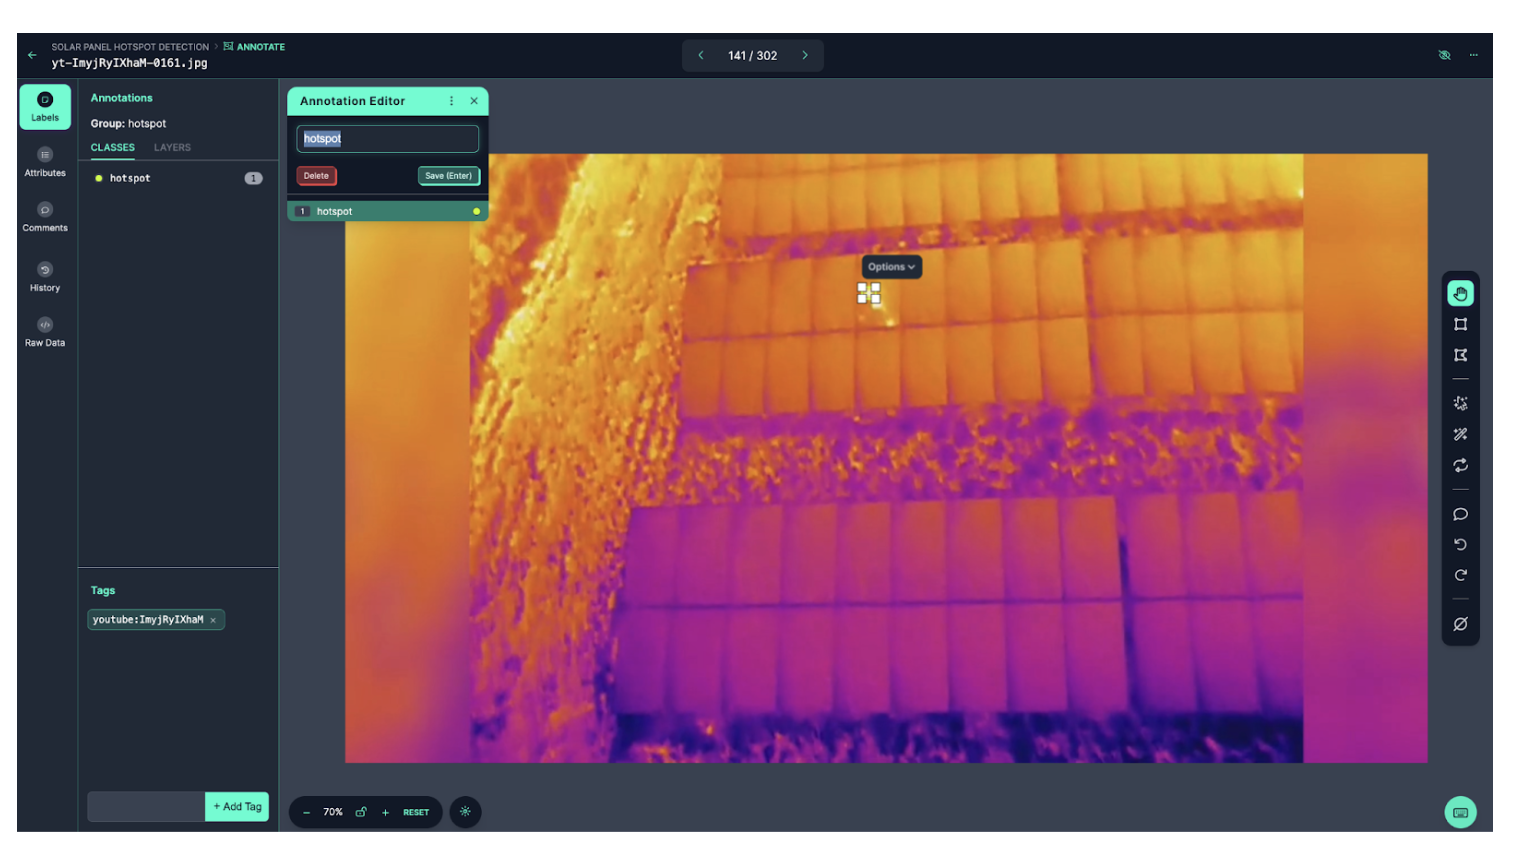
Once you have opened an image, you will be taken to the Roboflow Annotate tool. Roboflow Annotate is a web-based annotation tool with an extensive set of features made for annotating images for use in computer vision projects.
For this project, draw annotations corresponding to hot spots from the solar panels using the bounding box feature in Roboflow. Repeat this step for each image.
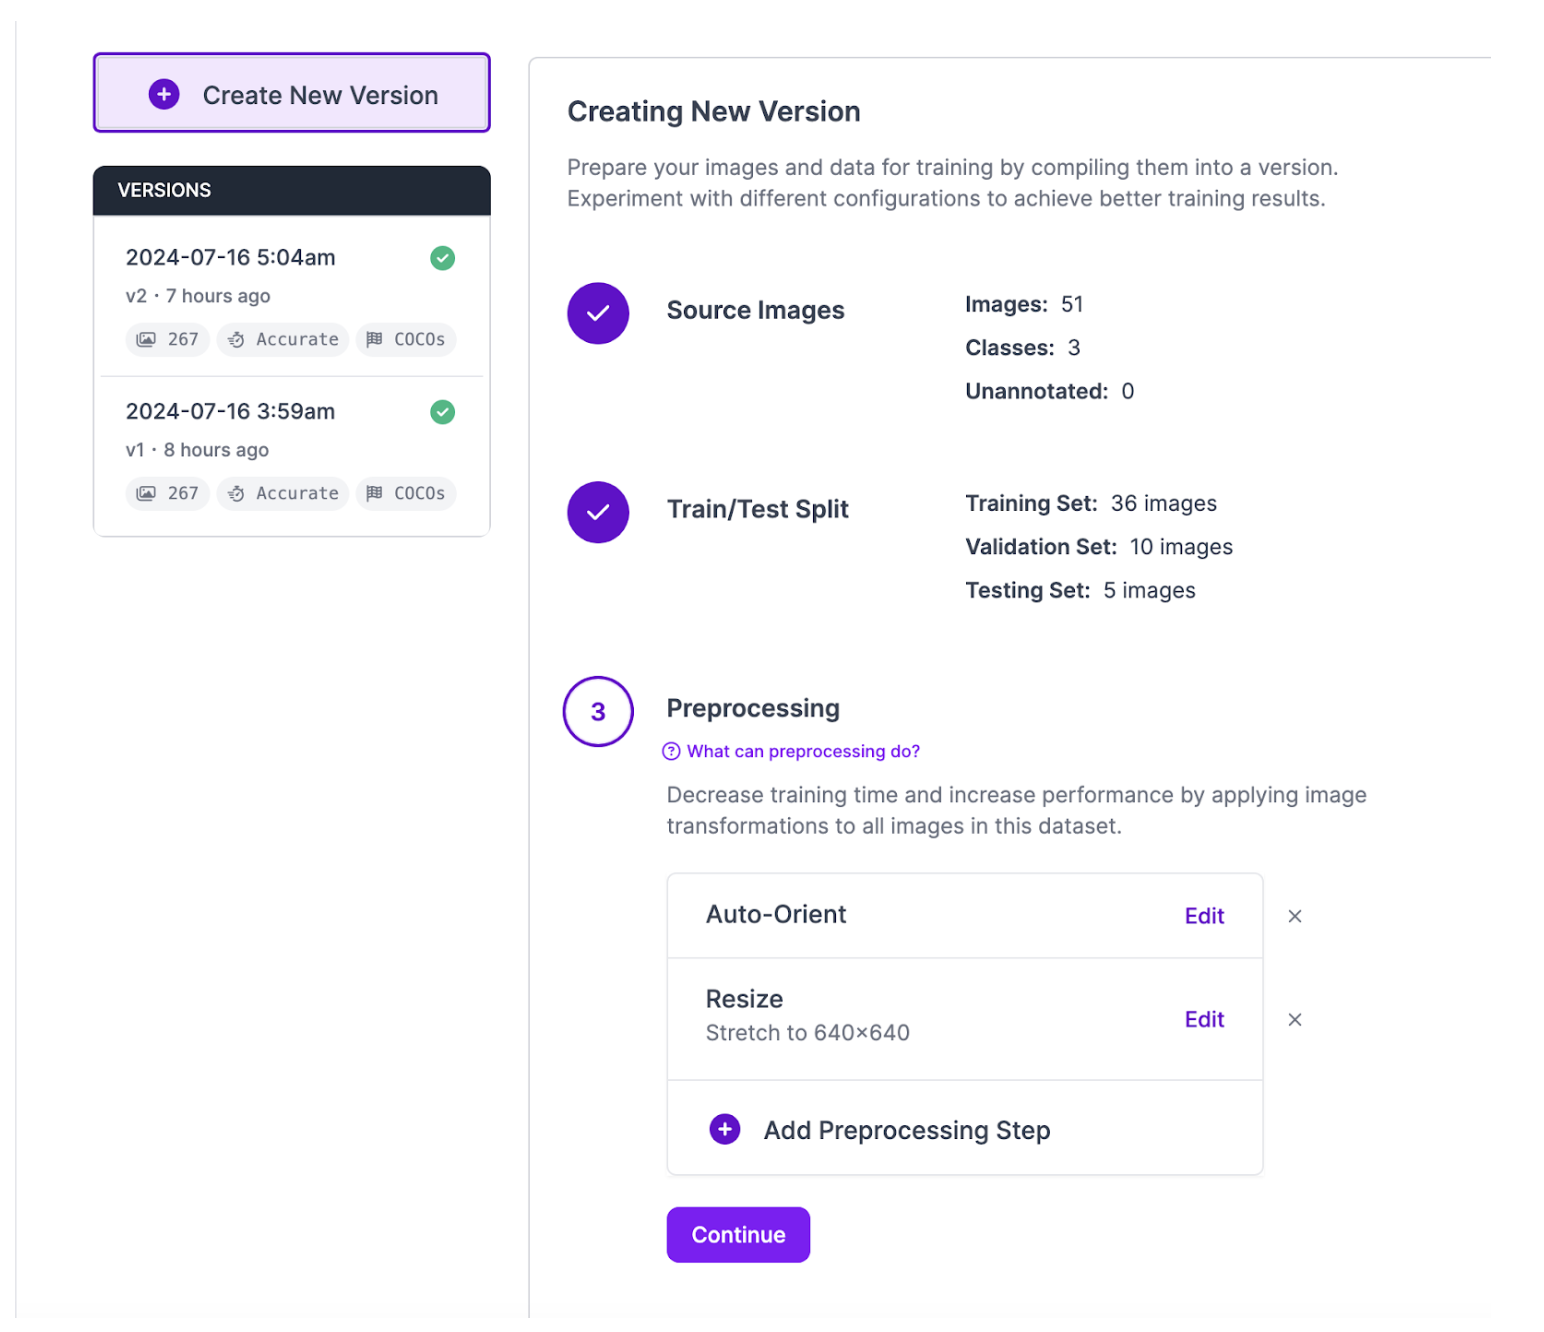
Once you have labeled your dataset, go back to your project and click “Generate” in the Roboflow sidebar. On this page, you can generate a dataset version of your labeled images. Each version is unique and associated with a trained model so you can iterate on augmentation and data experiments.
To learn more about augmentations and preprocessing, refer to our guide to image augmentation and preprocessing.
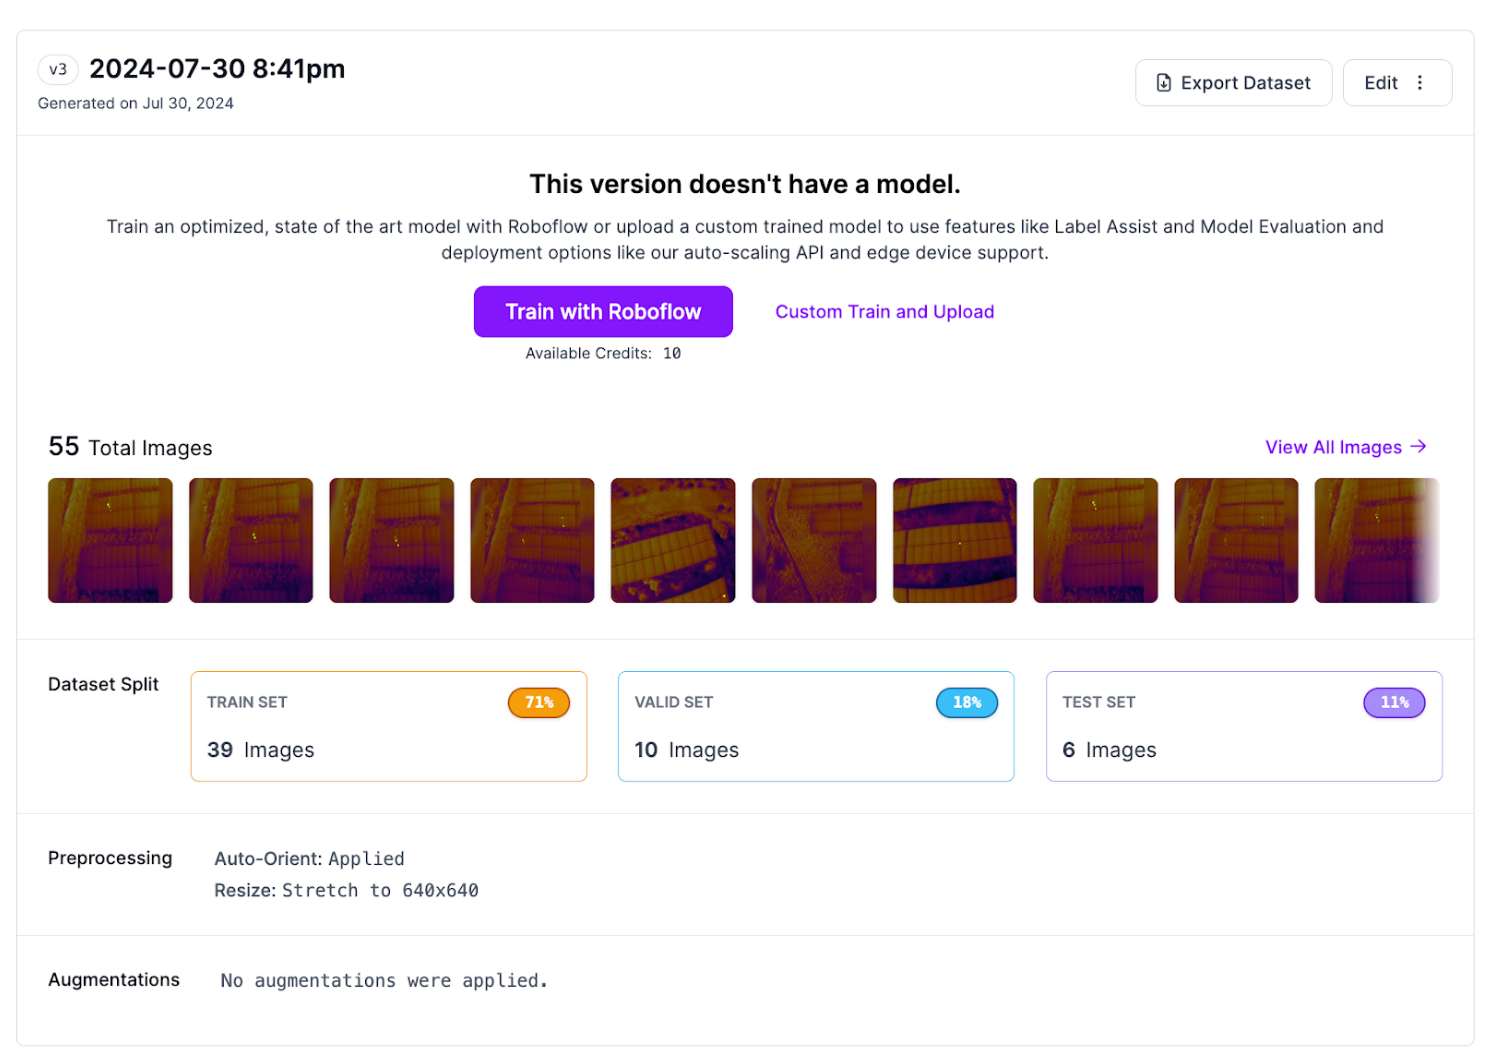
Once you generate your dataset, click “Train with Roboflow” to start training your model:
Now that we’ve finished all the prerequisites of model building, we can visualize the outputs of the model by deploying it using Roboflow Inference.
Step #2: Download required dependencies
First, download the needed libraries with the following command:
!pip install supervision numpy inference_sdk
Step #3: Import libraries
Create a new Python file. Paste the following code at the top of the file to, import the requisite libraries:
import supervision as sv
import numpy as np
from inference_sdk import InferenceHTTPClient, InferenceConfiguration
Step #4: Initialize your model
Then, add the following code to initialize an instance of your solar panel detection model:
config = InferenceConfiguration(confidence_threshold=0.15)

CLIENT = InferenceHTTPClient(
    api_url="https://detect.roboflow.com",
    api_key="fZkwfr3c0A2hZjtLSdM8"
)
CLIENT.configure(config)
The above code will call the Roboflow API with our requests. Replace API_KEY with your Roboflow API key. Learn how to retrieve your Roboflow API key.
Step #5: Add visualization code
We will need code that allows us to visualize the results from our model. For this, we are going to use the supervision bounding box annotator utility. This utility accepts computer vision model predictions and allows us to display the corresponding bounding boxes on an image or frame from a video.
bounding_box_annotator = sv.BoxAnnotator(thickness=5)
def callback(frame: np.ndarray, index:int) -> np.ndarray:
    result = CLIENT.infer(frame, model_id="solar-panel-hotspot-detection-dgiy8/2")
    detections = sv.Detections.from_inference(result)
    annotated_frame = frame.copy()
    annotated_frame = bounding_box_annotator.annotate(
        scene=annotated_frame,
        detections=detections)
    return  annotated_frame
Above, we define an annotator, then a callback function that calls our model with the CLIENT.infer() call. We then pass our model predictions from the infer() call through our annotator, and return the annotated frame.
Bring it all together
SOURCE_VIDEO_PATH = "path/to/video"
TARGET_VIDEO_PATH = 'output.mp4'
sv.process_video(
    source_path = SOURCE_VIDEO_PATH,
    target_path = TARGET_VIDEO_PATH,
    callback=callback
)
Now you are able to visualize the results when running your model on the TARGET_VIDEO_PATH file!
Here is an example of the script running on a video:
The small boxes that appear in the video are the results of our model. The boxes indicate the presence of a hot spot on a solar panel as dettected by our model.
Conclusion
Deploying your model with Roboflow Inference for hotspot detection on solar panels can be achieved through various methods, each suited to different operational needs. One approach is to integrate the model directly onto a drone equipped with thermal imaging cameras, enabling real-time, autonomous inspection of large solar farms.
Another method involves deploying the model on edge devices placed at the solar installation site, which can receive thermal images and process them locally to alert maintenance teams of any anomalies.
Additionally, the model can be integrated into cloud-based platforms, where images from drones or stationary cameras are uploaded and analyzed remotely, allowing for scalable and centralized monitoring.
Each deployment method leverages the model’s capabilities to enhance the efficiency and accuracy of solar panel maintenance, ensuring optimal energy production and longevity.
Cite this Post
Use the following entry to cite this post in your research:
Nathan Marraccini. (Aug 2, 2024). Inspecting Solar Panels with Thermal Drones. Roboflow Blog: https://blog.roboflow.com/inspecting-solar-panels-with-thermal-drones/