
Using computer vision, you can build advanced systems to analyze the throughput of an assembly line.
Changes in throughput may be a leading indicator of a blockage up or downstream, a workload that is not properly balanced between assembly lines, or a data point that lets you analyze how throughput changes when a system stops and starts.
With Roboflow Workflows, you can build advanced throughput monitoring systems with computer vision, and without writing a line of code.
You can train custom models that identify specific products on your assembly line, then write custom logic to monitor capacity on lines in your facility.
In this guide, we are going to walk through how to build an assembly line throughput system that determines when capacity at a specific part of a line is above an expected amount, indicative of a blockage.
Here is a demo of the system we will build:
Here is an example of the system in action:
Without further ado, let’s get started!
Monitor Assembly Line Throughput with Computer Vision
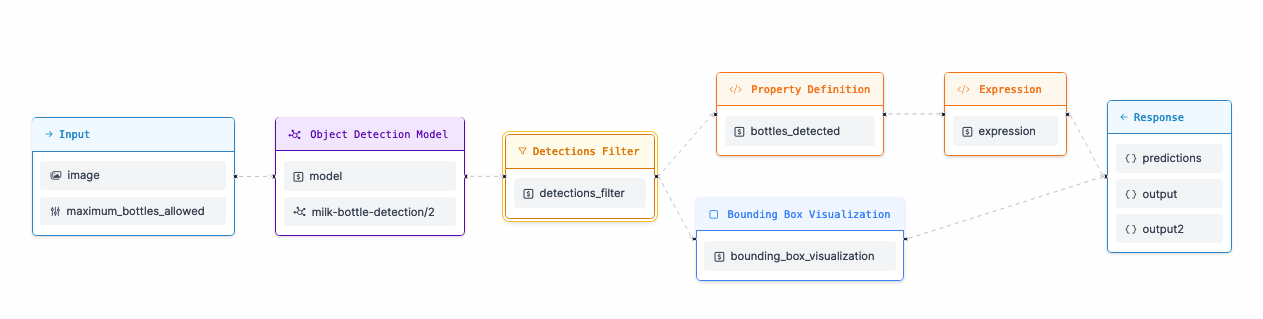
To build our assembly line throughput monitoring system, we will:
- Configure the system to accept an image or video input, and a number of maximum products that are allowed in view at a given time;
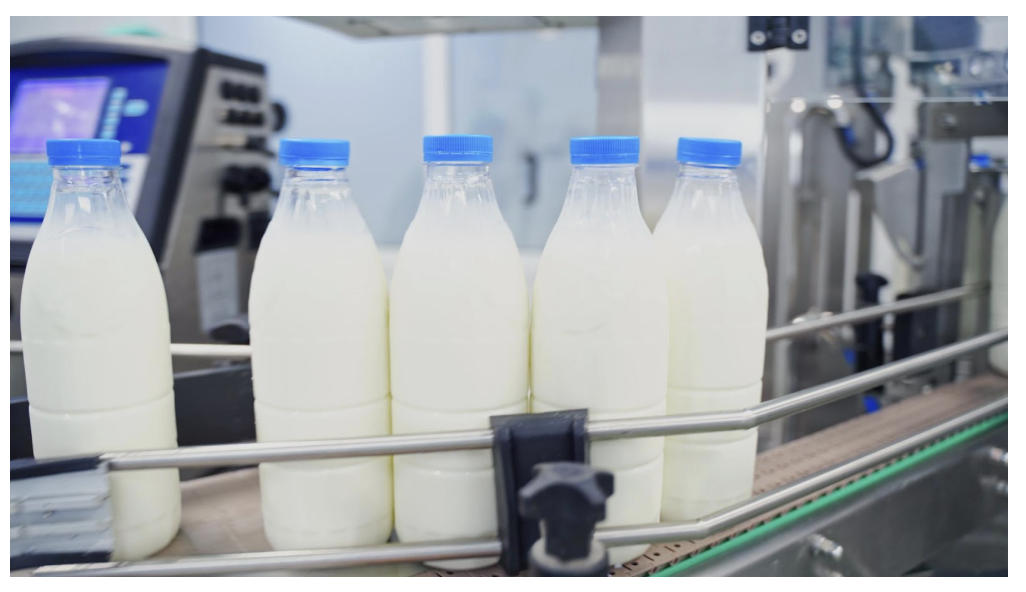
- Run an object detection to identify products (in this example, milk bottles);
- Define an expression that will say TRUE if the assembly line is over capacity, or FALSE if the assembly line is not over capacity;
- Draw the results from our model on the input image so that we can visualize our model performance, and;
- Return results from our system for processing.
Let’s discuss the main steps of the Workflow in detail.
What is Roboflow Workflows?
Workflows is a low-code computer vision application builder. With Workflows, you can build complex computer vision applications in a web interface and then deploy Workflows with the Roboflow cloud, on an edge device such as an NVIDIA Jetson, or on any cloud provider like GCP or AWS.
Workflows has a wide range of pre-built functions available for use in your projects and you can test your pipeline in the Workflows web editor, allowing you to iteratively develop logic without writing any code.
Configuring Inputs
Our system accepts two inputs:
- An image (which could also be a frame from a video), and;
- A maximum number of bottles allowed.
We will use these values to run our model and make a determination if there are too many bottles in view.
Detect Products on an Assembly Line with Computer Vision
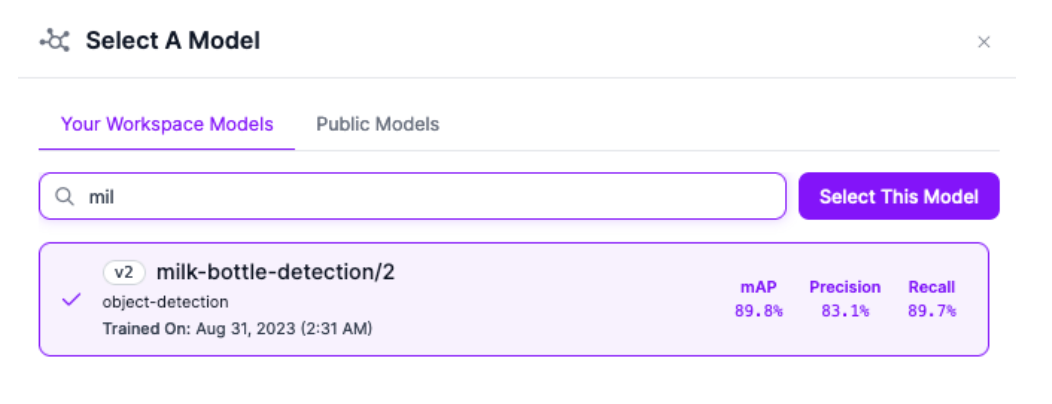
For this guide, we are using a milk bottle detection model. This model has been trained to identify milk bottles and bottle tops. You can use any model with the Workflow, however.
If you do not already have a trained object detection model to identify objects on your assembly line, refer to the Roboflow Getting Started guide to learn how to train a custom model that identifies objects of interest.
You can update the model that you use by clicking on the Object Detection Model block in the Workflow and updating the model ID. You can use any public model on Roboflow Universe, or models that are private in your workspace.
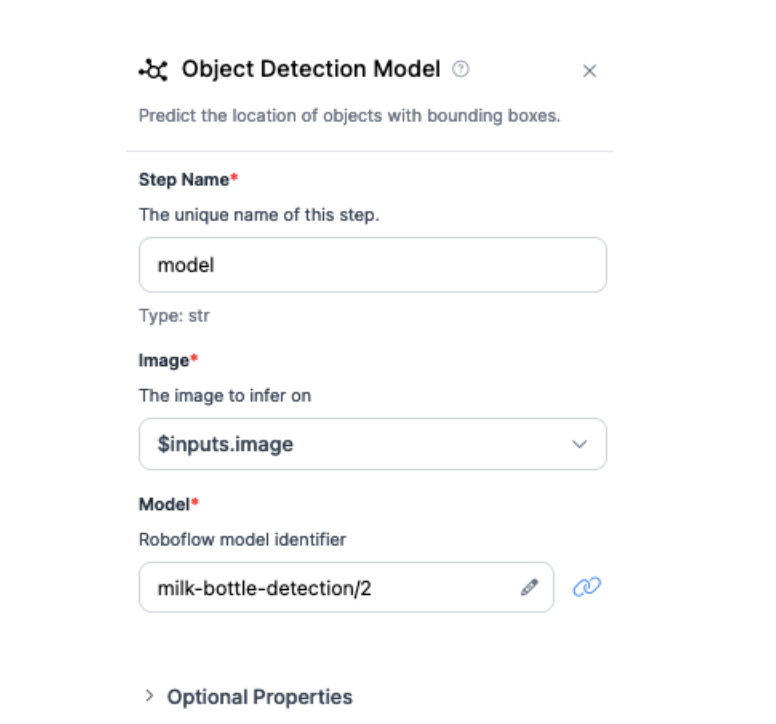
Click on the “Roboflow model identifier” input field to choose a model from your Workspace or add a model from Roboflow Universe:
Next, add a Detections Filter block to only include the bottle class.
Next, we need to count the number of bottles detected. We can do this with the Property Definition block.
Add the Property Definition block and select "Sequence Length" to count the number of bottles found:
Next, we'll use the expression block to read the bottles_detected value and compare it to the maximum_bottles_allowed value. If the number of bottles detected is greater than the maximum number allowed, the system will return TRUE. Otherwise, the system will return FALSE.
If the system returns TRUE, that means that our system is over capacity, according to the maximum number of cans we allow.
Configuring the Expression Block
First, add an Expression block to your Workflow.
First, we'll want to add the bottle_count as a parameter input to the Expression block.
- Click "Add Parameter" in the Expression block "switch" configuration.
- Type in bottle_count as the parameter name, and select the output of the Property Definition block, "$steps.bottles_detected.output" from the dropdown list
- Click "Add" to save the parameter for future use
Repeat steps 1-3 to add the maximum_bottles_allowed input as a parameter.
Now we'll be configuring the pass/fail logic using the case statement section.
- Click "Add Case Statement"
- Setup the logic to return true if the bottle_count is great than the maximum_bottle_allowed. You can click the link icon to reference a parameter value instead of taking a number as input.
Finally we'll want to set the default output to be "false".
Next, our Workflow selects the predictions and saves them in a property called bottles_detected. This property is then read by an expression block.
The expression block reads the bottles_detected value and compares it to the maximum_bottles_allowed value. If the number of bottles detected is greater than the maximum number allowed, the system will return TRUE. Otherwise, the system will return FALSE.
If the system returns TRUE, that means that our system is over capacity, according to the maximum number of cans we allow.
Visualizing Model Predictions
When testing Workflows, it is helpful to visualize the predictions from the model. These visuals can be used to inspect whether the model you have trained performs well on example images.
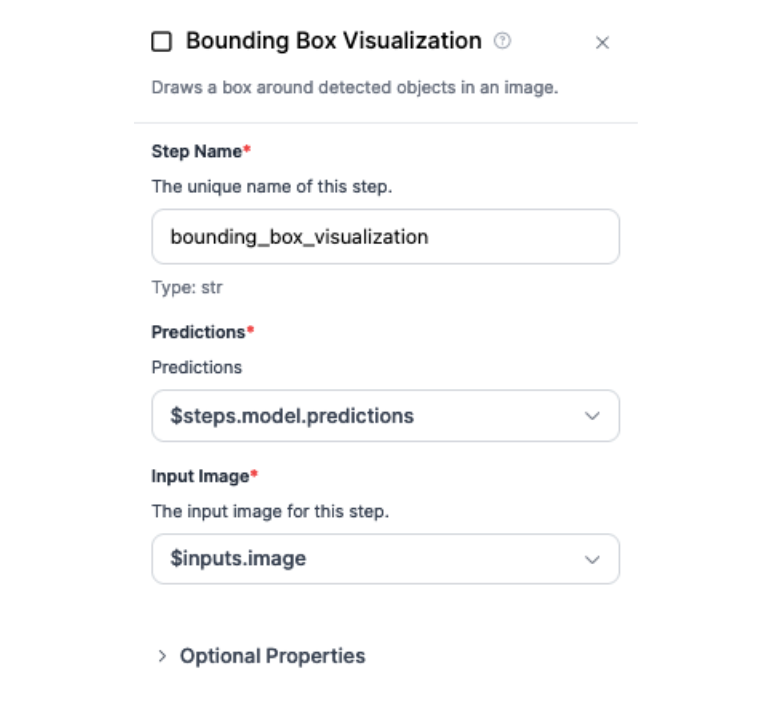
To visualize model predictions, we use a Bounding Box Visualization block. This block reads predictions from a model and plots the corresponding bounding boxes on the input image.
Here is how the block is configured:
Configuring the Output
Our Workflow returns three values:
- The predictions from the object detection model;
- The TRUE or FALSE determination that indicates whether our system is over or not over capacity, and;
- A visualization showing bounding boxes returned by our model.
Let’s run the system!
Testing the Workflow
To test a Workflow, click “Run Preview” at the top of the page.
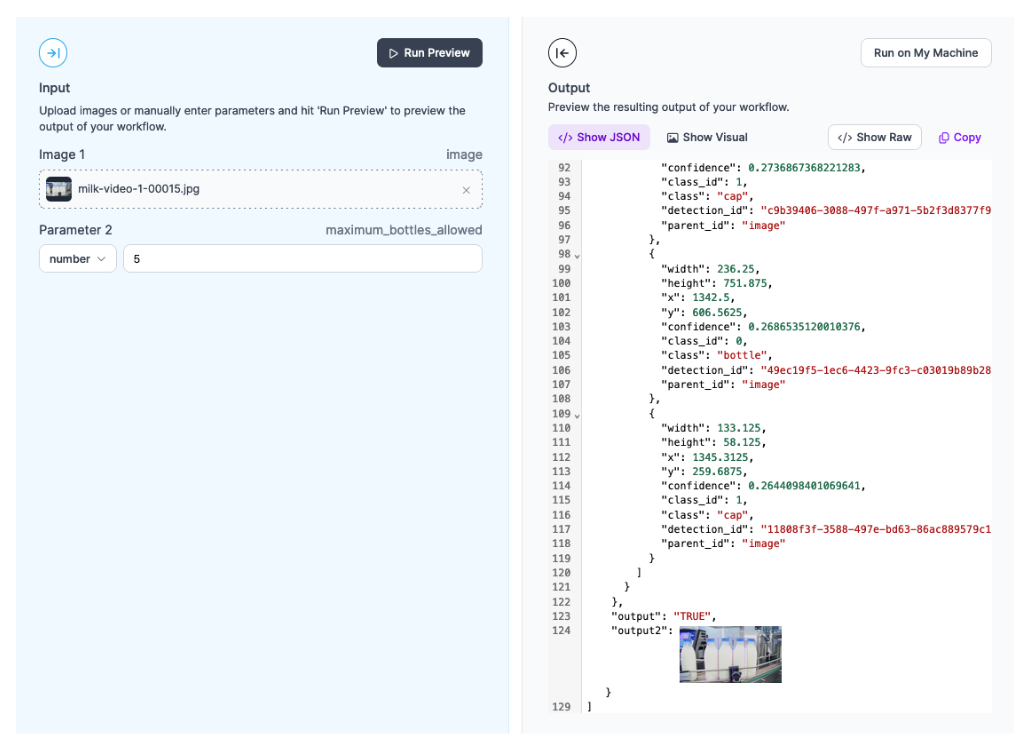
To run a preview, first drag and drop an image into the image input field. Then, set the maximum number of bottles allowed. For this demo, let’s say 5 bottles are allowed in view at a given time.
Click “Run Preview” to run your Workflow.
The Workflow will run and provide two outputs:
- A JSON view, with all of the data we configured our Workflow to return, and;
- A visualization of predictions from our model, drawn using the Bounding Box Visualization block that we included in our Workflow.
Let’s run the Workflow on this image:
Our Workflow returns TRUE, which indicates that more than five bottles were detected:
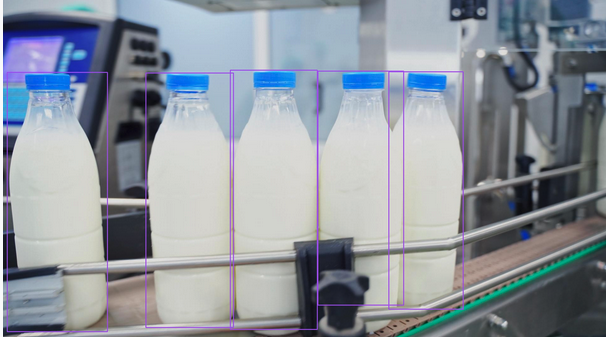
Here are the locations of the bottles identified:
Deploying the Workflow
Workflows can be deployed in the Roboflow cloud, or on an edge device such as an NVIDIA Jetson or a Raspberry Pi.
To deploy a Workflow, click “Deploy Workflow” in the Workflow builder. You can then choose how you want to deploy your Workflow.
Conclusion: Increase Assembly Line Throughput with Computer Vision
You can use computer vision to monitor the throughput of an assembly line.
In this guide, we built a system that uses an object detection model to detect milk bottles. The system then checks if there are more than a certain number of milk bottles in view at a given time. If the number of allowed bottles is exceeded, the system returns TRUE, indicating there may be a problem up or downstream (i.e. a blockage).
This system was built with Roboflow Workflows, a web-based computer vision application builder.
To learn more about building computer vision applications with Workflows, refer to the Roboflow Workflows documentation.
Cite this Post
Use the following entry to cite this post in your research:
James Gallagher. (Jul 25, 2024). Monitor and Increase Assembly Line Throughput with Computer Vision. Roboflow Blog: https://blog.roboflow.com/monitor-assembly-line-throughput/