
Drawing regions of interest on an image can be frustrating, especially when regions do not follow an easy-to-define pattern.
For example, consider a scenario where you want to draw two regions on an image to count how many vehicles are in each lane in a traffic photo. Drawing such regions would be difficult without pre-existing knowledge regarding the coordinates of each region in an image.
This video showcases how we'll create and use red/green zones to calculate counts of objects:
0:00/1×
Today, we’re excited to introduce PolygonZone, a new standalone web utility that lets you draw polygons on images and retrieve a Python NumPy array or a JSON object that contains the points in the polygons you have drawn.
In this guide, we’re going to show how to use PolygonZone to calculate polygon coordinates. We’ll then use these coordinates with the Roboflow Supervision Python package to track how many objects are present in a given region of interest. By the end of this post, you'll be able to do tracking in complex zones.
Step 1: Capture an Image
In this guide, we’re going to track how many cars are in a specific region on a traffic camera video. This video is taken from a camera focused on two lanes on a highway. We want to create three separate regions in the video and track how many people are present in each region.
To start, first we need to capture an image from the road video. This image must be the same size and resolution as the image so that the coordinates we draw later appear in the right place. If you want to draw polygons on a static image, you can skip this step.
In this tutorial, we’re going to be working from a notebook that uses the Roboflow supervision library to count how many items are in the polygons that we draw. Open up the accompanying notebook and execute the first two cells.
In the “Capture Image” section of the notebook, there is a line of code that saves the first frame in the video. Because the camera does not change angles during the video, we know that the polygons we draw on that frame will apply throughout the video.
Execute the code cell to save a frame to a file. Then, from Colab, download the image by clicking the image name in the sidebar, then the three dots, then the “Download” link:

Step 2: Calculate Polygon Coordinates
Next, open up PolygonZone in your web browser. Drag the “first_frame.png” file that you saved in the last step, or any other image on which you want to draw polygon coordinates, into the box that asks you to drop in a file:
0:00/1×
You can enlarge your image using a mouse wheel or laptop trackpad. When you are ready, click on the image to draw your polygon. Once you have drawn a polygon, click enter to complete the drawing. After you hit enter, you can create another polygon, and continue to repeat this process until you have drawn all of the zones of interest you need.
As you draw polygons, the Python and JSON code snippets at the bottom of the page will change, showing new coordinates as you draw them.
0:00/1×
In the example above, we have drawn two polygons: one for each lane in the traffic video.
Here’s the image of our road with the completed polygons:
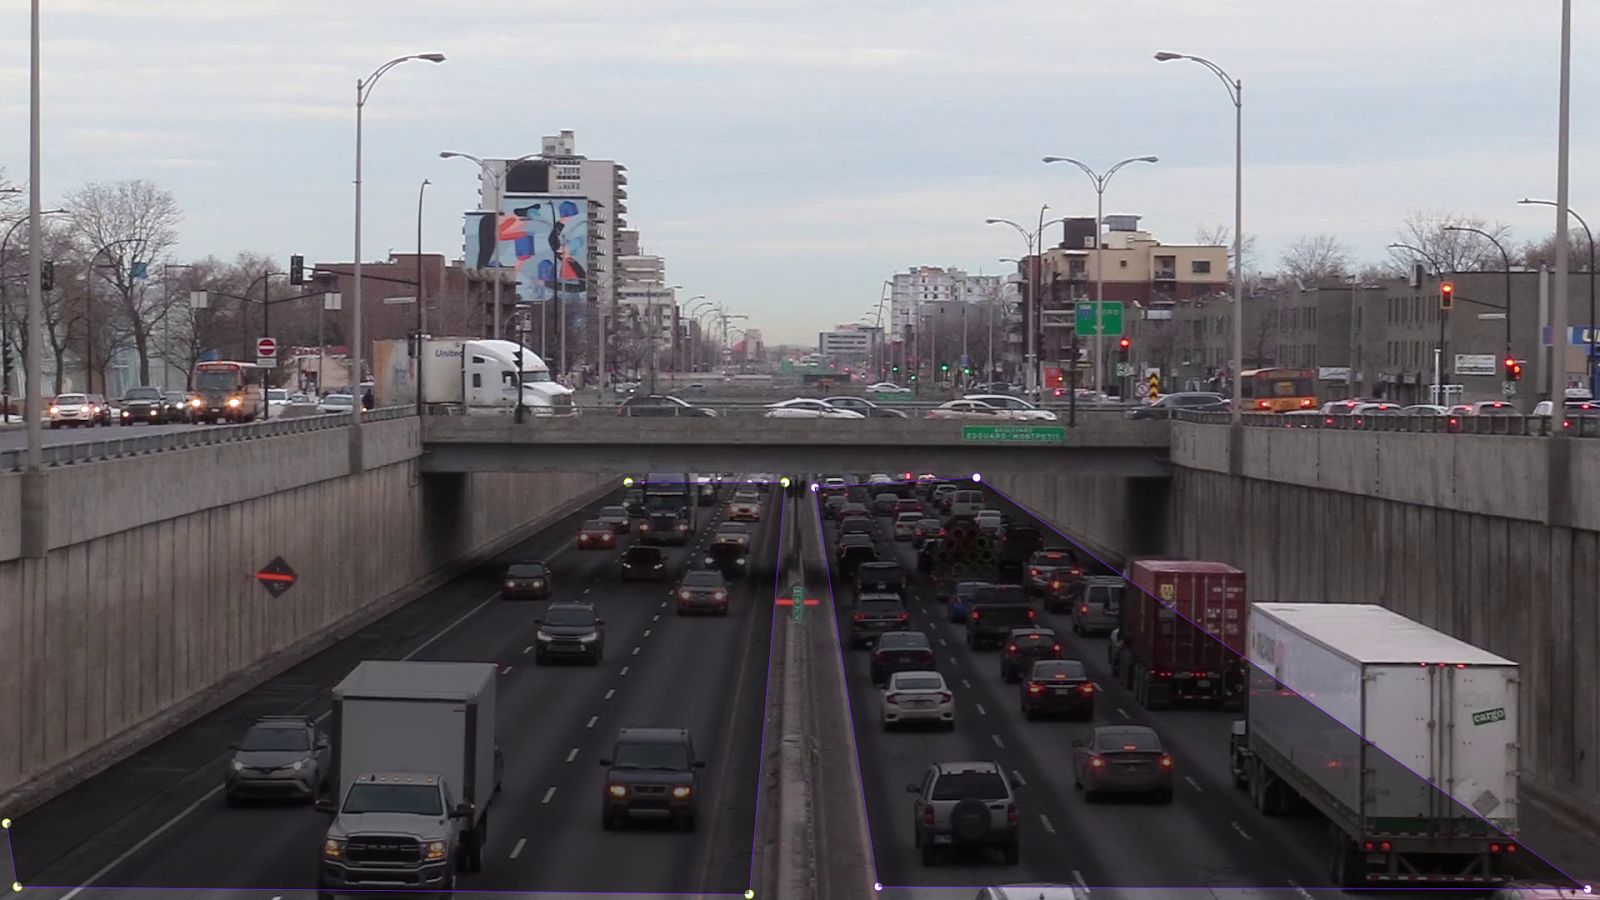
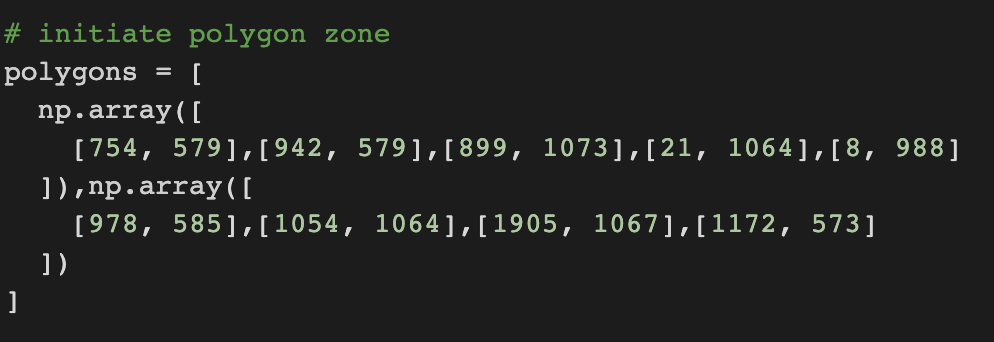
PolygonZone has generated some Python code that we can copy into a script to use to create the regions of interest in our video feed. We can also save our image for reference by clicking the “Save Image” button. Here is the NumPy code that was generated for our coordinates:
[
    np.array([
    [754, 579],[942, 579],[899, 1073],[21, 1064],[8, 988]
    ]),np.array([
    [978, 585],[1054, 1064],[1905, 1067],[1172, 573]
    ])
]
With the polygon coordinates ready, we can use them to monitor how many times objects appear in a region across both multiple images and frames in a video.
In the next section, we’ll use our coordinates to monitor how many vehicles are in the marked regions on our road.
Step 3: Use Supervision to Draw Coordinates
To draw coordinates on an image, we can use the Supervision Zones feature. The Zones feature lets you draw different zones on an image using polygon coordinates.
In the Colab notebook that we used in Step 1, substitute the “polygons” variable with the code that you retrieved from PolygonZone:
Then, run the corresponding cell in the notebook. Run the remaining cells up until the “Video Inference” section. These cells initialize the zone and annotator features so that we can draw zones and annotate them on our images. Then, our code executes a YOLOv8s model (without any fine-tuning) to run inference.
After you run the last cell, you’ll see your polygons drawn on your image. All detections that were returned by the model will be shown in an image in the Colab notebook. Here’s an example from the road video we are using:

The model has detected many vehicles in the marked region. There is a big number in the middle of each of the zones that shows how many predictions have been made in that zone. 12 vehicles were found in the lane on the left, and 11 vehicles were found in the lane on the right. The left lane is annotated in red and the right lane is annotated in green. Predictions of objects outside of the two zones are not shown on our annotated image. This is handled by the supervision library.
Some vehicles in the lanes were not annotated. This is because we are using a model without fine-tuning for this particular purpose. To improve our predictions, we could fine-tune a model that identifies cars. If you want to improve the model for the car counting use case, head to Roboflow Universe to find pre-trained datasets and models for car counting.
Bonus: Run Inference on a Video
The Colab notebook for this project contains a line of code that will use the polygons you have calculated to draw zones on every frame in the specified video. Execute the code cell under the “Video Inference” section to see your annotations apply to every frame in the video. Note that this may take a while depending on how large your video is.
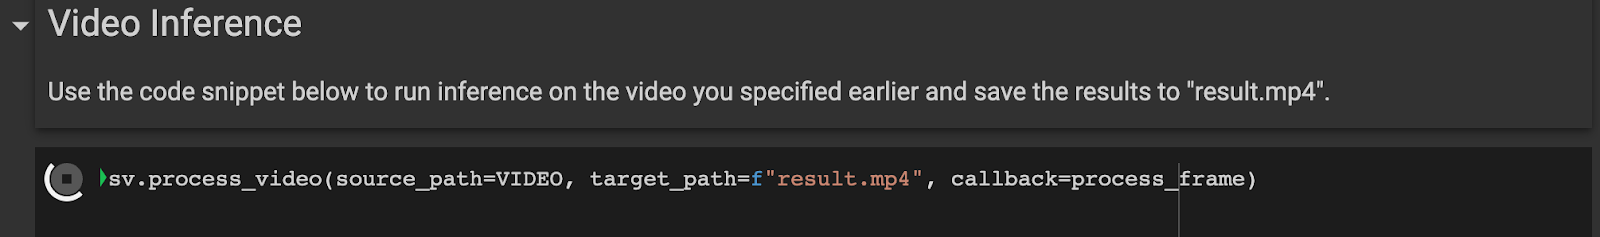
The annotated video is saved to a file called "result.mp4". The example result for our traffic counting application appears at the beginning of this article.
Conclusion
In this guide, we have walked through how to use PolygonZone to calculate polygon coordinates on an image. You can use these coordinates to draw regions of interest on an image. Combined with the supervision library, these coordinates can be used to monitor how many objects are in a given area.
With PolygonZone, calculating coordinates for polygons in your computer vision projects no longer has to be a manual, time-consuming process. Upload your image, draw your polygons, and copy the coordinates you need for use in your application.
The code for PolygonZone is open-source. If you are interested in helping us make this a better tool – through reporting bugs, brainstorming on new features, or even contributing code – check out our Contributing Guidelines for more information on how you can help.
Cite this Post
Use the following entry to cite this post in your research:
James Gallagher. (Feb 14, 2023). Launch: Calculate Polygon Coordinates with PolygonZone. Roboflow Blog: https://blog.roboflow.com/polygonzone/