
Computer vision has come a long way from simply detecting objects in images. Today's real-world applications demand intelligent systems that can interpret visual data, make decisions, and integrate seamlessly with existing business infrastructure.
In this guide, we'll explore how combining Roboflow's powerful computer vision capabilities with Claude's reasoning abilities creates a bridge between visual perception and actionable intelligence. While Roboflow excels at detecting and classifying objects in images, Claude can transform those detections into business logic, database queries, and automated workflows.
In this guide, we’ll be vibe coding using Claude Sonnet 4.5 and Roboflow Rapid to count and store the number of items moving on a conveyor belt in a database, providing potential to scale to be useful tools for real factories.
Let’s get started!
Use Roboflow Rapid for Fast Vision Model Creation
We'll get started by creating a Roboflow Rapid model. Rapid is a powerful tool for creating and deploying computer vision models in minutes. To build with Rapid, you’ll have to create a new project in Roboflow. But instead of the traditional infrastructure, make sure to select Rapid.
From here, upload your project video. The video I’m using is a sample video of donuts moving across a conveyor belt.

From here, all the setup required is annotating one instance of the object you are trying to detect.
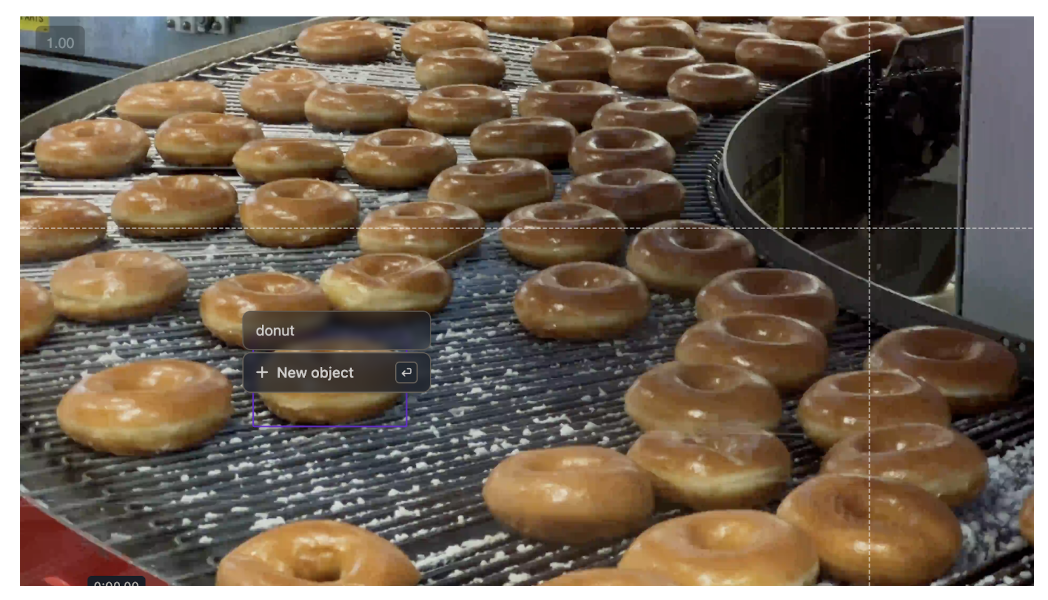
Rapid is awesome at picking up your detections and generating an accurate object detection model. After you’ve annotated the class, build the model and wait for Rapid to finish training the model.

Learn more about using Roboflow Rapid here.
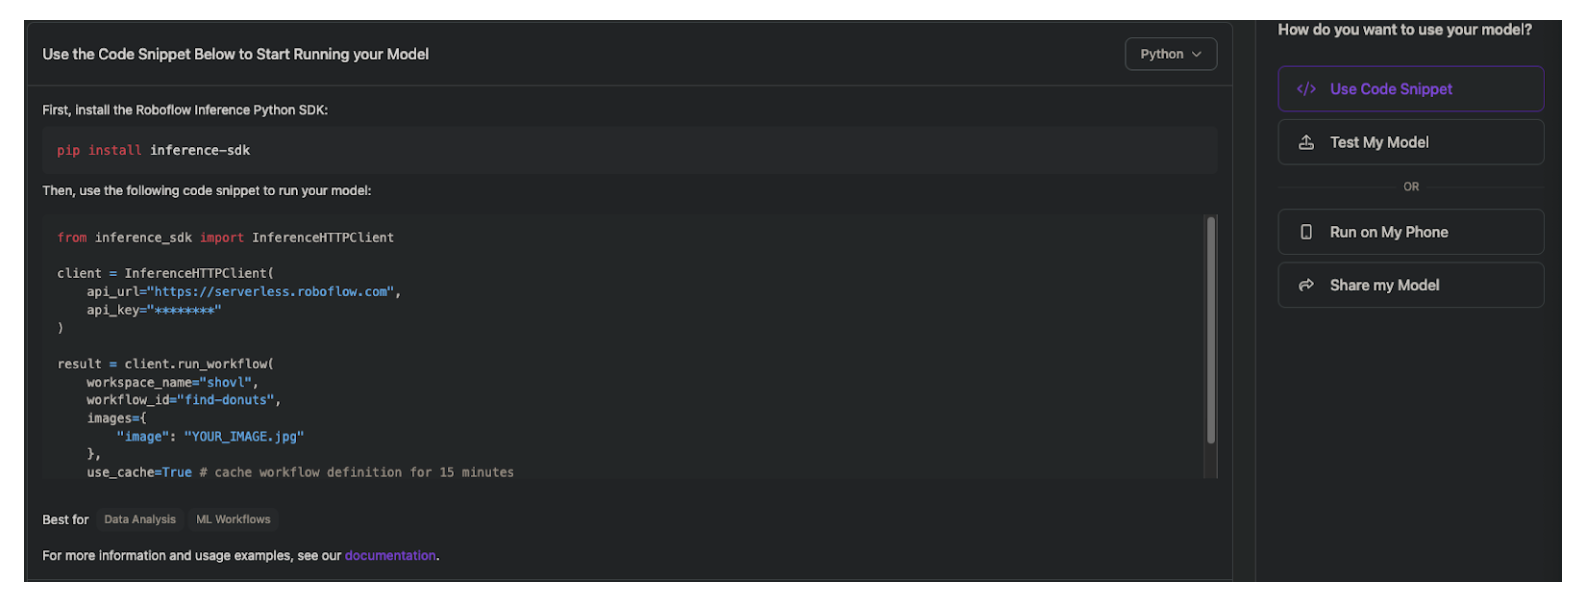
From here, we are going to refer to the deployment code sample, provided to us with the Inference SDK library from Roboflow. Click the “use code snippet” option and select the Python version.
With this code, we can use Claude to prompt our way to getting a visualization for the video. Since we’re going to be counting how many donuts move across the conveyor belt, something we can do to accomplish this is implement a Line counter. The linked blog explains what a Line counter is and how to implement it using Roboflow Workflows. However, since we’ll later be integrating these to a database, we can easily implement this on our own.
Build a Visualization with Claude
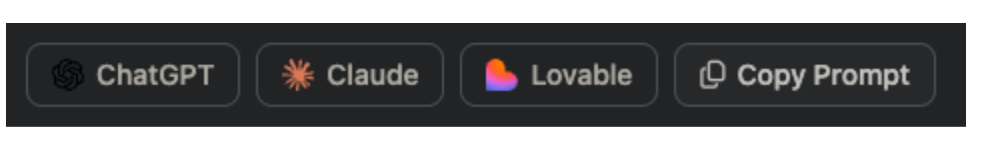
Right where the Inference SDK snippet is provided, is a handy “Copy Prompt” button to copy Roboflow integration instructions to any generative AI tool to help it during its building process:
Claude can then refer to this as a part of our prompt:
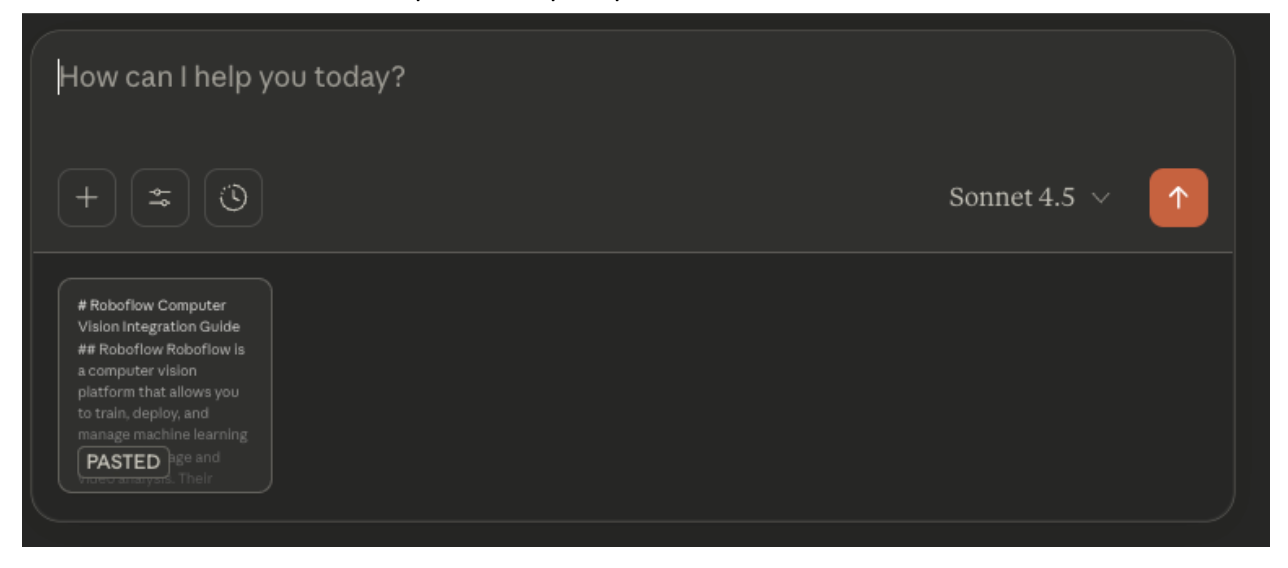
From here, we just need to instruct Claude Sonnet 4.5 how to build our tool. Here is an example template for a prompt:
Build a Python script to count objects crossing a line in a video.

I'll provide:
- Roboflow Inference SDK integration code with API key
- Line coordinates

You need to:
1. Implement object tracking to assign consistent IDs across frames
2. Create a line counter that detects when objects cross a defined line
3. Add visualizations using Supervision library:
   - Bounding boxes with labels (ID + confidence)
   - Counting line overlay
   - Count display

Process the video frame-by-frame and output an annotated video showing detections and the running count.

Integration Code:
from inference_sdk import InferenceHTTPClient

client = InferenceHTTPClient(
    api_url="https://serverless.roboflow.com",
    api_key="YOUR_API_KEY"
)

result = client.run_workflow(
    workspace_name="YOUR_WORKSPACE",
    workflow_id="YOUR_WORKFLOW_ID",
    images={
        "image": "YOUR_IMAGE.jpg"
    },
    use_cache=True # cache workflow definition for 15 minutes
)

Line: [[689, 225], [106, 424]]
The details of the integration code are all provided by copying the snippet in the Rapid preview, so the only thing you’ll need to do is get line coordinates. By playing around with your desired coordinates (after visualization), you can find the ones that work well. Additionally, we’ll be using Supervision, Roboflow’s library for computer vision tools such as annotations.
From this prompt, Claude was able to generate code that visualizes and counts objects, quite effectively:
Bimport cv2
import numpy as np
from inference_sdk import InferenceHTTPClient
from collections import defaultdict
import os
import supervision as sv

class SimpleTracker:
    """Simple centroid-based tracker for object counting"""
    def __init__(self, max_distance=50):
        self.next_id = 0
        self.tracked_objects = {}  # {id: centroid}
        self.max_distance = max_distance

    def update(self, detections):
        """Update tracker with new detections and assign IDs"""
        if not detections:
            return []

        # Calculate centroids for new detections
        new_centroids = []
        for det in detections:
            cx = det['x']
            cy = det['y']
            new_centroids.append(np.array([cx, cy]))

        # If no existing tracks, create new ones
        if not self.tracked_objects:
            for i, centroid in enumerate(new_centroids):
                self.tracked_objects[self.next_id] = centroid
                detections[i]['tracker_id'] = self.next_id
                self.next_id += 1
            return detections

        # Match new detections to existing tracks
        old_ids = list(self.tracked_objects.keys())
        old_centroids = list(self.tracked_objects.values())

        # Calculate distance matrix
        matched_ids = []
        used_detections = set()

        for old_idx, old_id in enumerate(old_ids):
            old_centroid = old_centroids[old_idx]
            min_dist = float('inf')
            min_idx = -1

            for new_idx, new_centroid in enumerate(new_centroids):
                if new_idx in used_detections:
                    continue

                dist = np.linalg.norm(old_centroid - new_centroid)
                if dist < min_dist:
                    min_dist = dist
                    min_idx = new_idx

            # If close enough, match them
            if min_idx != -1 and min_dist < self.max_distance:
                detections[min_idx]['tracker_id'] = old_id
                self.tracked_objects[old_id] = new_centroids[min_idx]
                used_detections.add(min_idx)
                matched_ids.append(old_id)

        # Create new tracks for unmatched detections
        for idx, det in enumerate(detections):
            if idx not in used_detections:
                det['tracker_id'] = self.next_id
                self.tracked_objects[self.next_id] = new_centroids[idx]
                self.next_id += 1

        # Remove old tracks that weren't matched
        self.tracked_objects = {k: v for k, v in self.tracked_objects.items()
                               if k in [d['tracker_id'] for d in detections]}

        return detections


class LineCounter:
    """Counts objects crossing a line segment"""
    def __init__(self, line_start, line_end, triggering_anchor="BOTTOM"):
        self.line_start = np.array(line_start, dtype=float)
        self.line_end = np.array(line_end, dtype=float)
        self.triggering_anchor = triggering_anchor
        self.crossed_ids = set()
        self.count = 0
        self.track_history = defaultdict(list)

    def get_anchor_point(self, det, anchor="BOTTOM"):
        """Get the anchor point from detection"""
        x, y, w, h = det['x'], det['y'], det['width'], det['height']

        if anchor == "BOTTOM":
            return np.array([x, y + h/2], dtype=float)
        elif anchor == "TOP":
            return np.array([x, y - h/2], dtype=float)
        elif anchor == "CENTER":
            return np.array([x, y], dtype=float)
        elif anchor == "LEFT":
            return np.array([x - w/2, y], dtype=float)
        elif anchor == "RIGHT":
            return np.array([x + w/2, y], dtype=float)
        return np.array([x, y + h/2], dtype=float)

    def cross_product_2d(self, p1, p2, p3):
        """Calculate 2D cross product to determine which side of line a point is on"""
        return (p2[0] - p1[0]) * (p3[1] - p1[1]) - (p2[1] - p1[1]) * (p3[0] - p1[0])

    def update(self, detections):
        """Update counter with new detections"""
        for det in detections:
            track_id = det.get('tracker_id', None)
            if track_id is None:
                continue

            # Get anchor point
            anchor_point = self.get_anchor_point(det, self.triggering_anchor)

            # Store in history
            self.track_history[track_id].append(anchor_point)

            # Keep only last 2 positions
            if len(self.track_history[track_id]) > 2:
                self.track_history[track_id] = self.track_history[track_id][-2:]

            # Check for line crossing
            if len(self.track_history[track_id]) == 2 and track_id not in self.crossed_ids:
                prev_point = self.track_history[track_id][0]
                curr_point = self.track_history[track_id][1]

                # Calculate cross products
                prev_cross = self.cross_product_2d(self.line_start, self.line_end, prev_point)
                curr_cross = self.cross_product_2d(self.line_start, self.line_end, curr_point)

                # Check if points are on opposite sides (line crossing occurred)
                if prev_cross * curr_cross < 0:
                    # Count the crossing
                    self.count += 1
                    self.crossed_ids.add(track_id)
                    print(f"Object {track_id} crossed the line! Total count: {self.count}")


def process_video(video_path, output_path, line_coords):
    """Process video with object detection and line counting"""

    # Initialize Roboflow client
    client = InferenceHTTPClient(
        api_url="https://serverless.roboflow.com",
        api_key="YOUR_API_KEY"
    )

    # Initialize tracker and line counter
    tracker = SimpleTracker(max_distance=100)
    line_counter = LineCounter(
        line_start=line_coords[0],
        line_end=line_coords[1],
        triggering_anchor="BOTTOM"
    )

    # Initialize supervision annotators
    box_annotator = sv.BoxAnnotator(
        thickness=1
    )

    label_annotator = sv.LabelAnnotator(
        text_thickness=1,
        text_scale=0.6,
        text_padding=3
    )

    # Open video
    cap = cv2.VideoCapture(video_path)

    # Get video properties
    fps = int(cap.get(cv2.CAP_PROP_FPS))
    width = int(cap.get(cv2.CAP_PROP_FRAME_WIDTH))
    height = int(cap.get(cv2.CAP_PROP_FRAME_HEIGHT))
    total_frames = int(cap.get(cv2.CAP_PROP_FRAME_COUNT))

    # Initialize video writer
    fourcc = cv2.VideoWriter_fourcc(*'mp4v')
    out = cv2.VideoWriter(output_path, fourcc, fps, (width, height))

    frame_count = 0

    print(f"Processing video: {total_frames} frames at {fps} FPS")
    print(f"Line coordinates: {line_coords}")

    while cap.isOpened():
        ret, frame = cap.read()
        if not ret:
            break

        frame_count += 1

        # Save frame temporarily
        temp_frame_path = f"temp_frame.jpg"
        cv2.imwrite(temp_frame_path, frame)

        try:
            # Run inference
            result = client.run_workflow(
                workspace_name="YOUR_WORKSPACE",
                workflow_id="YOUR_WORKFLOW_ID",
                images={"image": temp_frame_path},
                use_cache=True
            )

            # Debug on first frame
            if frame_count == 1:
                print("\n=== DEBUG: API Response Structure ===")
                print(f"Result type: {type(result)}")
                if isinstance(result, list):
                    print(f"Result length: {len(result)}")
                    if len(result) > 0:
                        print(f"First item type: {type(result[0])}")
                        if isinstance(result[0], dict):
                            print(f"First item keys: {list(result[0].keys())}")
                            for key in result[0].keys():
                                val = result[0][key]
                                if isinstance(val, dict):
                                    print(f"  {key} type: dict with keys: {list(val.keys())}")
                                elif isinstance(val, list):
                                    print(f"  {key} type: list with length: {len(val)}")
                                elif isinstance(val, str):
                                    print(f"  {key} type: str (length: {len(val)})")
                                else:
                                    print(f"  {key} type: {type(val)}")
                print("=====================================\n")

            # Extract predictions - correct path is result[0]['predictions']['predictions']
            predictions = []
            if isinstance(result, list) and len(result) > 0:
                result_data = result[0]

                if 'predictions' in result_data:
                    preds_data = result_data['predictions']
                    if isinstance(preds_data, dict) and 'predictions' in preds_data:
                        predictions = preds_data['predictions']
                        if frame_count == 1 and predictions:
                            print(f"✓ Found {len(predictions)} predictions in frame 1")
                            print(f"First prediction sample: {predictions[0]}")

            if frame_count == 1 and not predictions:
                print("✗ WARNING: No predictions found!")
                print(f"Available keys: {list(result[0].keys()) if isinstance(result, list) and result else 'N/A'}")

            # Update tracker with predictions
            if predictions:
                predictions = tracker.update(predictions)

                # Convert predictions to supervision Detections format
                xyxy = []
                confidence = []
                class_id = []
                tracker_id = []

                for pred in predictions:
                    x1 = pred['x'] - pred['width']/2
                    y1 = pred['y'] - pred['height']/2
                    x2 = pred['x'] + pred['width']/2
                    y2 = pred['y'] + pred['height']/2

                    xyxy.append([x1, y1, x2, y2])
                    confidence.append(pred['confidence'])
                    class_id.append(pred['class_id'])
                    tracker_id.append(pred.get('tracker_id', 0))

                # Create supervision Detections object
                detections = sv.Detections(
                    xyxy=np.array(xyxy),
                    confidence=np.array(confidence),
                    class_id=np.array(class_id),
                    tracker_id=np.array(tracker_id)
                )

                # Update line counter
                line_counter.update(predictions)

                # Create labels with tracker IDs
                labels = [f"#{tracker_id[i]} {confidence[i]:.2f}"
                         for i in range(len(detections))]

                # Annotate frame with supervision
                frame = box_annotator.annotate(scene=frame, detections=detections)
                frame = label_annotator.annotate(scene=frame, detections=detections, labels=labels)

        except Exception as e:
            print(f"Error processing frame {frame_count}: {e}")
        finally:
            # Clean up temp file
            if os.path.exists(temp_frame_path):
                os.remove(temp_frame_path)

        # Draw counting line with supervision
        line_zone = sv.LineZone(
            start=sv.Point(line_coords[0][0], line_coords[0][1]),
            end=sv.Point(line_coords[1][0], line_coords[1][1])
        )
        line_zone_annotator = sv.LineZoneAnnotator(
            thickness=2,
            text_thickness=2,
            text_scale=0.8
        )

        # Annotate line (note: we use our custom counter, not supervision's)
        frame = cv2.line(frame, tuple(line_coords[0]), tuple(line_coords[1]), (0, 0, 255), 4)

        # Draw count display with better styling
        count_text = f"Count: {line_counter.count}"

        # Create a nice background box for the count
        (text_width, text_height), baseline = cv2.getTextSize(
            count_text, cv2.FONT_HERSHEY_SIMPLEX, 1.5, 3
        )

        # Draw semi-transparent background
        overlay = frame.copy()
        cv2.rectangle(overlay, (5, 5), (text_width + 30, text_height + 30), (0, 0, 0), -1)
        cv2.addWeighted(overlay, 0.6, frame, 0.4, 0, frame)

        # Draw white text with black outline
        cv2.putText(frame, count_text, (15, text_height + 15),
                   cv2.FONT_HERSHEY_SIMPLEX, 1.5, (0, 0, 0), 5)
        cv2.putText(frame, count_text, (15, text_height + 15),
                   cv2.FONT_HERSHEY_SIMPLEX, 1.5, (255, 255, 255), 3)

        # Write frame
        out.write(frame)

        # Frame by frame progress update
        detections_count = len(predictions) if predictions else 0
        print(f"Frame {frame_count}/{total_frames} | Detections: {detections_count} | Count: {line_counter.count}")

    # Cleanup
    cap.release()
    out.release()

    print(f"\n{'='*50}")
    print(f"Processing complete!")
    print(f"Total objects counted: {line_counter.count}")
    print(f"Output saved to: {output_path}")
    print(f"{'='*50}")


if __name__ == "__main__":
    # Configuration
    VIDEO_PATH = "test.mp4"  # Replace with your video path
    OUTPUT_PATH = "output_counted.mp4"

    # Line coordinates from your config: [[689,225], [106,424]]
    LINE_COORDS = [[689, 225], [106, 424]]

    # Process video
    process_video(VIDEO_PATH, OUTPUT_PATH, LINE_COORDS)
Before you run, it’s imperative to install the inference SDK library as well as supervision, so run in your terminal:
pip install inference-sdk supervisionAfter running and tweaking the line for the line counter, the generated code can create intricate visualizations with an accurate counter. Make sure to change the video path to the video we’re working with:
Now that we can do this, we’re just a few prompts away from connecting this to a database and storing the predictions.
Connect to a MongoDB Database with Claude Sonnet 4.5 for Storing Results
Start by creating a new project in MongoDB. MongoDB is very efficient because of its easy integration. This blogpost guide walks through how you can create a Database in MongoDB.
To use MongoDB, you’ll need to install the necessary library with:
python -m pip install "pymongo[srv]"The next thing we’ll need is the connection string. It can be found in the connection settings in your cluster:
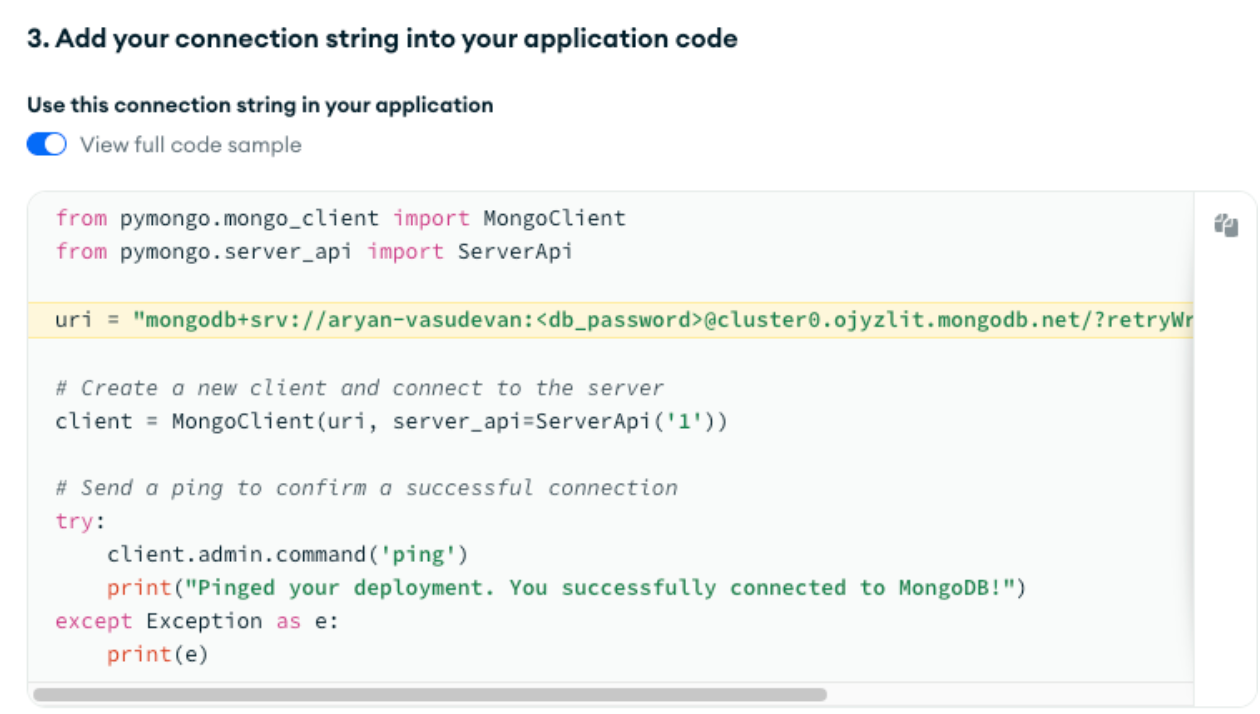
The connection string stored in the uri variable looks something like this:
"mongodb+srv://<db_username>:<db_password>@cluster0.ojyzlit.mongodb.net/?retryWrites=true&w=majority&appName=<db_cluster_name>"If you copy the connection string directly from your own Cluster, all you’ll need to replace is the <db_password> field, and this is the password for the username that's accessing the database. Now, we’ll prompt Claude again to use this connection string to connect it to the database.
Prompt:
After the video processing completes, save the results to MongoDB.

MongoDB details:
- Connection string: "YOUR_CONNECTION_STRING"
- Database name: donut_counter
- Collection name: counts

Create a document with:
- count: the total number of objects counted
- video_filename: name of the video file
- timestamp: current UTC time

Use pymongo with ServerApi('1'). Print confirmation when successfully connected and saved.
This will create a new document with the counts from the video, the file name, as well as the timestamp. From here, running the code that Claude generates should yield swift database saving after processing the video:
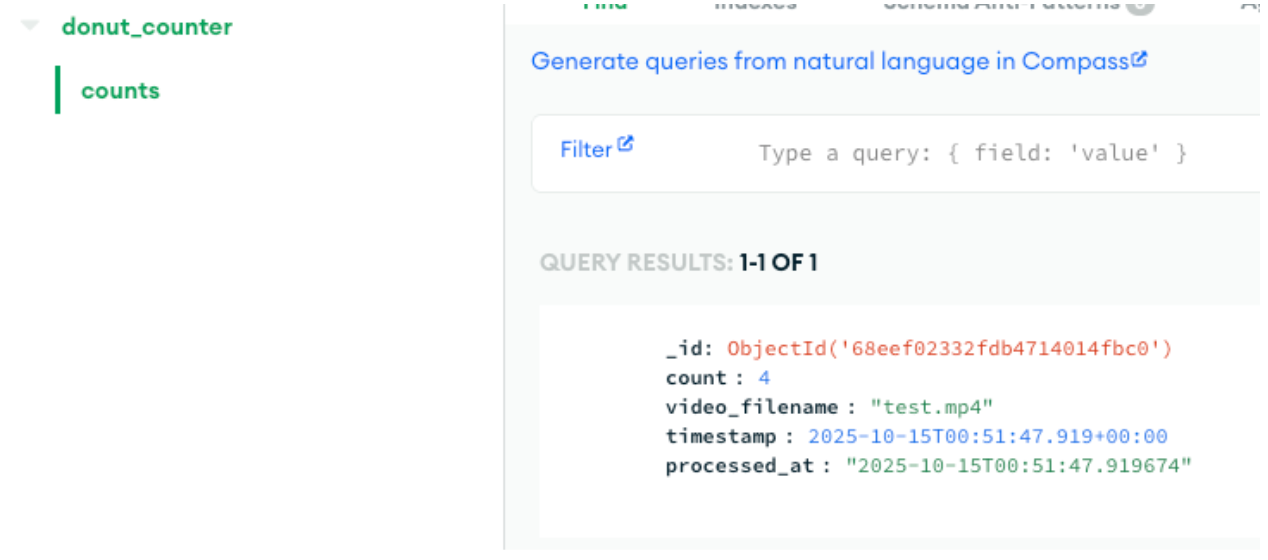
And with that, the tool is complete!
Build a Vision App with Claude Sonnet 4.5 and Roboflow Conclusion
Although a simple donut counter, it demonstrates something much bigger: computer vision paired with intelligent logic creates scalable, real-world solutions.
Written by Aryan Vasudevan
Cite this Post
Use the following entry to cite this post in your research:
Contributing Writer. (Dec 10, 2025). How to Build a Vision App with Claude and Roboflow. Roboflow Blog: https://blog.roboflow.com/build-vision-app-claude-and-roboflow/