
When you are working in Google Colab, you may run into an issue where OpenCV’s imshow() function does not work correctly. As a result, many people use alternatives for plotting images: Google’s OpenCV plotting function replacement for notebooks, matplotlib, or other packages.
One way to display images in Colab is to use supervision, an open source Python package with a wide range of utilities for use in working with images and computer vision model outputs.
In this guide, we are going to walk through how to plot an image in Google Colab with supervision. At the end of this guide, we will also discuss supervision annotators, which you can use to plot results from common computer vision models.
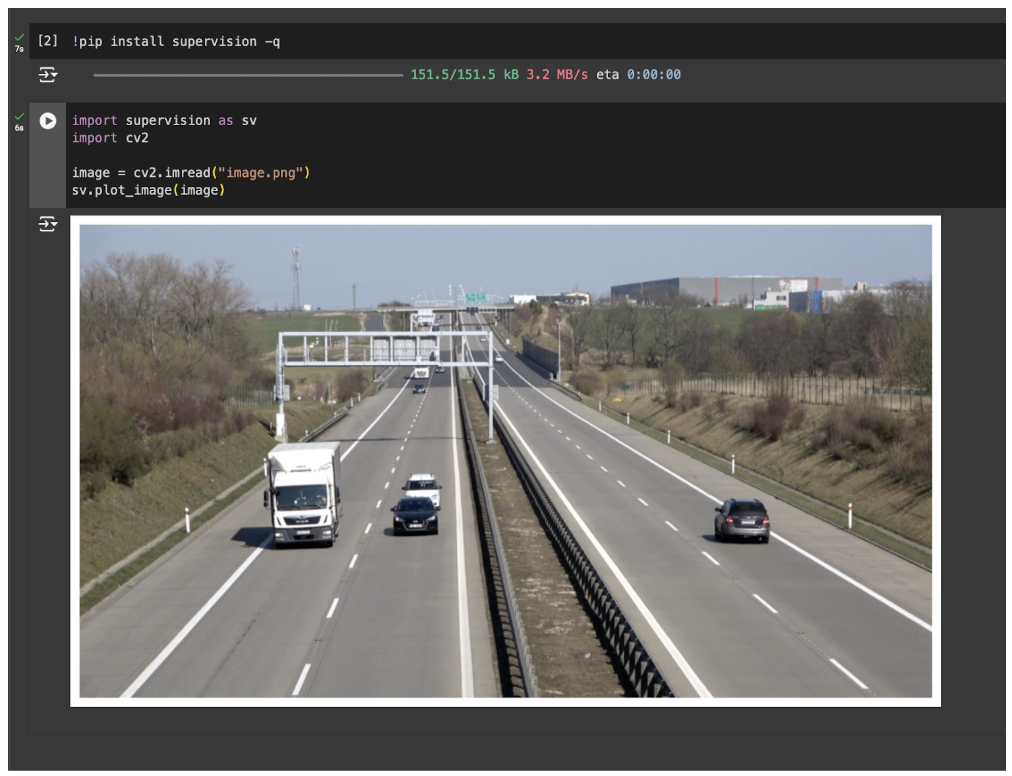
Here is an example showing the code we will use in a notebook:
Without further ado, let’s get started!
Plot an Image in Google Colab
To get started, first install the supervision Python package:
!pip install supervisionWe are going to use the sv.plot_image() function plot images. This function accepts images in two formats:
- NumPy array (the format used by OpenCV), and;
- PIL, used by the Python Imaging Library (PIL).
In a code cell in your Colab notebook, add the following code:
import supervision as sv

sv.plot_image(image)
Above, replace “image” with either a NumPy array or a PIL image.
Here is an example showing how to plot an image from OpenCV:
import supervision as sv
import cv2

image = cv2.imread(“image.jpeg”)
sv.plot_image(image)
Here is an example showing the supervision plot function in Colab:
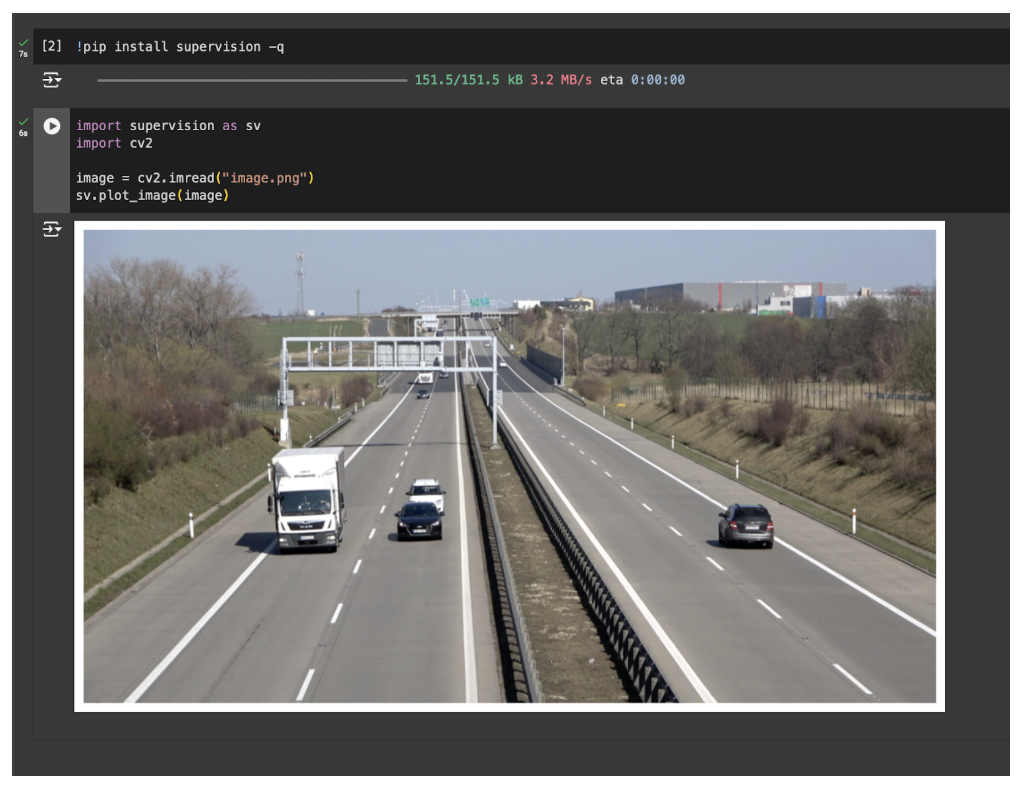
With one line of code, the sv.plot_image() function, we are able to plot images.
Bonus: Plot Computer Vision Detections
For computer vision use cases, you may want to plot detections on an image before you display the results in Google Colab. For example, consider a scenario where you are working with an object detection model and want to plot the predictions.
You could do so with the following code:
import cv2
import supervision as sv
from inference import get_model

model = get_model(model_id="yolov8n-640")
image = cv2.imread(<SOURCE_IMAGE_PATH>)
results = model.infer(image)[0]
detections = sv.Detections.from_inference(results)

box_annotator = sv.BoundingBoxAnnotator()
label_annotator = sv.LabelAnnotator(text_position=sv.Position.CENTER_OF_MASS)

annotated_image = box_annotator.annotate(
	scene=image, detections=detections)
annotated_image = label_annotator.annotate(
	scene=annotated_image, detections=detections)

sv.plot_image(annotated_image)
In the above code, we load a model, run inference on the model, then display the results with a box and label annotator.
You can replace from_inference with any supported supervision data loader, including:
- from_deepsparse (Deepsparse)
- from_detectron2 (Detectron2)
- from_mmdetection (MMDetection)
- from_sam (Segment Anything Model)
- from_yolo_nas (YOLO-NAS)
Here is an example of the model running on an image:
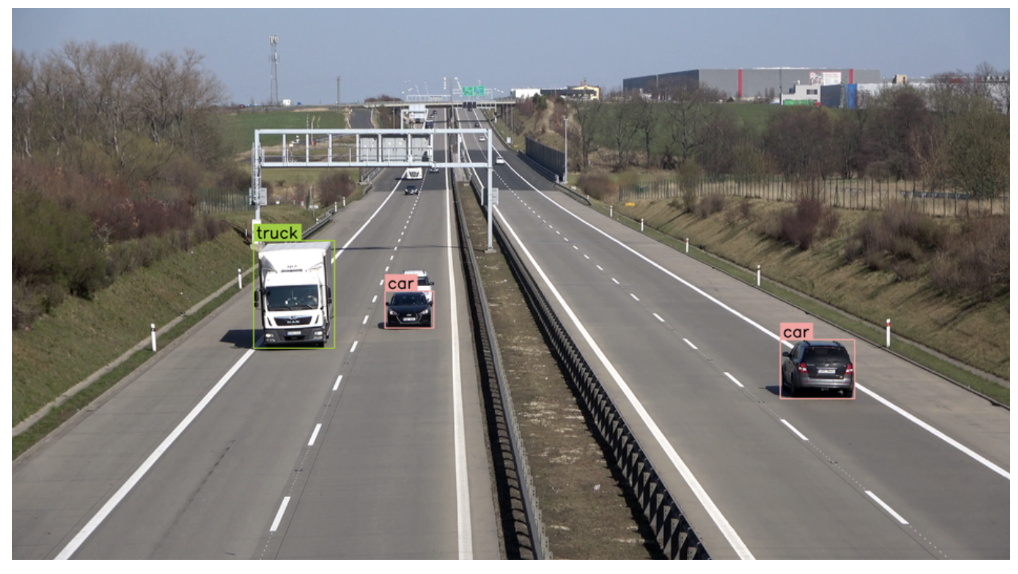
We successfully plotted the image with bounding boxes and labels.
Conclusion
You can use the supervision sv.plot_image() function to plot an image in Google Colab in a single line of code. This function can optionally be used with the supervision annotators API to visualize results from object detection, segmentation, and keypoint models.
To learn more about supervision’s suite of computer vision and image processing tools, refer to the supervision API documentation.
Cite this Post
Use the following entry to cite this post in your research:
James Gallagher. (Sep 3, 2024). How to Display an Image in Google Colab. Roboflow Blog: https://blog.roboflow.com/display-an-image-in-google-colab/