
If you have trucks, trailers, and dock doors, you have some big questions: Which spots are empty, which are occupied, and how can I measure this automatically?
In this article, we’ll walk through how to build a computer vision workflow that detects which stalls or dock doors are empty vs. occupied, reads the stall/dock numbers with OCR, and outputs actionable JSON and CSV so you can run dock door utilization and time studies without manual clipboards.
Our example is built on drone footage of a parking lot with numbered stalls, but the exact same pattern applies to dock doors along a building, yard slots, or any structured parking layout you want to analyze.
We’ll use:
- Roboflow Rapid to detect trailers and stall numbers
- Roboflow Workflows to add logic and transformations
- OCR with GPT-5 Nano (or your OCR of choice) to read stall numbers as text
By the end, you’ll have a workflow that clearly reports: which stalls are occupied, which are empty, and the exact stall or dock numbers as clean text, ready to flow directly into your logistics systems, dashboards, or alerts.
How to Build a System to Track Vehicles Using Docks
Here's how to run a real-world usage and dwell-time study on different vehicle types at docks. This is the workflow we'll create.
Step 1: Define the problem
Before we ever run a model, we start by defining the problem in human terms: what actually makes a stall or dock occupied? The rule is simple: empty stalls don’t have trailers, occupied stalls do. We also recognize that not everything in our image is going to be a stall; stalls are specifically the locations with numbers painted next to them.
That leads us to a straightforward piece of logic: first, detect stall numbers (or dock door numbers), then detect trailers or trucks, and finally ask a single question for each number: Is there a trailer next to, or at least to the left of, this stall or dock label? If yes, we treat that position as occupied; if not, it’s empty.
For reporting and logistics, we also need to read the number itself (“645”, “Dock 12”, etc.) with OCR so we can tie each detection back to a specific, human-meaningful location. That mental model becomes the blueprint we translate into a vision pipeline. In short, a dock door utilization tracking system should provide:
- A visual overlay that shows which spots are empty vs. occupied
- A JSON output of stall or dock numbers, labeled with their state
- An optional CSV export for batch studies and engineering analysis
Step 2: Detect Trailers and Stall Numbers with Roboflow Rapid
Let's start building our model. Go to Roboflow Rapid and upload your yard video.
- Prompt Rapid with what we’re looking for (e.g. trailer, dock number)
- Rapid immediately returns a detector that finds those objects
- You can adjust sensitivity to help pick up small numbers (numbers are harder than big vehicles), scrub to different frames to validate detections, and run it across the entire video so every frame is annotated.
- When your model looks good, hit Publish & Use Model.
- At that point, we have a hosted model API and a base model that detects trailer and stall number.
Next, we plug it into Roboflow Workflows.
Step 3: Set Up the Workflow in Roboflow Workflows
From the Rapid model screen click “Open in Roboflow Workflows”. Workflows automatically builds a starter pipeline:
- Input block: accepts an image (or a frame from a video)
- Model block: runs the Rapid model to detect trailer and stall number
- Bounding box visualization block: shows detections on the image
- Output block: returns visualization + JSON predictions
Now we start adding logic.
Step 4: Add Horizontal Padding to Understand “Nearness”
We want to know if each stall number is next to a trailer. The trick we will use in our workflow is simple and effective: Add a horizontal padding to stall number detections so they overlap with trailers in the same stall. This way, if you have a stall number that overlaps with a trailer, it means it’s an occupied one. If it does not overlap, it means it’s an empty stall.
In Workflows:
- Add a Detections Transformation block
- Configure it to add padding in the X-axis to each bounding box (e.g., 400 pixels)
- Wire the visualization block to show these horizontally padded detections
The effect:
- Stall number boxes become wider
- If a trailer is parked in that stall, its bounding box now overlaps the padded number box
Step 5: Filter for Occupied Stalls with an Overlap Filter
Now that overlap encodes “this stall has a trailer,” we use an Overlap Filter block to isolate occupied stalls. Our goal is to visually filter the occupied stalls.
In Workflows:
- Take the horizontally padded detections
- Add an Overlap Filter block
- Configure it so:
- It uses the trailer class as the overlap reference
- It keeps only detections that overlap with trailers
The overlap filter will use the trailer class as a filtering overlap class to keep only the detections that have some kind of overlap with trailers.
After this filter:
- We no longer need to see the trailer detections themselves
- We’re left with only stall numbers that have overlapping trailers → occupied stalls
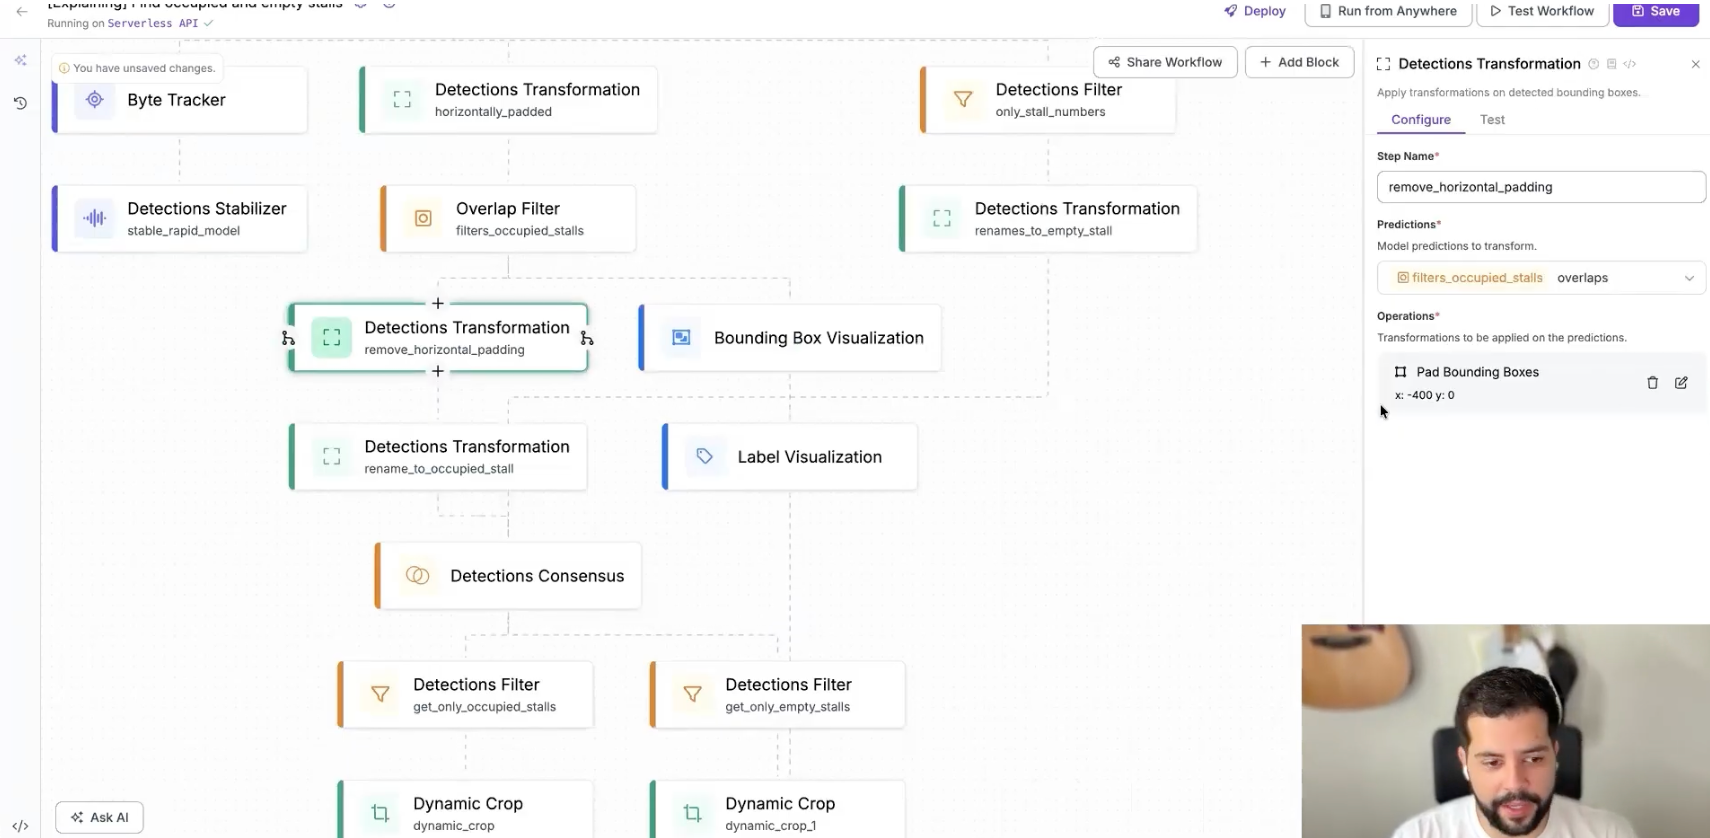
We then:
- Revert the horizontal padding (back to the original stall box size)
- Use a Text Transformation block to rename their class to occupied_stall
Now you have your occupied stalls with the boxes not padded like the original boxes.
Step 6: Use Detection Consensus to Find Empty Stalls
After using overlap logic to identify which stalls or dock doors are occupied, the next challenge is determining which ones are empty. The cleanest way to do this is to compare two sets: all stall numbers detected and only the stall numbers marked as occupied. The difference between those sets gives us every empty stall.
In Roboflow Workflows, this starts by returning to the original Rapid model predictions and filtering them so we keep only stall-number detections—trailers are irrelevant in this branch. At this point, we effectively have two groups: Set A: all stall numbers and Set B: occupied stall numbers.
To merge these into a single, conflict-free view, we feed both sets into a Detection Consensus block. This block merges predictions according to rules you define and determines which detections to keep. For dock and yard analysis, we set the required votes to 1, since we’re merging complementary information rather than validating duplicates.
The crucial configuration is disabling class awareness. In practice, this means if two boxes land in the same location but have different labels- one from the “all stalls” branch and one from the “occupied stalls” branch -the block will keep the appropriate one rather than requiring matching classes. This is what allows us to remove duplicates cleanly and end up with exactly one label per stall.
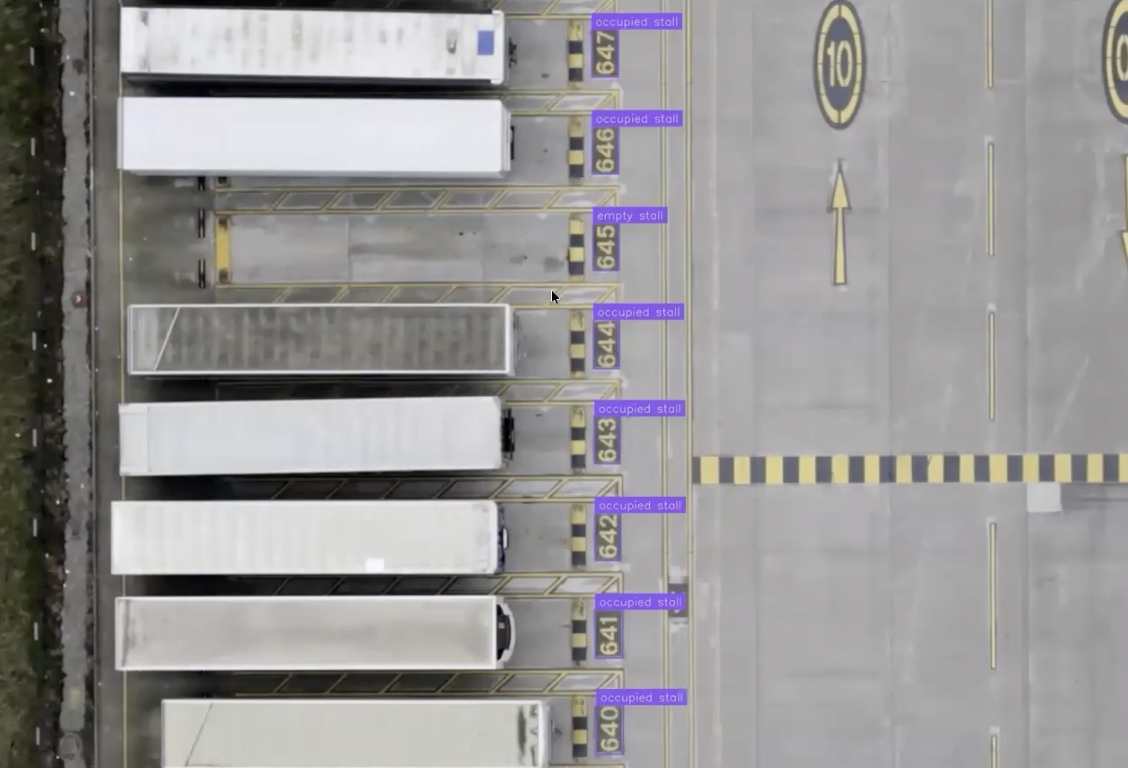
Finally, we rename each output: one branch becomes occupied_stall, the other becomes empty_stall. At this point, every stall or dock door in the frame is cleanly labeled as occupied or empty. For dock utilization tracking, this is the moment where raw camera or drone video transforms into structured operational insight:
Dock 1: occupied
Dock 2: empty
Dock 3: occupied
…and so on, frame by frame, with no manual auditing required.
Step 7: Crop, Preprocess, and Rotate for OCR
Once we know which stalls or dock doors are empty versus occupied, the next step is turning those boxes into something operations teams can actually use: readable numbers.
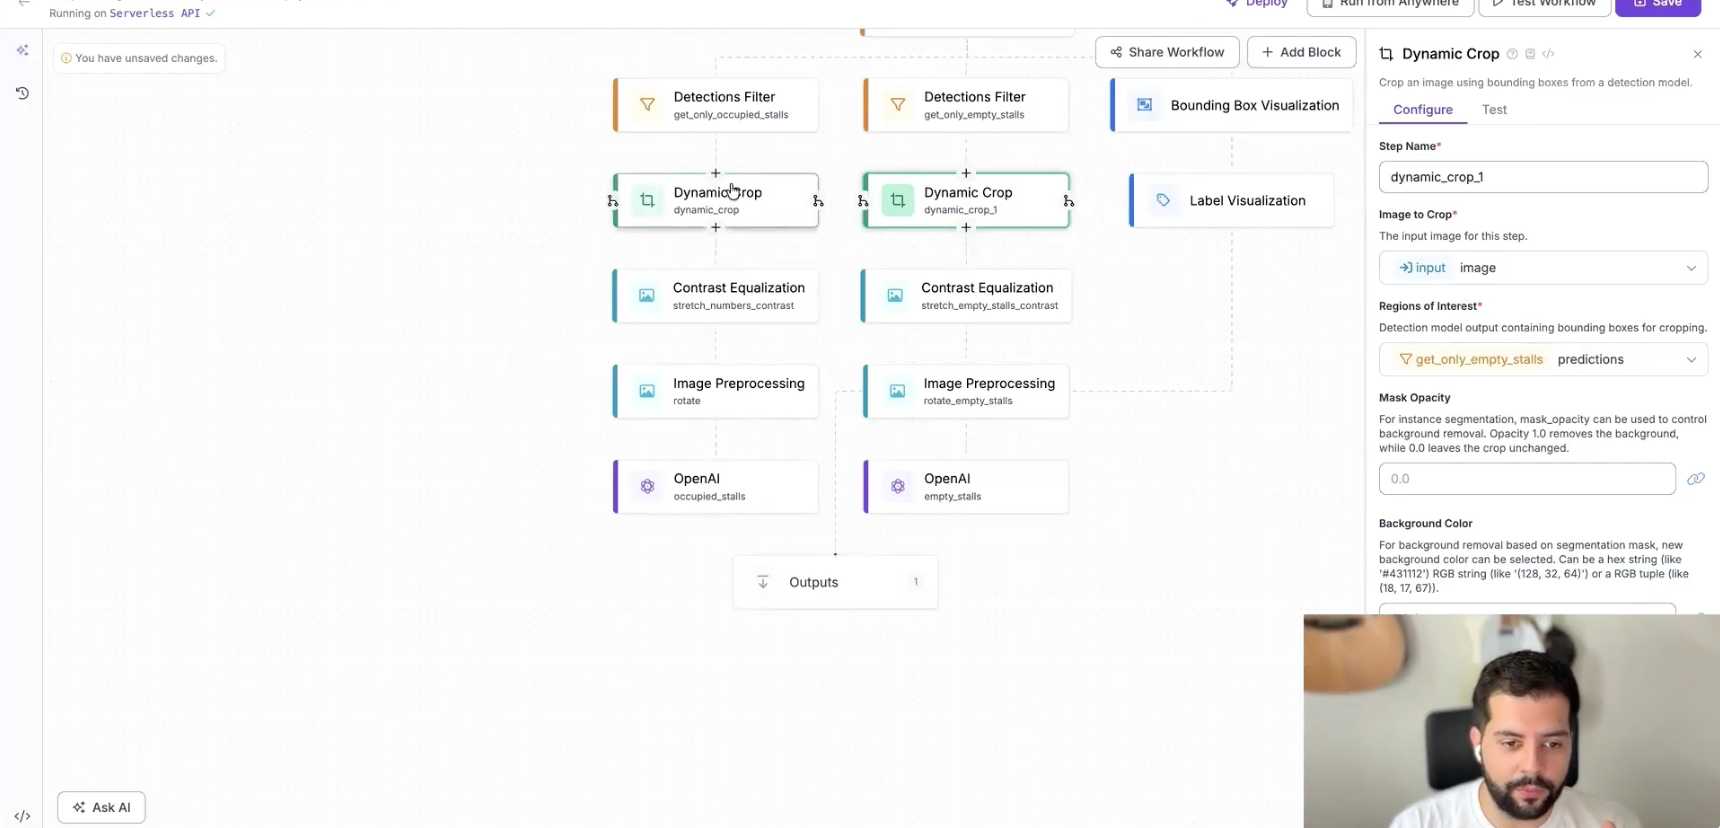
For each branch, we use a Dynamic Crop block to automatically crop the original image around every detection, giving us tight, focused images of just the stall label areas.
Next, we apply contrast stretching to those crops to sharpen the difference between the text and the background, which improves the performance of our text recognition model.
Finally, because the stall numbers in this example are rotated in the source footage, we apply a −90° rotation to bring them upright. After these three steps, each image is clean, high-contrast, and properly oriented for accurate OCR.
Step 8: Read Stall / Dock Numbers with OCR (GPT-5 Nano or Others)
Now we’re ready to turn pixels into real operational data using OCR. In our workflow, we use an OpenAI-based vision model for text recognition. Keep image_detail set to high to ensure the model receives a high-quality input for maximum accuracy.
Inside Roboflow Workflows, this is as simple as choosing the OpenAI OCR block, setting the image detail to high, and optionally using a Roboflow-managed OpenAI API key so you don’t have to create or manage your own key if you don’t want to - Roboflow can handle billing transparently for your usage.
Once wired in, the OCR model reads each cropped stall image and returns the stall or dock number as text. We then route those results into two clean outputs: one list for occupied stall numbers and one list for empty stall numbers.
At this point, every frame now contains exactly what logistics and operations teams actually need: occupied stall numbers as text and empty stall numbers as text, ready to flow straight into dock door utilization dashboards, alerting systems, or historical performance reports.
Step 9: JSON, CSV, and Batch Processing
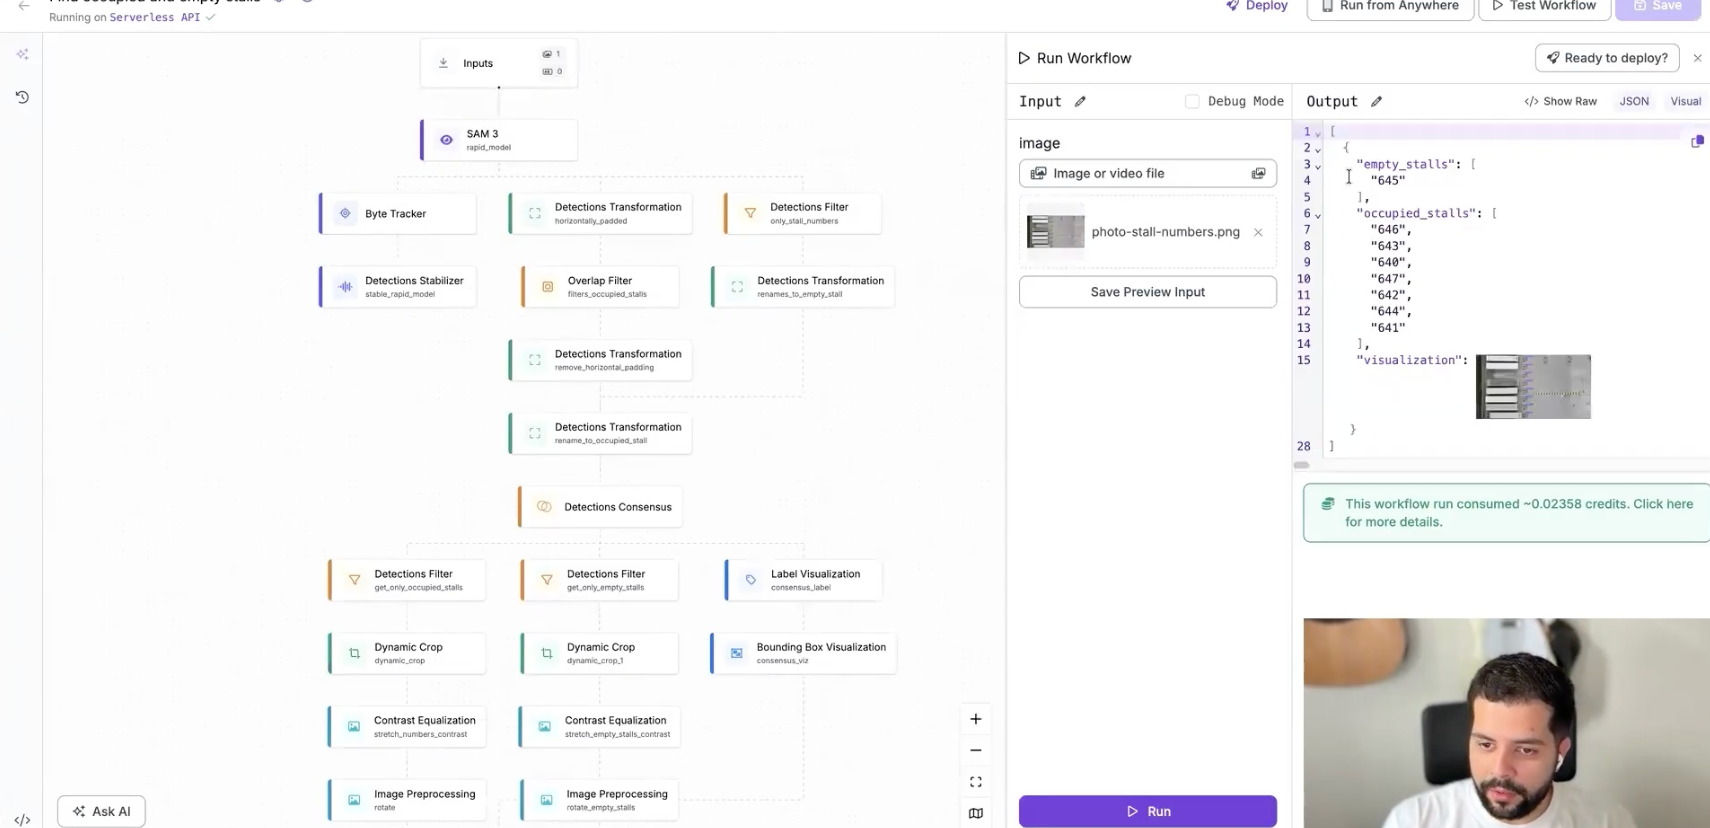
Now, if we look at the JSON, we have the visualization, we have the occupied stall numbers for this frame, the empty stall numbers as a readable number - an actionable number to think about logistics.
With Roboflow Workflows, you can return a clean JSON output that includes structured lists of occupied_stalls and empty_stalls, along with the coordinates, classes, and metadata for every detection in the frame. That same workflow can also be run in batch processing mode across a full video or large image set, which makes it easy to process historical footage at scale. And when you need something tabular for time studies or reporting, you can export a CSV directly from those JSON detections.
From there, the data becomes fuel for real operational analysis. You can analyze dock door utilization over time, compute time-in-state per stall or dock, and push results directly into BI tools, dashboards, or logistics platforms. Our final workflow is fully production-ready, and you can also plug in a ByteTracker and Detection Stabilizer block if you’re processing video.
This same workflow structure can be applied to one of the most critical throughput constraints in modern warehousing: the dock door.
Build a Dock Door Utilization Tracking App
At the end of the day, dock door utilization is a visibility problem, and computer vision is the fastest way to solve it.
With nothing more than cameras, Roboflow Rapid, and Roboflow Workflows, you can go from raw video to a fully automated system that knows which docks are occupied, which are empty, how long each truck stays, and exactly where your bottlenecks live.
Cite this Post
Use the following entry to cite this post in your research:
Contributing Writer. (Dec 11, 2025). Dock Door Utilization Tracking with Vision AI. Roboflow Blog: https://blog.roboflow.com/dock-utilization-tracking-with-vision-ai/