
Identifying the dominant color of a product in an image requires two steps: a segmentation model to isolate the object from its background, and k-means clustering to extract the most common RGB values from the masked region. This guide walks through both steps using Roboflow's Fashion Assistant segmentation model and scikit-learn clustering, producing RGB values that can be used for quality assurance checks or automated product tagging at scale.
With computer vision, you can identify the most prominent color or set of colors associated with an object. This is useful in quality assurance processes where you need to be sure a product or region of a product contains a specific color. For example, a textiles manufacturer can use color detection to assure the quality of products before they are sent for packaging, shipping, and distribution.
There are other applications, too. Consider a scenario where you are building a search engine for a clothes retailer. You want to offer the option of searching by color. Instead of manually tagging every image with a color, you could use computer vision to automatically identify a relevant color.
In this guide, we are going to discuss how to analyze product color using computer vision. We will walk through an example of taking an image of a t-shirt and identifying the color of the shirt.
To analyze the product color in an image, we will:
- Use a segmentation model to identify the precise location of the object whose color we want to check, and;
- Use clustering to identify the most common color(s) in the image.
The code we walk through can be applied to any object. If you don’t already have a segmentation model, check out our guide on how to train a YOLOv8 instance segmentation model.
Without further ado, let’s get started!
Step #1: Retrieve a Segmentation Mask of an Object
Before we can identify the color of a product, we need to know where the product is in the image or video feed that we want to analyze. To find the location of a product, we can use a segmentation model. Segmentation models identify precisely where an object is located in an image or video. Without segmentation, background colors – including grays and whites – will interfere with our ability to precisely identify the colors in an image.
For this guide, we will use the Fashion Assistant model developed by the Roboflow team. This model can precisely identify items of clothing such as a t-shirt. This model is available to use on Roboflow Universe, a community where people have shared over 50,000 pre-trained models that you can test.
Here is an image with which we will work in this guide:
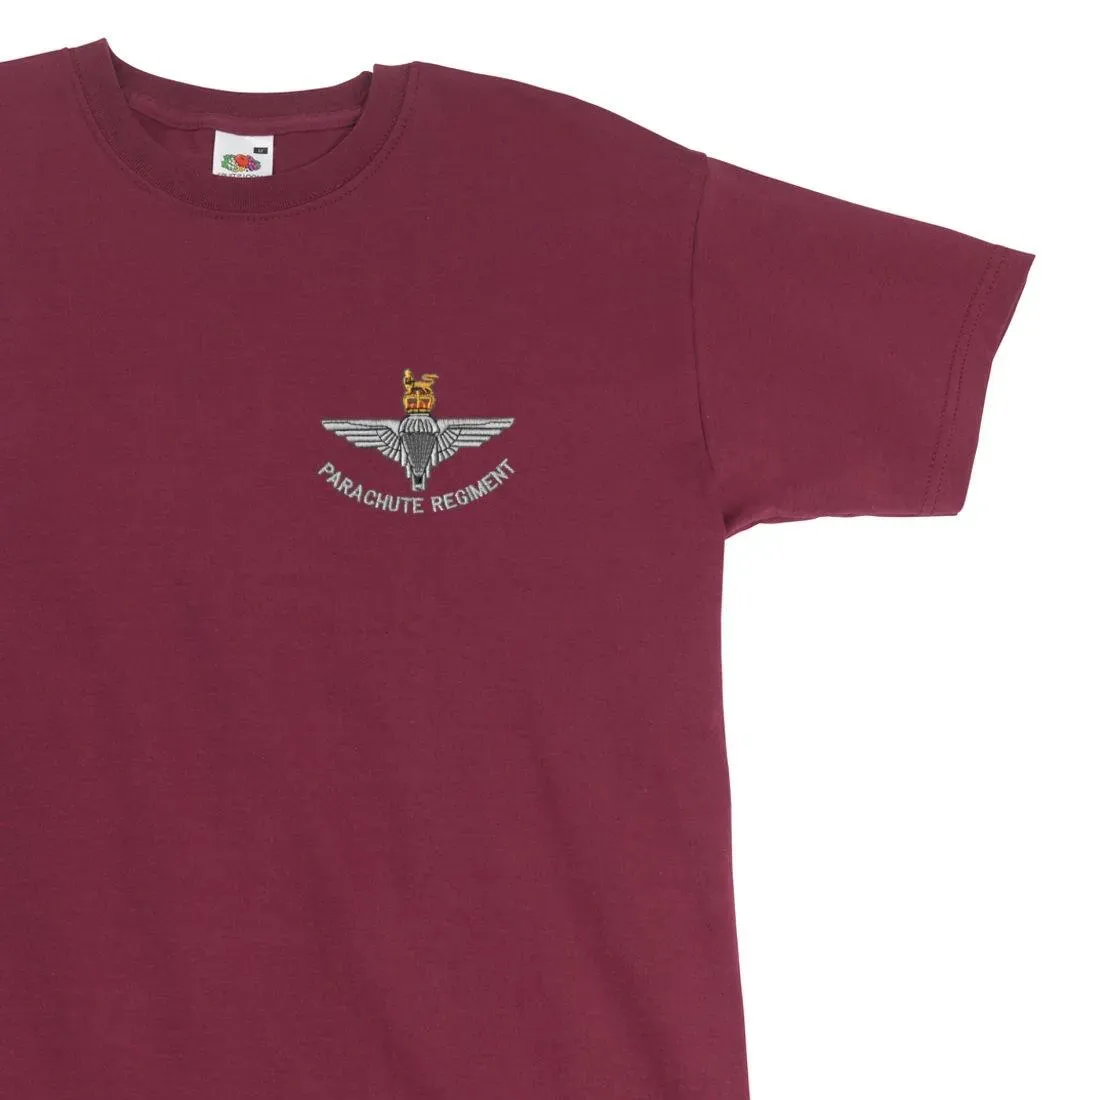
The t-shirt with which we are working is burgundy.
First, we need to install the dependencies required for our script:
pip install numpy supervision Pillow roboflow scikit-learnNext, create a new Python file and paste in the following code:
import numpy as np
import supervision as sv
from PIL import Image
from roboflow import Roboflow
from sklearn.cluster import KMeans

rf = Roboflow(api_key="API_KEY")

project = rf.workspace().project("fashion-assistant-segmentation")
model = project.version(5).model

classes = "baseball cap, hoodie, jacket, pants, shirt, shorts, sneaker, sunglasses, sweatshirt, t-shirt"

inference_results = model.predict("example.jpg").json()

results = sv.Detections.from_inference(inference_results)
Above, substitute “API_KEY” with your Roboflow API key. Learn how to retrieve your Roboflow API key.
If you are using your own model trained on Roboflow, update the project name, version number, and class list as appropriate for your project.
In this code, we import the required dependencies, create a “model” object through which we can run inference using the Roboflow API, and run inference on an image called “example.jpg”. We load the predictions into a variable called “results”.
To visualize predictions, we can use the following code:
image = Image.open("example.jpg")
image = np.array(image)
mask_annotator = sv.MaskAnnotator(color=sv.Color(0, 0, 255))
result = mask_annotator.annotate(image, results)
sv.plot_image(result)
In this code, we create a MaskAnnotator object that we can use to visualize segmentation masks. We have set predictions to appear in blue (“0, 0, 255” in RGB).
Let’s run our code and see what happens:
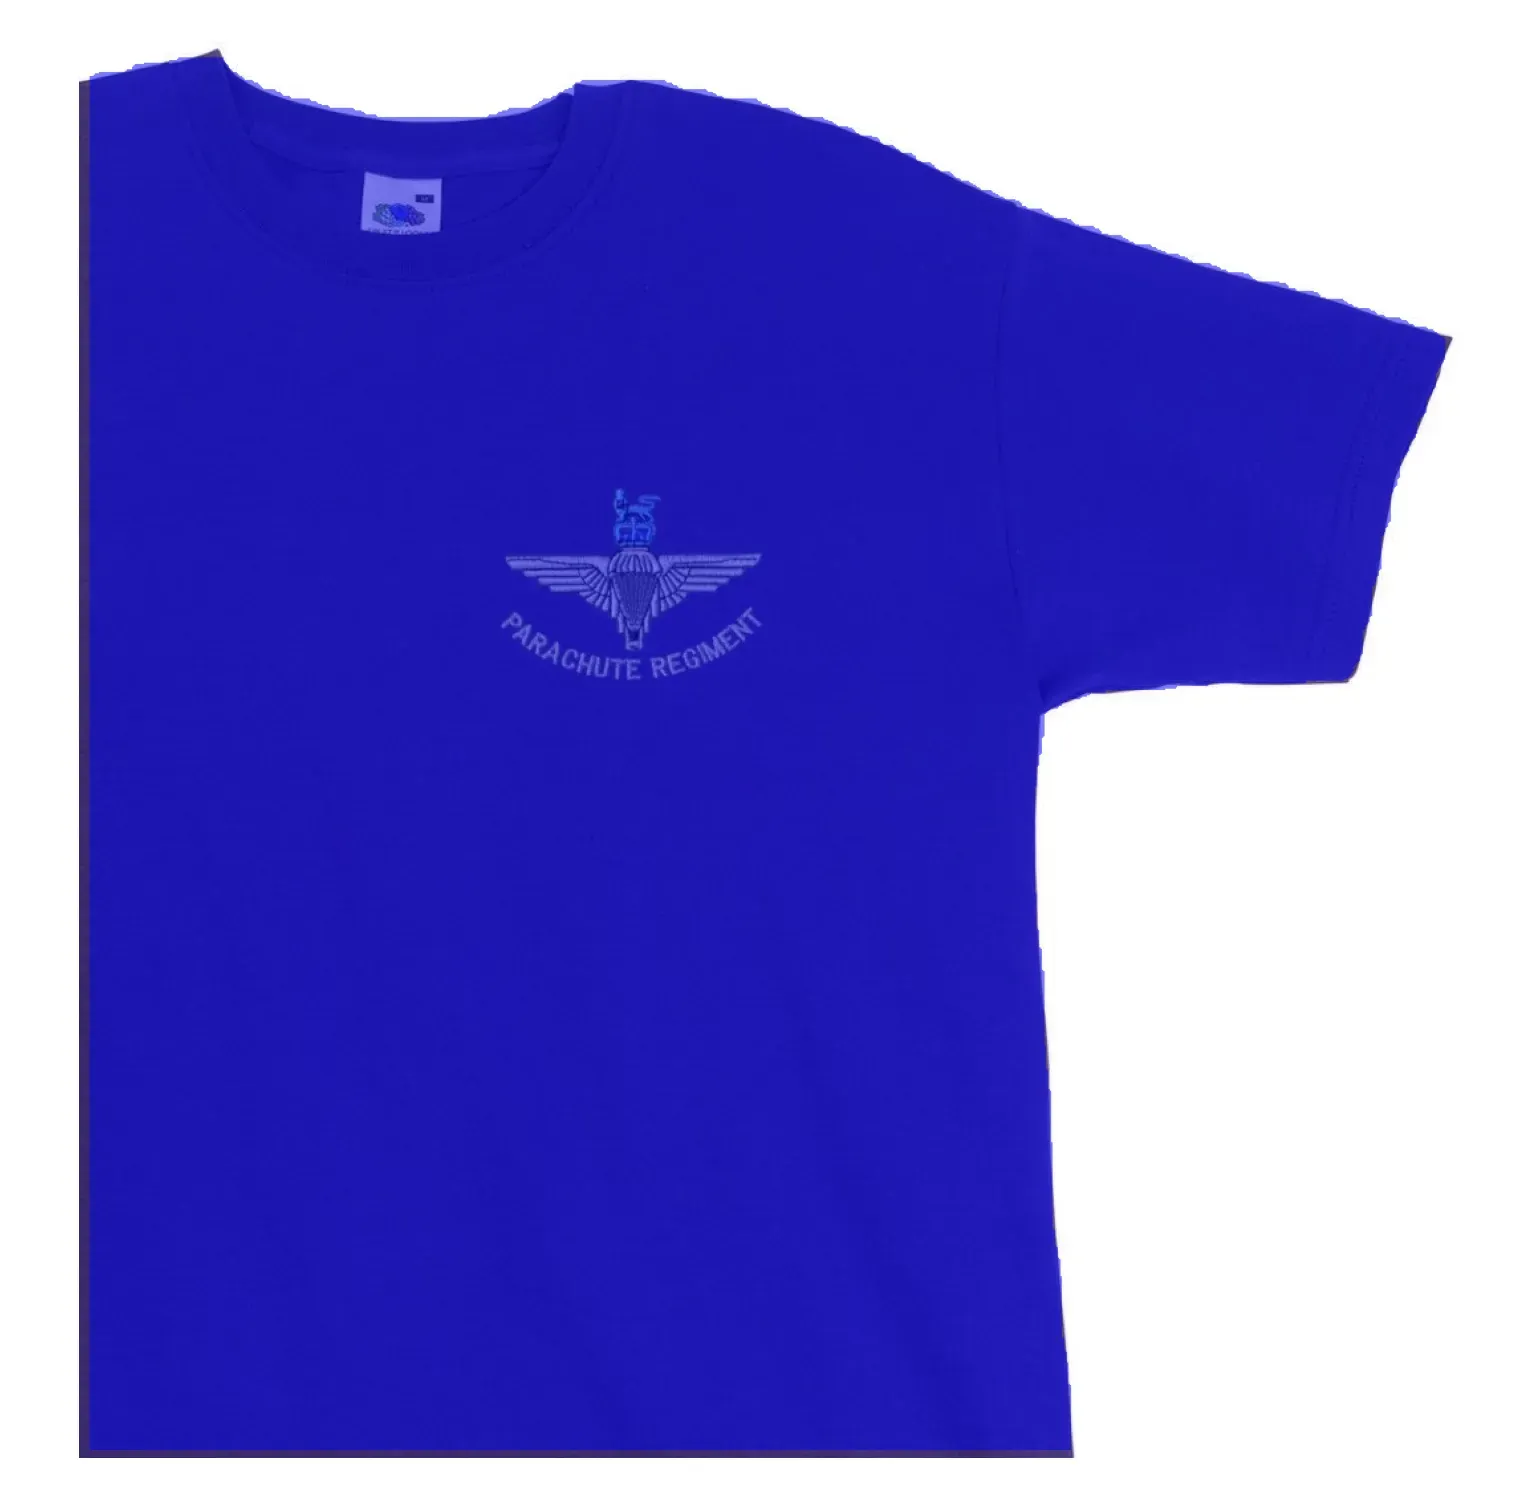
Our code ran inference on a photo of a t-shirt then highlighted the t-shirt in an opaque blue. Blue is the color we specified when we created our MaskAnnotator in the last step.
Now that we can identify the location of objects, we can find their color.
Step #2: Use Clustering to Identify the Most Common Colors
To identify the most common color(s) on an object, we can use clustering. We will use k-means clustering in this guide with help from the scikit-learn Python package. Add the following code to the end of the Python file in which you are working:
image[results.mask[0][0]] = 0

pixels = image.reshape((-1, 3))
clt = KMeans(n_clusters=1)
clt.fit(pixels)

centers = clt.cluster_centers_
rgb = [[int(i) for i in center] for center in centers]

print(rgb)
This code will take the first mask returned by the segmentation model we configured in the last step and remove all pixels that are not in the mask. We then run k-means clustering with a single cluster. This will allow us to identify the main color in the segmented region (in this example, the t-shirt). If you want to identify multiple colors, increase the value of the n_clusters variable. Finally, we retrieve the cluster centers and print the values to the console.
Let’s run our code!
loading Roboflow workspace...
loading Roboflow project...
The default value of `n_init` will change from 10 to 'auto' in 1.4. Set the value of `n_init` explicitly to suppress the warning
[[161, 112, 125]]
The first first three lines are messages from functions. We can ignore these.
Our code prints out three floating point values. The integers before the decimals can be used as RGB values. When visualized in Google, these RGB points show a burgundy color like the one in our image. Note that this analysis will not be exact.
Conclusion
In this guide, we demonstrated how to analyze product color for use in quality assurance processes. We used Roboflow to run a segmentation model. This model identifies the location of a product. In this guide, the product with which we were working was a t-shirt. Then, we used k-means clustering to identify the most prominent color in the image.
Now you have the resources you need to start analyzing product color with computer vision.
Cite this Post
Use the following entry to cite this post in your research:
James Gallagher. (Oct 6, 2023). Color and Product Type Inspection with Computer Vision. Roboflow Blog: https://blog.roboflow.com/how-to-analyze-product-color/