Segment Anything Model (SAM) can be used with YOLOv8 to make it easier for users to tasks such as instance segmentation and text-to-mask predictions.
In the field of computer vision, object detection and instance segmentation are crucial tasks that enable machines to understand and interact with visual data. The ability to accurately identify and isolate objects in an image has numerous practical applications, from autonomous vehicles to medical imaging.
In this blog post, we will explore how to convert bounding boxes to segmentation masks and remove the background of images using a Jupyter notebook with the help of Roboflow and YOLOv8.
Benefits of Segmentation Masks Instead of Bounding Boxes
Imagine you have a dataset of images containing objects of interest, with each image annotated with bounding boxes. While bounding boxes provide positional information about objects, they lack the fine details required for more advanced computer vision tasks like instance segmentation or background removal.
Converting bounding boxes to segmentation masks allows us to extract accurate object boundaries and separate them from the background, opening up new opportunities for analysis and manipulation.
Using Roboflow, YOLOv8, and SAM to Create Instance Segmentation Datasets
To address the challenge of converting bounding boxes to segmentation masks, we will utilize the Roboflow and Ultralytics libraries within a Jupyter notebook environment. Roboflow simplifies data preparation and annotation, while Ultralytics provides state-of-the-art object detection models and utilities.
Setting Up the Notebook
pip install roboflow "ultralytics<=8.3.40" 'git+https://github.com/facebookresearch/segment-anything.git'We start by importing the necessary packages and setting up the notebook environment. The code snippet below demonstrates the initial setup:
import ultralytics
from IPython.display import display, Image
from roboflow import Roboflow
import cv2
import sys
import numpy as np
import matplotlib.pyplot as plt

# Set the device for GPU acceleration
device = "cuda"

# Check Ultralytics version and setup completion
ultralytics.checks()

# Set the first_run flag to False after the initial run
first_run = False

if first_run:
    !{sys.executable} -m pip install 'git+https://github.com/facebookresearch/segment-anything.git'
    !wget https://dl.fbaipublicfiles.com/segment_anything/sam_vit_h_4b8939.pth
Loading the Dataset
Next, load a dataset using the Roboflow API for accessing and managing datasets. The following code snippet demonstrates how to load a dataset version from a specific project:
from roboflow import Roboflow
rf = Roboflow(api_key="YOUR_API_KEY")
project = rf.workspace("vkr-v2").project("vkrrr")
dataset = project.version(5).download("yolov8")
Running YOLOv8 Inference
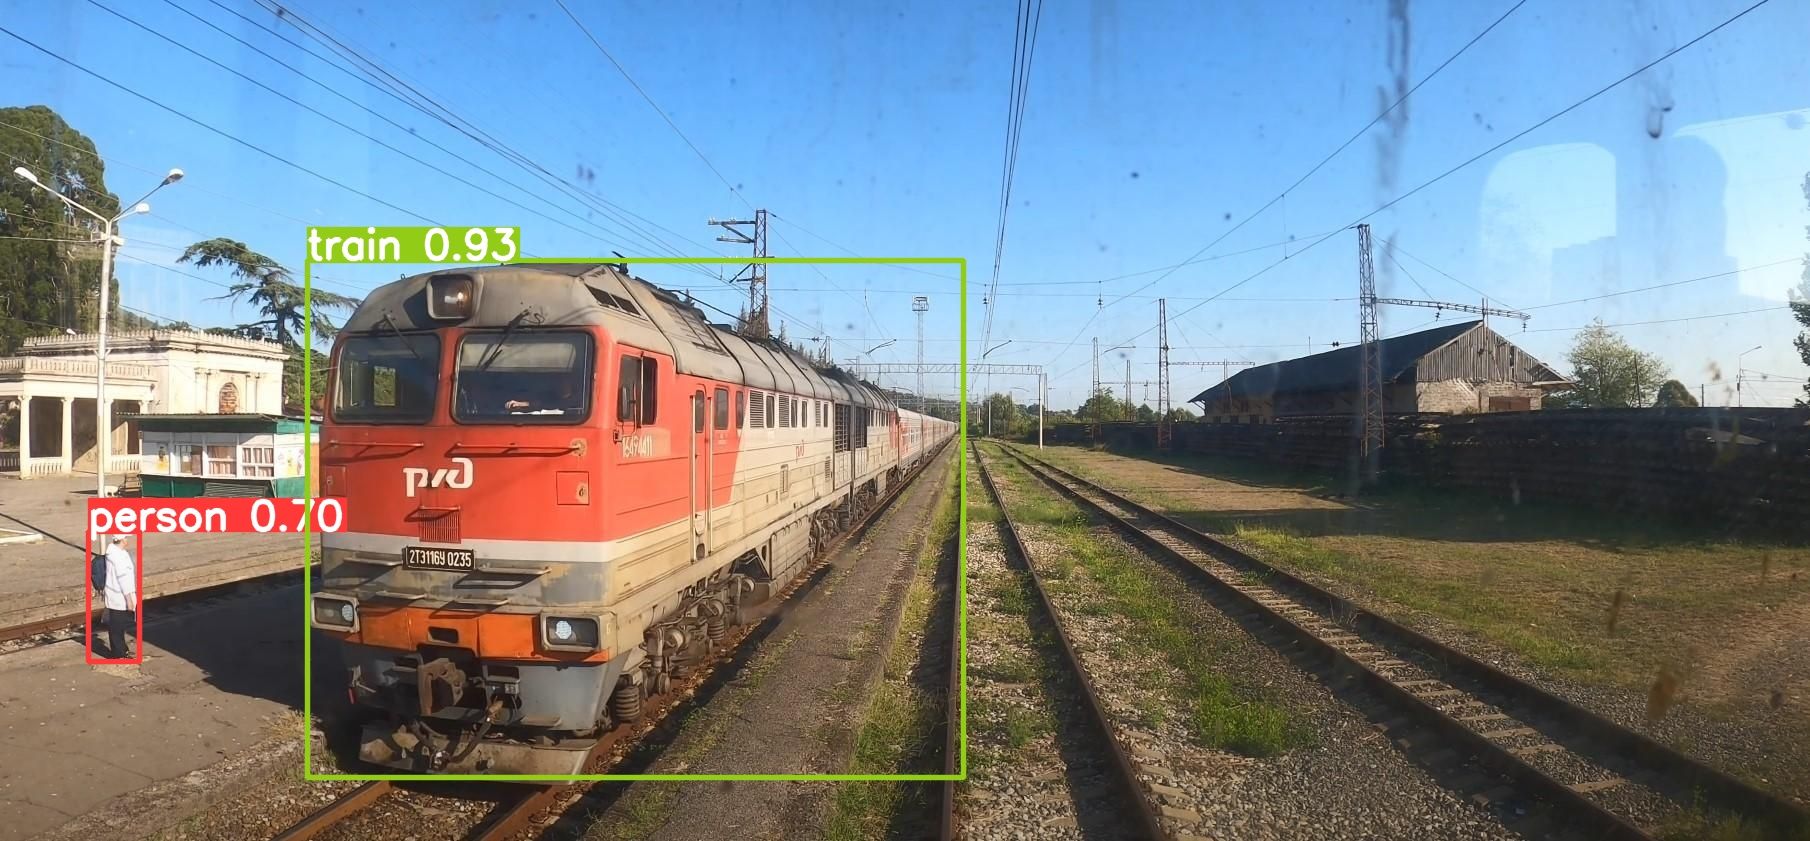
To perform object detection with YOLOv8, we run the following code:
from ultralytics import YOLO

# Load the YOLOv8 model
model = YOLO('yolov8n.pt')

# Perform object detection on the image
results = model.predict(source='PATH_TO_IMAGE', conf=0.25)

Extracting the Bounding Box
Once we have the results from YOLOv8, we can extract the bounding box coordinates for the detected objects:
for result in results:
    boxes = result.boxes
bbox = boxes.xyxy.tolist()[0]
print(bbox)
[746.568603515625, 40.80133056640625, 1142.08056640625, 712.3660888671875]Convert Bounding Box to Segmentation Mask using SAM
Let's load the SAM model and set it up for inference:
from segment_anything import sam_model_registry,
image = cv2.cvtColor(cv2.imread('PATH_TO_IMAGE'), cv2.COLOR_BGR2RGB)
SamAutomaticMaskGenerator, SamPredictor
sam_checkpoint = "sam_vit_h_4b8939.pth"
model_type = "vit_h"
sam = sam_model_registry[model_type](checkpoint=sam_checkpoint)
sam.to(device=device)
predictor = SamPredictor(sam)
predictor.set_image(image)
def show_mask(mask, ax, random_color=False):
if random_color:
color = np.concatenate([np.random.random(3), np.array([0.6])], axis=0)
else:
color = np.array([30/255, 144/255, 255/255, 0.6])
h, w = mask.shape[-2:]
mask_image = mask.reshape(h, w, 1) * color.reshape(1, 1, -1)
ax.imshow(mask_image)
def show_points(coords, labels, ax, marker_size=375):
pos_points = coords[labels==1]
neg_points = coords[labels==0]
ax.scatter(pos_points[:, 0], pos_points[:, 1], color='green', marker='*', s=marker_size, edgecolor='white', linewidth=1.25)
ax.scatter(neg_points[:, 0], neg_points[:, 1], color='red', marker='*', s=marker_size, edgecolor='white', linewidth=1.25)
def show_box(box, ax):
x0, y0 = box[0], box[1]
w, h = box[2] - box[0], box[3] - box[1]
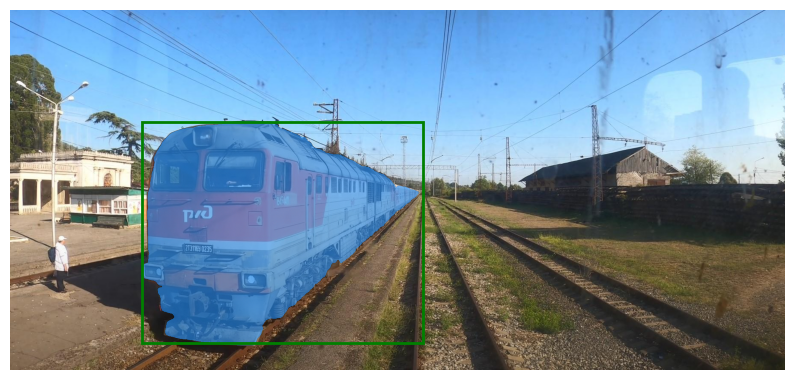
ax.add_patch(plt.Rectangle((x0, y0), w, h, edgecolor='green', facecolor=(0,0,0,0), lw=2)) Next, let's convert the bounding box coordinates to a segmentation mask using the SAM model:
input_box = np.array(bbox)
masks, _, _ = predictor.predict(
    point_coords=None,
    point_labels=None,
    box=bbox[None, :],
    multimask_output=False,
)
plt.figure(figsize=(10, 10))
plt.imshow(image)
show_mask(masks[0], plt.gca())
show_box(input_box, plt.gca())
plt.axis('off')
plt.show()
BONUS: Background Removal
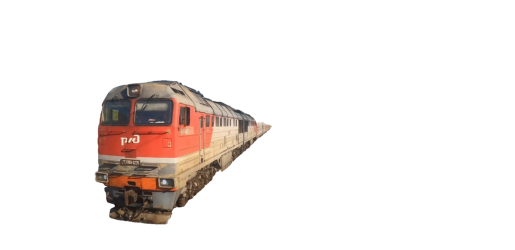
Finally, we can remove the background from the image using the segmentation mask. The following code snippet demonstrates the process:
segmentation_mask = masks[0]

# Convert the segmentation mask to a binary mask
binary_mask = np.where(segmentation_mask > 0.5, 1, 0)
white_background = np.ones_like(image) * 255

# Apply the binary mask
new_image = white_background * (1 - binary_mask[..., np.newaxis]) + image * binary_mask[..., np.newaxis]

plt.imshow(new_image.astype(np.uint8))
plt.axis('off')
plt.show()

The resulting image is then displayed without the background.
Conclusion
In this blog post, we have explored how to convert bounding boxes to segmentation masks and remove a background using a Jupyter notebook.
By leveraging the capabilities of the Roboflow and Ultralytics libraries, we can perform object detection, generate segmentation masks, and manipulate images with ease. This opens up possibilities for advanced computer vision tasks, such as instance segmentation and background removal, and empowers us to extract valuable insights from visual data.
Cite this Post
Use the following entry to cite this post in your research:
Arty Ariuntuya. (Jun 7, 2023). How to Use YOLOv8 with SAM. Roboflow Blog: https://blog.roboflow.com/how-to-use-yolov8-with-sam/
