
This blog post was contributed to Roboflow by Mason, a high school student interested in the technologies that drive the modern world.
Instance segmentation involves finding, at a pixel level, the boundaries of an object. You can train computer vision models to calculate object boundaries.
In this guide, we are going to use instance segmentation to outline and score the accuracy of drawn circles. We measure “accuracy” as how round a circle is – the closer the circle is to being perfectly round, the more accurate it is.
We will build a game around the precision with which circles are drawn. Users will be able to upload drawings of circles, either digital or photographs, and receive their scores. A simple game, this can be built upon for numerous more complicated scenarios.
For this project, I used Node.js with packages and Roboflow’s Inference helpers.
The full code for the project is available on GitHub.
Step #1: Build circle segmentation model
First, sign up for Roboflow and create an account.
Next, go to workspaces and create a new object segmentation project. This will be used to segment all sorts of circles. Customize the project name and annotation group to your choice. It is best to use ‘circle’ as the class and annotation group, as it is a good organizational habit for when you create larger projects.
Next, upload images to use for annotation. Be sure to add a wide range of different styles, colors, materials, and background to ensure best accuracy. Now add the images to the dataset for annotation.
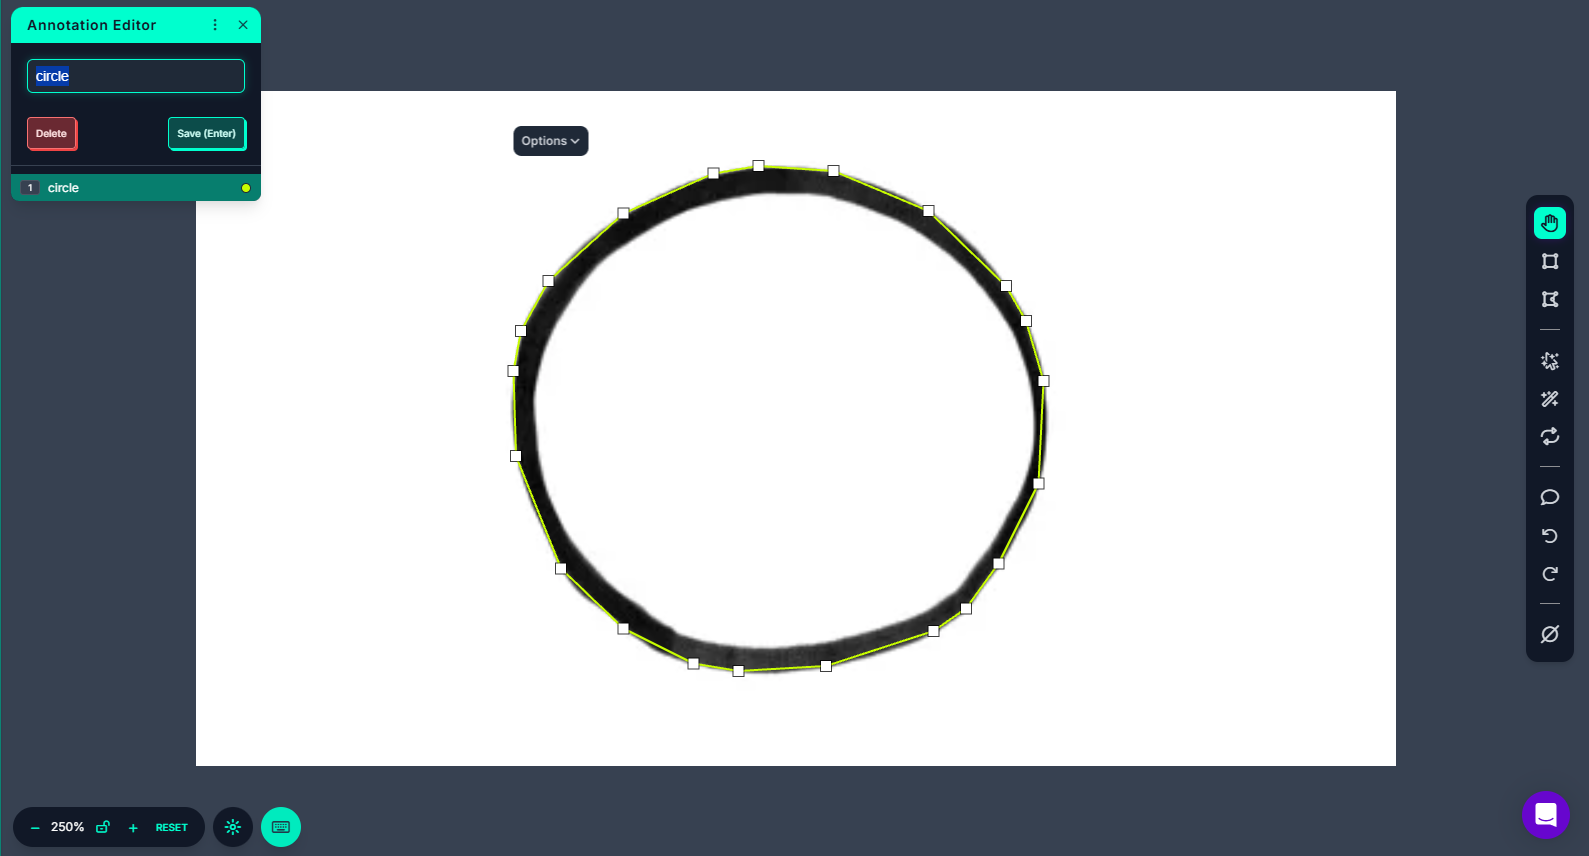
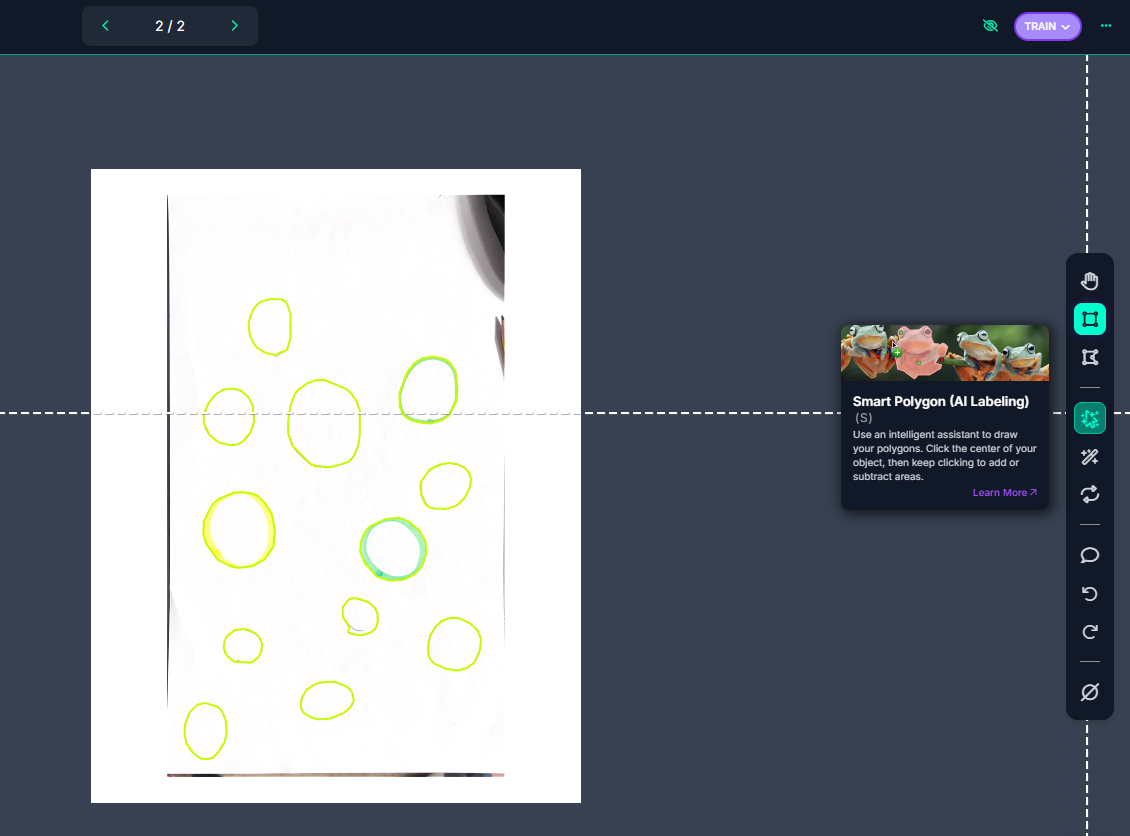
Each image now has to be annotated. This can be done using Roboflow’s smart polygon feature or by manually drawing the bounding polygon. Make sure to label all circles in each image. I found it easiest to draw multiple circles at once rather than have only one per circle.
Once we have our annotations and images, we can generate a dataset version of segmented images. Each version is unique and associated with a trained model so you can test out different augmentation setups.
Step #2: Train circle segmentation model
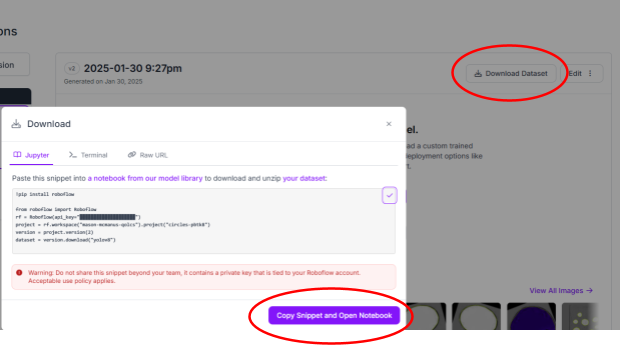
Now, we can train the dataset. Roboflow provides numerous methods for training. You can train using Roboflow, allowing for special features such as compatibility with Roboflow’s JavaScript API. However, this method does require training credits. In case you run out, Roboflow provides Google Collab notebooks to train all sorts of models.
In this case, I used this Colab notebook which uses Yolo v8. Although Yolo v11 is newer, I opted to use v8 due to past success with this format. These notebooks provide great step by step directions and explanations. Once training is completed, they make it incredibly simple to upload the model back to Roboflow for use with their existing libraries.
After training, Roboflow has a plethora of built-in tools to monitor and analyze model effectiveness. By clicking on the “Models” sidebar button in the project page, you can view a diagnosis of training metrics:
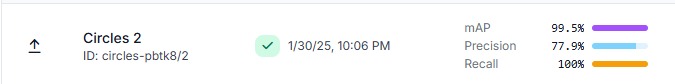
In my case, the mAP is very close to 100%. mAP represents “Mean Average Precision” which is desirable to be close to 100%. However, beware that a bunch of similar annotated images, training images, and validation images may give a high score without being resilient models. A variety of different environments and deformities will give a better picture of how the model behaves. Roboflow actually has a built-in tool to test images not in the dataset: the “Visualize” page.
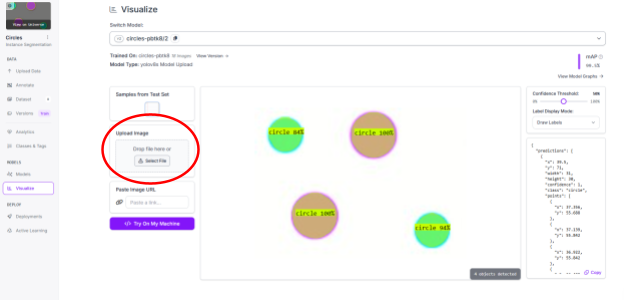
By uploading images, we can visualize the model in real time without having to add images to the dataset or deploy the model in an application.
Step #3: Setting up segmentation
First, I used Node.js’ express package to generate a static user interface. Using express-fileupload, the user can send an image back to the Node server. Now, we can use the Axios package to send our image to the Roboflow model we trained. First, obtain your Roboflow private API key from the settings panel -> API Keys page. Remember to keep this private. The image variable should be the video frame we just saved. You can read it using Node.js’ filesystem API:
import fs from 'fs';

const IMAGE = fs.readFileSync('/path/to/image.jpg', {
        encoding: 'base64'
    });

All that’s left is to change the URL variable to the URL of the segmentation model you trained. For example, I used https://detect.roboflow.com/circles-pbtk8/1 as my model.

axios({
    method: 'POST',
    url: URL,
    params: {
        api_key: API_KEY
    },
    data: IMAGE,
    headers: {
        'Content-Type': 'application/x-www-form-urlencoded'
    }
}).then(function (response) {
// Segmentation points are received here
    console.log(response.data);
}).catch(function (error) {
    // In the case of an error:
    console.log(error.message);
});
Step #3: Setting up application client
I use socket.io to communicate from the backend to the frontend. I also added an upload input and a canvas element to display the circles after processing. The client side variables are as follows:
var socket = io();
socket.on('send-circle-points', handleValues);

const imageUpload = document.getElementById('image-upload');
const imageUploadContainer = document.getElementById('image-upload-container');
const canvas = document.getElementById('circle-canvas');
var ctx = canvas.getContext('2d');
var uploadedImage;
Now, we receive an array of detected instances of circles. Each element in the array has an object property key of points that contain all points along the object, in this case the circle. To start, I iterated through each circle. Then, I merged the points of the current circle by distance in order to decrease the polygon size, as well as found the average x and y positions, approximating the circle’s center point:
for (let circle = 0; circle < data.predictions.length; circle++) {

       let xValues = 0;
      let yValues = 0;

      let points = data.predictions[circle].points;

      // Merge by distance
      let mergeDistance = canvas.width / 250;
      for (let i = 0; i < points.length; i++) {
          for (let p = i + 1; p < points.length; p++) {
              if (getDistance(points[i], points[p]) < mergeDistance) {
                  points[i].x = getMiddleValue(points[p].x, points[i].x);
                  points[i].y = getMiddleValue(points[p].y, points[i].y);
                  points.splice(p, 1);
                  p--;
              }
          }
          xValues += points[i].x;
          yValues += points[i].y;
      }

      xValues /= points.length;
      yValues /= points.length;
}
The get distance function is a helper method that uses the distance formula to return pixel distance between points:
function getDistance(p1, p2) {
    return Math.sqrt(Math.pow(p1.x - p2.x, 2) + Math.pow(p1.y - p2.y, 2));
}
We have the estimated center point of the circle, but we still need the average radius of the circle. For this, I iterated through all points again. I added the calculated radius at the current point to a counter, then divided by all points to average the radius:
let averageDistance = 0;
        for (let i = 0; i < points.length; i++) {
            averageDistance += getDistance(points[i], { x: xValues, y: yValues });
        }
        averageDistance /= points.length;
The radius and center points are the only required values that I used in my algorithm to determine how perfect the circle is. First, I found the hypothetical area of the circle to use as a scale (standardize circles of all sizes by not relying on pixel distances):
let hypotheticalArea = Math.PI * Math.pow(averageDistance, 2);
Instead of finding the total area of the drawn circle (would allow irregular shaped circles to be scored high if they have the correct area), I counted the absolute value of error in each sector of the circle. The following graphic illustrates this idea:
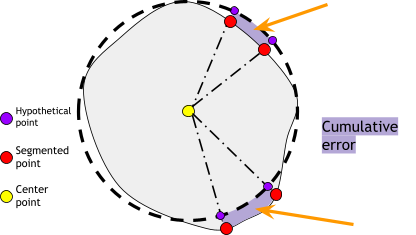
To find the error in area for a sector, I subtracted the area of the inner triangle from the hypothetical area of the triangular portion of the entire sector:
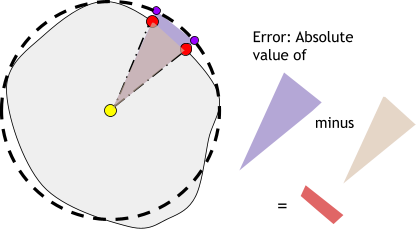
The area of the inner triangle can be calculated with this function, passing the two segmented points and the center point:
function getArea(x1, y1, x2, y2, x3, y3) {
    return Math.abs((x1 * (y2 - y3) + x2 * (y3 - y1) + x3 * (y1 - y2)) / 2);
}
The formula to find the triangular area of the entire sector is as follows: sin(θ) × r^2 × (1/2),
Where θ is in radians. So, we also have to find the angle of the sector formed by the two points. The function is as follows:
function angleBetweenLines(line1, line2) {
    const m1 = (line1.y2 - line1.y1) / (line1.x2 - line1.x1);
    const m2 = (line2.y2 - line2.y1) / (line2.x2 - line2.x1);

    const angleRad = Math.atan2(m2 - m1, 1 + m1 * m2);
    const angleDeg = angleRad * (180 / Math.PI);

    return Math.abs(angleDeg); // Return the absolute value for the acute angle
}
I had it return the angle in degrees for ease of debugging. However, that means I had to convert the angle to radians when finding areas.
Now, combining all this logic looks like this:
let cumulativeError = 0;
        let hypotheticalArea = Math.PI * Math.pow(averageDistance, 2);
        for (let i = 1; i < points.length; i++) {
            const segment1 = { x1: xValues, y1: yValues, x2: points[i - 1].x, y2: points[i - 1].y };
            const segment2 = { x1: xValues, y1: yValues, x2: points[i].x, y2: points[i].y };
            let angle = angleBetweenLines(segment1, segment2);

            cumulativeError += Math.abs(getArea(points[i - 1].x, points[i - 1].y, points[i].x, points[i].y, xValues, yValues) - ((1/2) * Math.pow(averageDistance, 2) * Math.sin(angle/180*Math.PI)));
        }
Now we can grade the final accuracy and display the text readout on the circle canvas:
let accuracy = 1 - Math.abs(cumulativeError) / (hypotheticalArea);
        console.log(cumulativeError - hypotheticalArea)

        ctx.font = `${canvas.width / 20}px serif`;
        ctx.fillText(`${Math.round(accuracy * 1000) / 10}%`, xValues - (canvas.width / 15), yValues);
Although it is an estimate and not an exact formula, this algorithm works great to quickly and easily grade circles. Theoretically, similar algorithms could be used to grade other shapes as well by comparing hypothetical areas to actual areas.
The algorithm doesn’t work perfectly. It is hard to grade jagged pixels on the basis of smooth surfaces. Perhaps more training or blur algorithms could improve this.
Protrusions connected to circles may also mess up this algorithm, as the segmentation model fails to differentiate the circular head from the cat’s whiskers.
The model also may be tricked by half circles or spirals.
Overall, the algorithm works well for objects intended to be circles on their own. After all, it was trained using only drawings of circles, so circles in more complex objects cause issues. This may be remedied by expanding the training set.
Cite this Post
Use the following entry to cite this post in your research:
Contributing Writer. (Feb 3, 2025). Measuring the Accuracy of Drawn Circles with Computer Vision. Roboflow Blog: https://blog.roboflow.com/measuring-the-accuracy-of-drawn-circles-with-computer-vision/