
Color spaces are fundamental to image processing and computer vision. They define how colors are represented in an image. OpenCV, a popular library for computer vision, supports multiple color spaces, each with its own unique properties and use cases.
In this blog post, we’ll explore some of the most commonly used color spaces in OpenCV: BGR, RGB, HSV, and more. We’ll also provide Python code examples and visual outputs to help you understand these concepts better.
OpenCV's Default Color Space: BGR
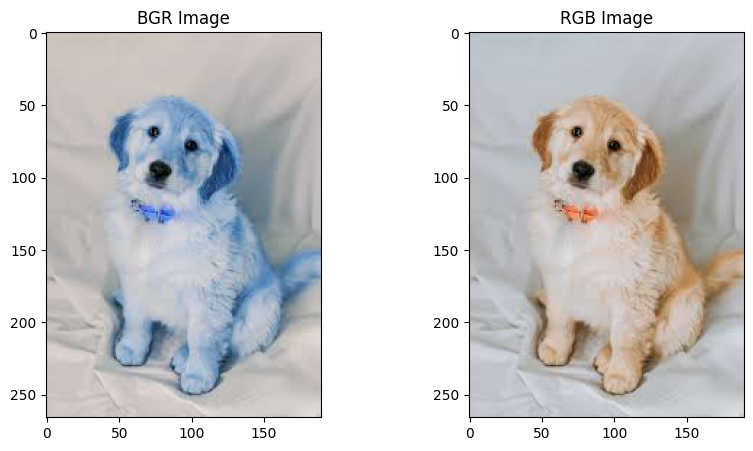
OpenCV, by default, reads images in the BGR (Blue, Green, Red) color space. This is different from the more commonly known RGB (Red, Green, Blue) color space. The difference lies in the order of the channels.
You may be wondering: why is BGR the default colour space?
Historically, OpenCV adopted BGR as its default because of how some camera manufacturers and software libraries stored color information. However, most other libraries (like Matplotlib) use RGB, so you’ll often need to convert between the two.
Note: Make sure you have OpenCV and Matplotlib installed to run the code examples:
pip install opencv-python matplotlibYou can convert BGR data to RGB using the COLOR_BGR2RGB method:
import cv2
import matplotlib.pyplot as plt

# Load an image in BGR format
image = cv2.imread('images.jpg')

# Convert BGR to RGB
image_rgb = cv2.cvtColor(image, cv2.COLOR_BGR2RGB)

# Display the images
plt.figure(figsize=(10, 5))

plt.subplot(1, 2, 1)
plt.title('BGR Image')
plt.imshow(image)  # This will look incorrect because Matplotlib expects RGB

plt.subplot(1, 2, 2)
plt.title('RGB Image')
plt.imshow(image_rgb)  # This will look correct

plt.show()
Here is an example showing the data before and after conversion:
The HSV Color Space
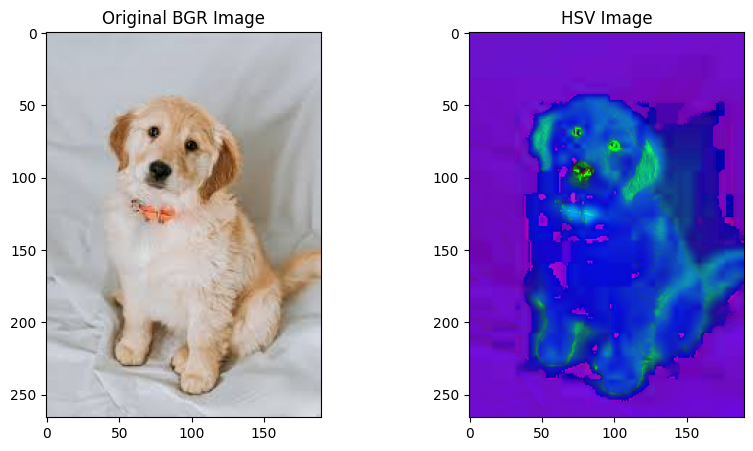
HSV stands for Hue, Saturation, and Value. It is often used in tasks like object tracking and color segmentation because it separates color information (hue) from brightness (value) and saturation.
- Hue: Represents the color (0° to 360°).
- Saturation: Represents the intensity or purity of the color (0% to 100%).
- Value: Represents the brightness of the color (0% to 100%).
You can convert data from BGR to HSV with the cv2.COLOR_BGR2HSV method:
# Convert BGR to HSV
image_hsv = cv2.cvtColor(image, cv2.COLOR_BGR2HSV)

# Display the HSV image
plt.figure(figsize=(10, 5))

plt.subplot(1, 2, 1)
plt.title('Original BGR Image')
plt.imshow(image_rgb)

plt.subplot(1, 2, 2)
plt.title('HSV Image')
plt.imshow(image_hsv)  # HSV images look different from RGB/BGR

plt.show()
Here is an example showing the data before and after conversion:
The Grayscale Color Space
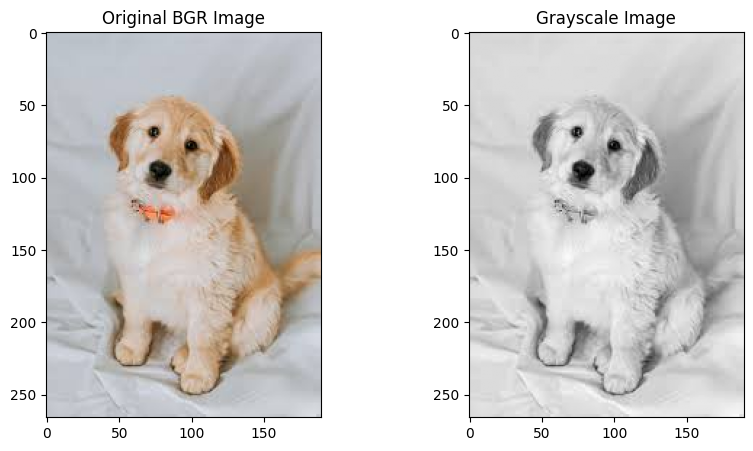
Grayscale is a single-channel representation of an image, where each pixel represents only the intensity of light (brightness). It is often used to augment data for use in training computer vision models.
You can convert data from RGB to Grayscale using the cv2.COLOR_BGR2GRAY method:
# Convert BGR to Grayscale
image_gray = cv2.cvtColor(image, cv2.COLOR_BGR2GRAY)

# Display the grayscale image
plt.figure(figsize=(10, 5))

plt.subplot(1, 2, 1)
plt.title('Original BGR Image')
plt.imshow(image_rgb)

plt.subplot(1, 2, 2)
plt.title('Grayscale Image')
plt.imshow(image_gray, cmap='gray')

plt.show()
Here is an example of an image converted using the code above:
The LAB Colour Space
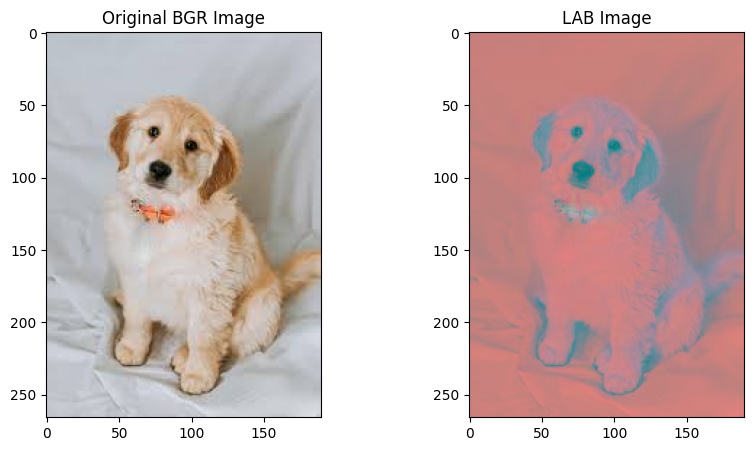
The LAB color space separates color information into three channels:
- L: Lightness (intensity).
- A: Green to Red.
- B: Blue to Yellow.
LAB is designed to approximate human vision and is useful for tasks like color correction and image enhancement.
You can convert data from BGR to LAB with the COLOR_BGR2LAB method:
# Convert BGR to LAB
image_lab = cv2.cvtColor(image, cv2.COLOR_BGR2LAB)

# Display the LAB image
plt.figure(figsize=(10, 5))

plt.subplot(1, 2, 1)
plt.title('Original BGR Image')
plt.imshow(image_rgb)

plt.subplot(1, 2, 2)
plt.title('LAB Image')
plt.imshow(image_lab)

plt.show()
Here is an example of an image converted with this method:
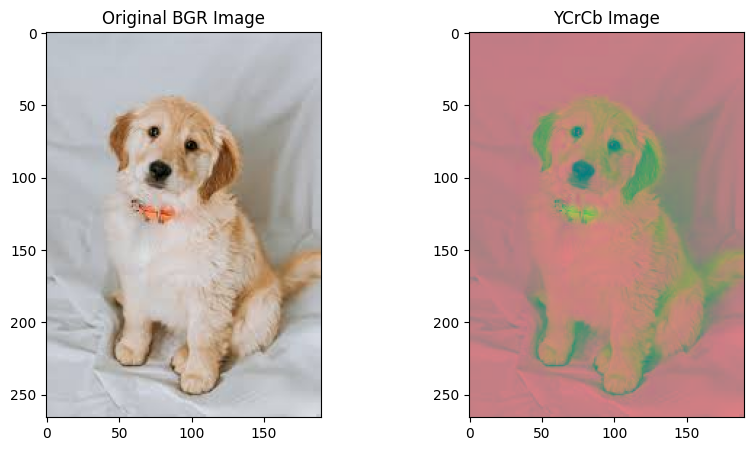
The YCrCb Colour Space
YCrCb is a color space commonly used in video and image compression. It separates luminance (Y) from chrominance (Cr and Cb):
- Y: Luma (brightness).
- Cr: Red difference.
- Cb: Blue difference.
You can convert data from BGR to YCrCb with the COLOR_BGR2YCrCb method:
# Convert BGR to YCrCb
image_ycrcb = cv2.cvtColor(image, cv2.COLOR_BGR2YCrCb)

# Display the YCrCb image
plt.figure(figsize=(10, 5))

plt.subplot(1, 2, 1)
plt.title('Original BGR Image')
plt.imshow(image_rgb)

plt.subplot(1, 2, 2)
plt.title('YCrCb Image')
plt.imshow(image_ycrcb)

plt.show()
Here is an example of an image converted with this method:
Conclusion
Understanding color spaces is crucial for effective image processing and computer vision. OpenCV provides a wide range of color space conversions, each suited for specific tasks.
Whether you’re working with BGR, RGB, HSV, or any other color space, knowing how to manipulate and convert between them will help you achieve better results in your projects.
Cite this Post
Use the following entry to cite this post in your research:
Contributing Writer. (Feb 27, 2025). OpenCV Color Spaces and Conversion: An Introduction. Roboflow Blog: https://blog.roboflow.com/opencv-color-spaces/