
Connecting Roboflow model predictions to Zapier via webhooks lets you route computer vision output to any of the thousands of tools Zapier supports, without building a custom integration for each destination. This guide walks through writing a Python script that runs the Aerial Solar Panels model on a folder of images using the Roboflow Python SDK, then posts each prediction to a Zapier webhook configured to write rows into a Google Sheet. The same webhook endpoint can be swapped for email, SMS, or Slack actions, and multiple Actions can be chained in a single Zap.
Once you have a computer vision model that meets your business requirements, the next step is to connect the model with your logic. Integrating Roboflow with Zapier using a Python script provides a low barrier way to use your model predictions with a vast range of applications. Through Zapier, you can build automation logic using any of the thousands of tools with which Zapier works.
In this guide, we are going to show how to integrate Roboflow with Zapier. By the end of this guide, we will have a webhook configured on Zapier that accepts predictions from our model. This webhook will connect with Google Sheets to save computer vision model predictions to a spreadsheet. Here's an example of predictions saved into the spreadsheet:

Without further ado, let’s get started!
Note: Using Webhooks with Zapier requires a paid subscription to Zapier.
Write a Script to Run Inference on Predictions
Before we can send predictions to a spreadsheet, we will need a script that retrieves those predictions using a model. For this guide, we’re going to use the Aerial Solar Panels model on Roboflow Universe. This model identifies the location of buildings in aerial imagery. We’ll save all of the predictions we find in each image to a spreadsheet.
To get started, first:
- Create a folder called “pending” in which we will store the images that have not yet been run through our model.
- Create a folder called “images” in which we will store images on which we have run inference.
- Create a blank Python script called app.py. This script will contain all of the logic for our application.
With a blank Python script ready, let’s initialize our model and build the logic to retrieve predictions. We’ll start by loading the required dependencies and creating an object through which we can query our model. We’ll also define two variables that contain folder names that we’ll use later in our script.
from roboflow import Roboflow
import requests
import os
import shutil

rf = Roboflow(api_key="API_KEY")
project = rf.workspace().project("MODEL_NAME")
model = project.version(MODEL_VERSION).model

files = os.listdir("images")
In the code snippet above, substitute “API_KEY” for your Roboflow API key. Replace "MODEL_NAME" with the name of your model and "MODEL_VERSION" with the version number associated with your model. You can retrieve the model name and version from the Deploy tab for the model in the Roboflow dashboard:
With this code ready, we can write a for loop that runs through all of the images in the “pending” folder and runs inference:
for file in files:
    print("Running inference on " + file)
    try:
        predictions = model.predict("images/" + file, confidence=40).json()

        print(predictions)
    except:
        print("Error running inference")
        continue
Add an image to the “images” folder. Then, run the script. For this example, we’ll run inference on the following aerial image:
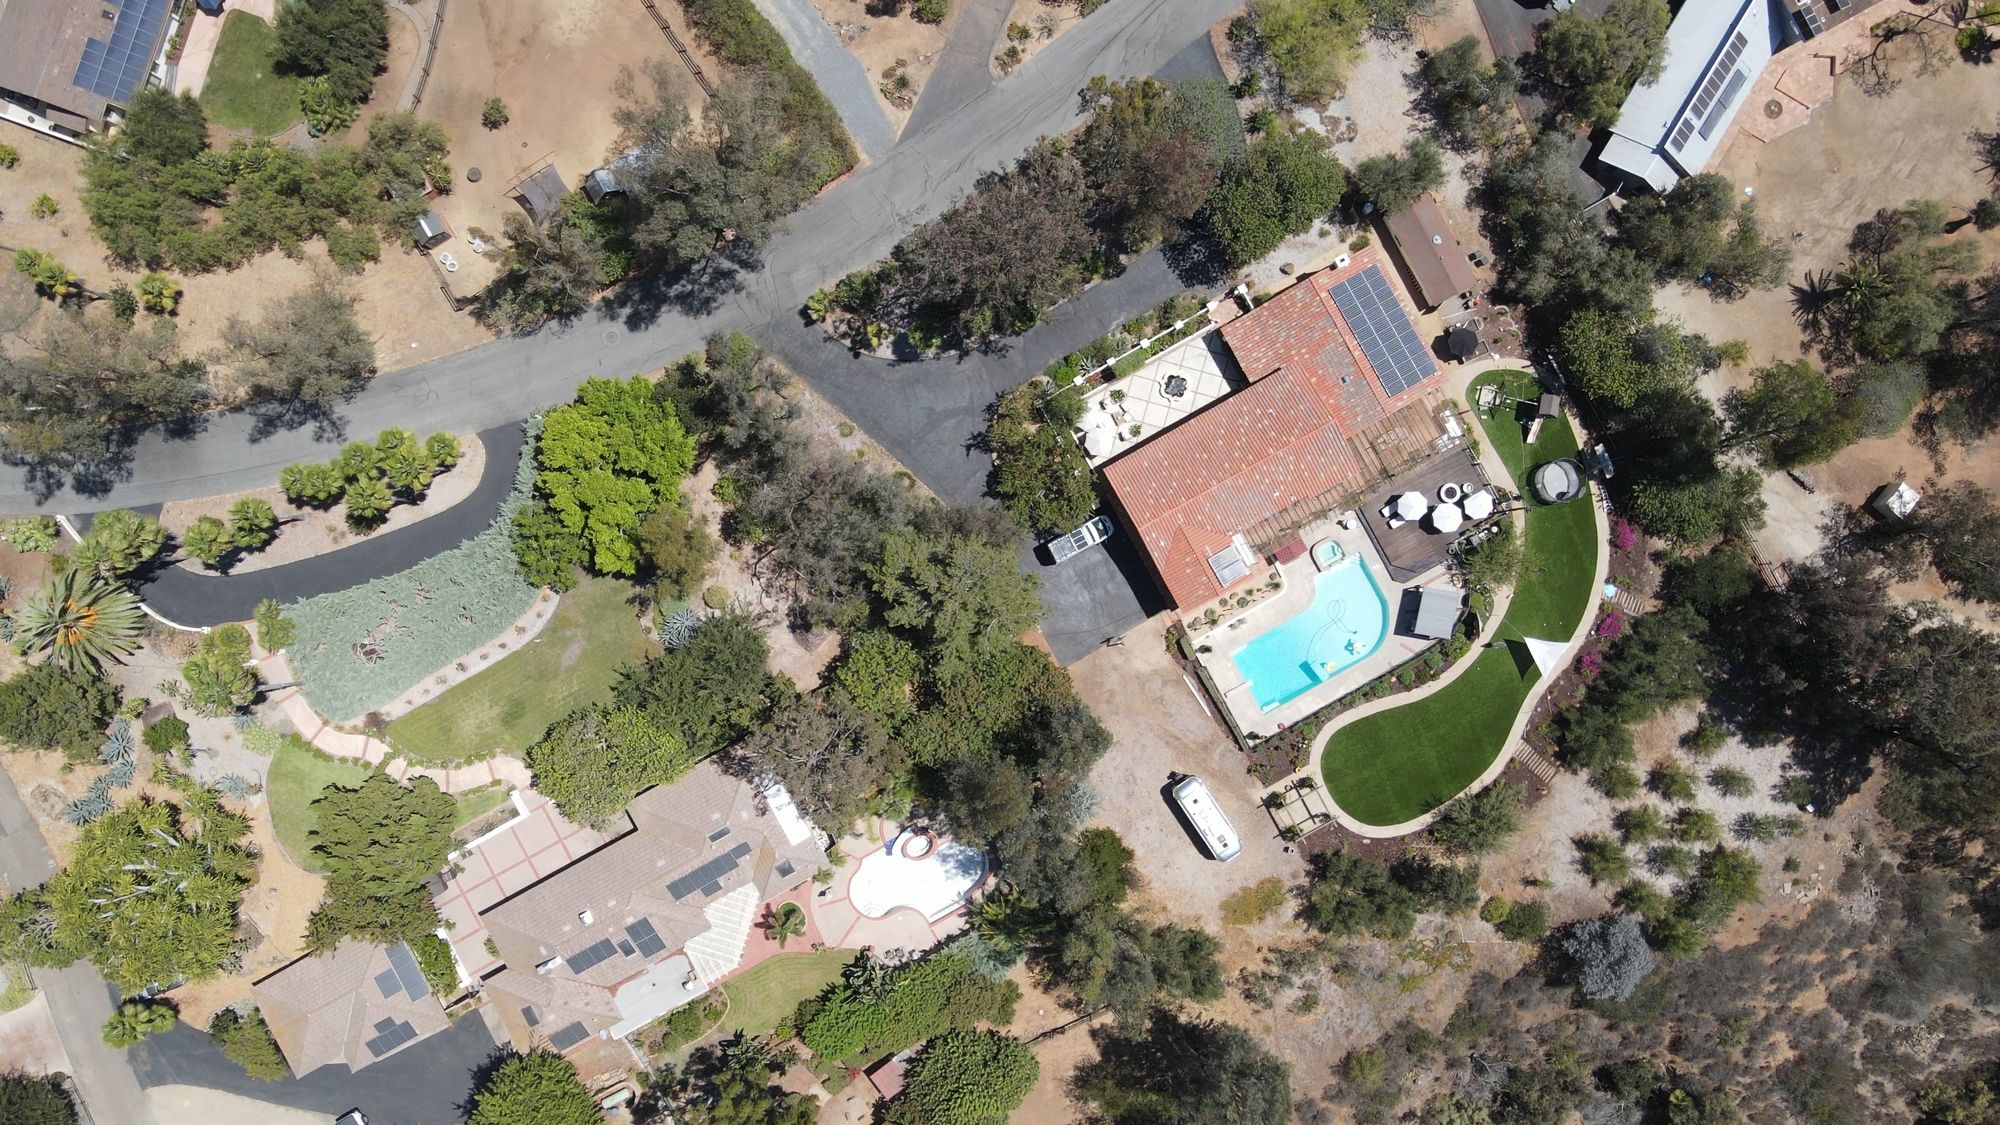
When running the script, a JSON object is printed to the console that shows the location of all of the solar panels in the image. Here's an excerpt of that object:
{'predictions': [{'x': 442.0, 'y': 105.5, 'width': 36.0, 'height': 43.0, 'confidence': 0.8998432159423828, 'class': 'solar-panels', 'image_path': 'images/original (2) Medium.jpeg', 'prediction_type': 'ObjectDetectionModel'}...]}Now that we have this logic ready, we can begin building an integration with Zapier.
Build a Workflow with Zapier
If you don’t already have an account on Zapier, create one on their website. When you have an account, click “Create Zap” on the dashboard, where a “Zap” refers to a workflow that connects two or more applications together. Our Zap will use two services:
- Webhooks: This will create a URL on Zapier to which we can send a POST request with arbitrary data. There are other options available – for example, Zapier can poll a URL for changes – but for this guide we will send POST requests to the webhook.
- Google Sheets: This is the destination for all of the data we send to the webhook.
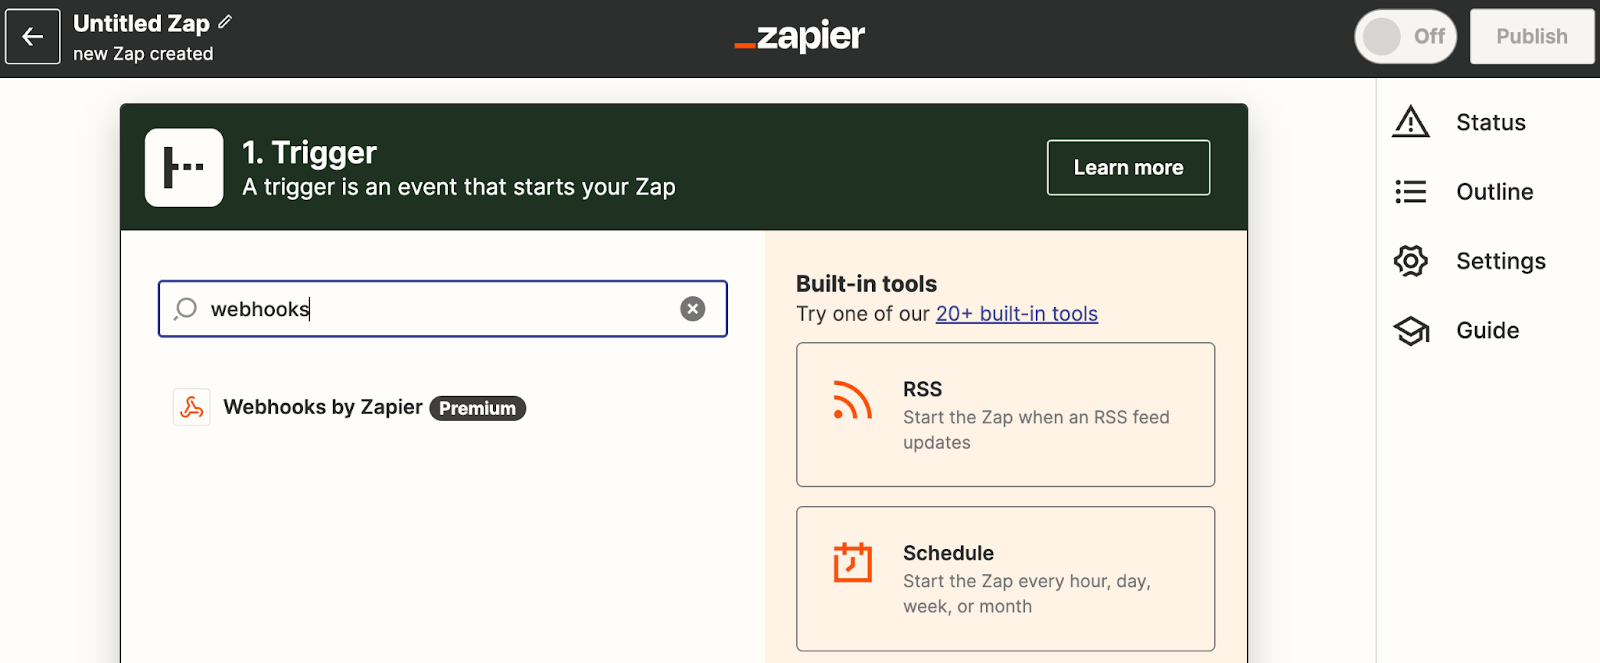
In the “Trigger” box on the page, select “Webhooks by Zapier”:
Then, select “Catch Hook” in the event box on the trigger:
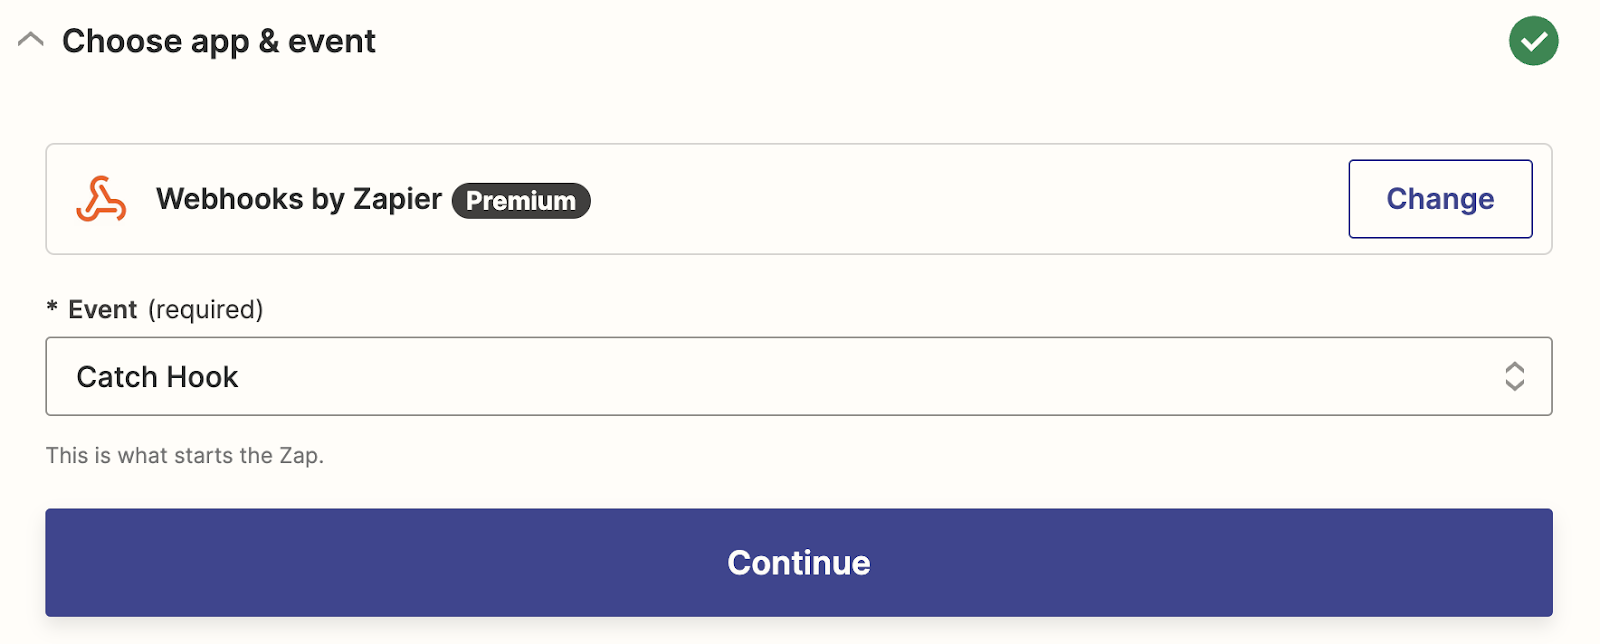
Click “Continue”, then click “Continue” again on the “Set up trigger” page. Now, we have a webhook that’s listening for data. Great! We can return to our application and test sending data to the webhook.
Send Data to the Webhook
In the for loop we created earlier, we are going to add two pieces of logic:
- Send a POST request to our webhook with data about each prediction retrieved from our model.
- Move the image on which we have run inference to the COMPLETED_INFERENCE_FOLDER destination we determined earlier. Moving the file will ensure we don’t run inference again on an image.
Here is the code we will need:
	for p in predictions["predictions"]:
        webhook_data = {
            "x": p["x"],
            "y": p["y"],
            "width": p["width"],
            "height": p["height"],
            "image": file,
            "confidence": p["confidence"],
            "class": p["class"]
        }

        response = requests.post(WEBHOOK_URL, json=webhook_data)

        if response.status_code != 200:
            print("Error sending webhook")
    try:
        shutil.move("images/" + file, "completed/" + file)
    except Exception as e:
        print("Error moving file: " + str(e))
If you are working with an instance segmentation model, update the "webhook_data" value based on the information that you want to save. Instance segmentation models return all of the points required to make a polygon. This data is structured differently than the object detection predictions with which we are working in this guide.
Go back to Zapier and copy the URL provided to which you can send predictions. Replace the “WEBHOOK_URL” variable in the code above with the URL provided by Zapier. You can add more values to the “webhook_data” dictionary if there is more metadata that you want to send. Now, run all of the code.
When you run the code, inference will be run and your data will make its way to Zapier. After you have run the program, click “Test Trigger” in Zapier to make sure the hook was received. Here is the result of running our example program on the aerial image from earlier:
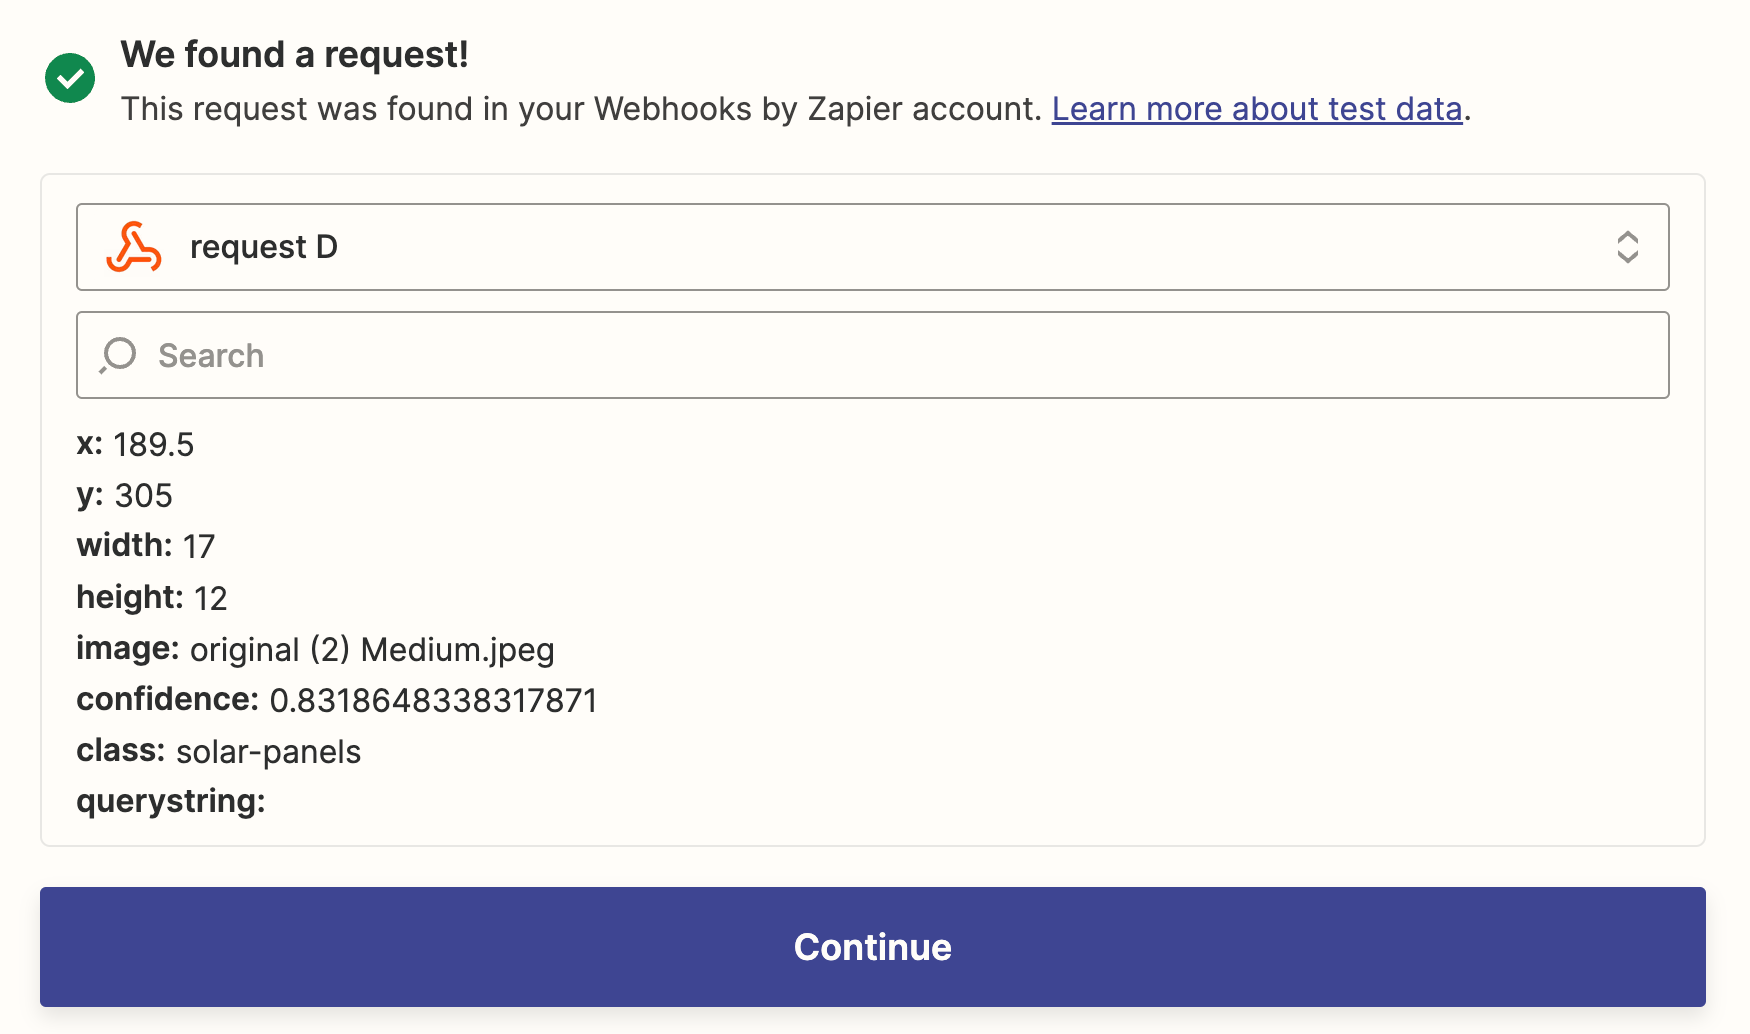
The coordinates for our prediction, as well as related metadata such as the image name, have been sent to Zapier. Click “Continue”. Now we can build logic to do something with this information.
Connect Zapier to Google Sheets
We’re going to create a new row in a Google Sheet when a prediction is made. If you want to do something else, you can skip this section and start working on your own pipeline! Zapier has thousands of tools with which you can work, and provides an intuitive interface through which you can set up your workflow.
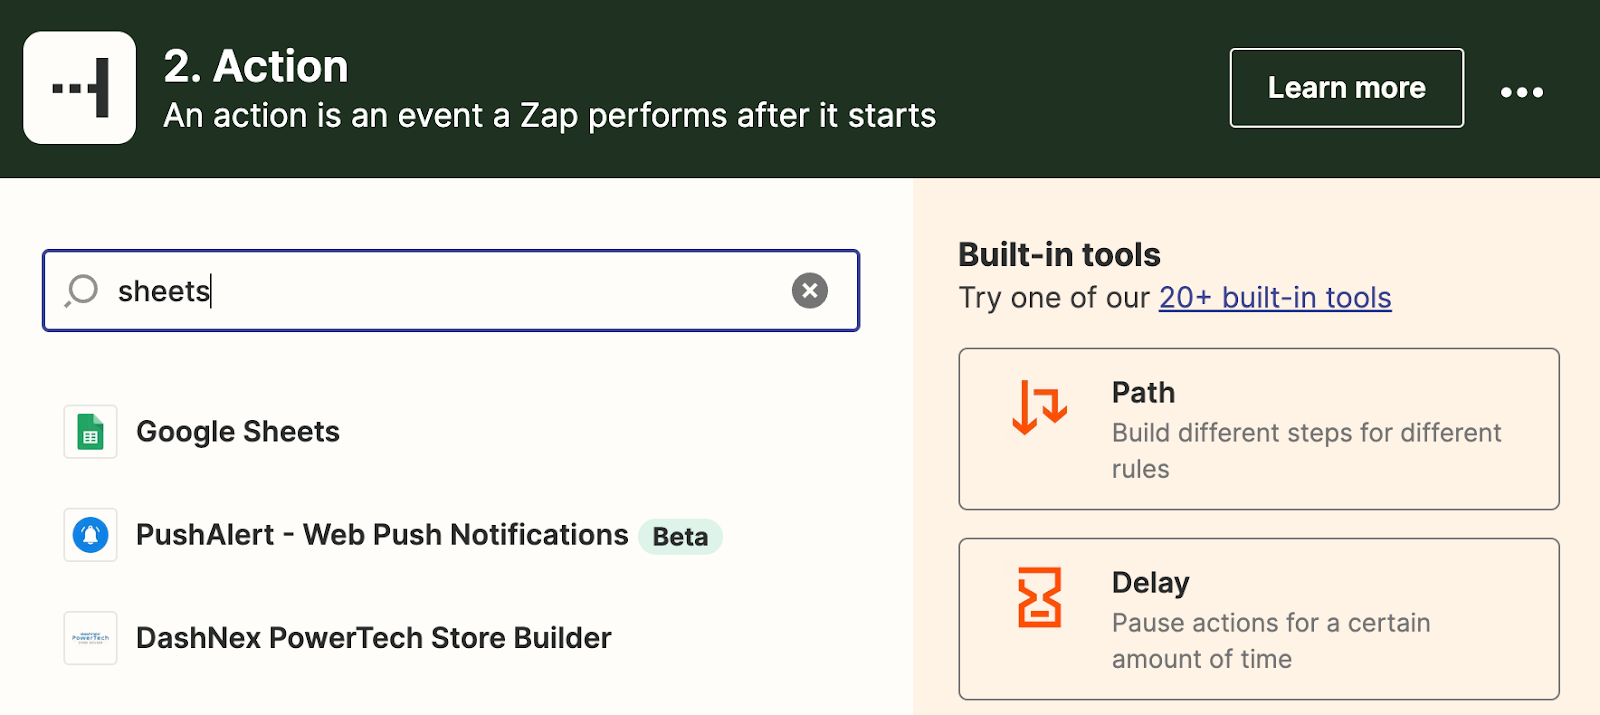
Continuing with our example of creating a row in a Google sheet, let’s select “Google Sheets” in the Action section of Zapier:
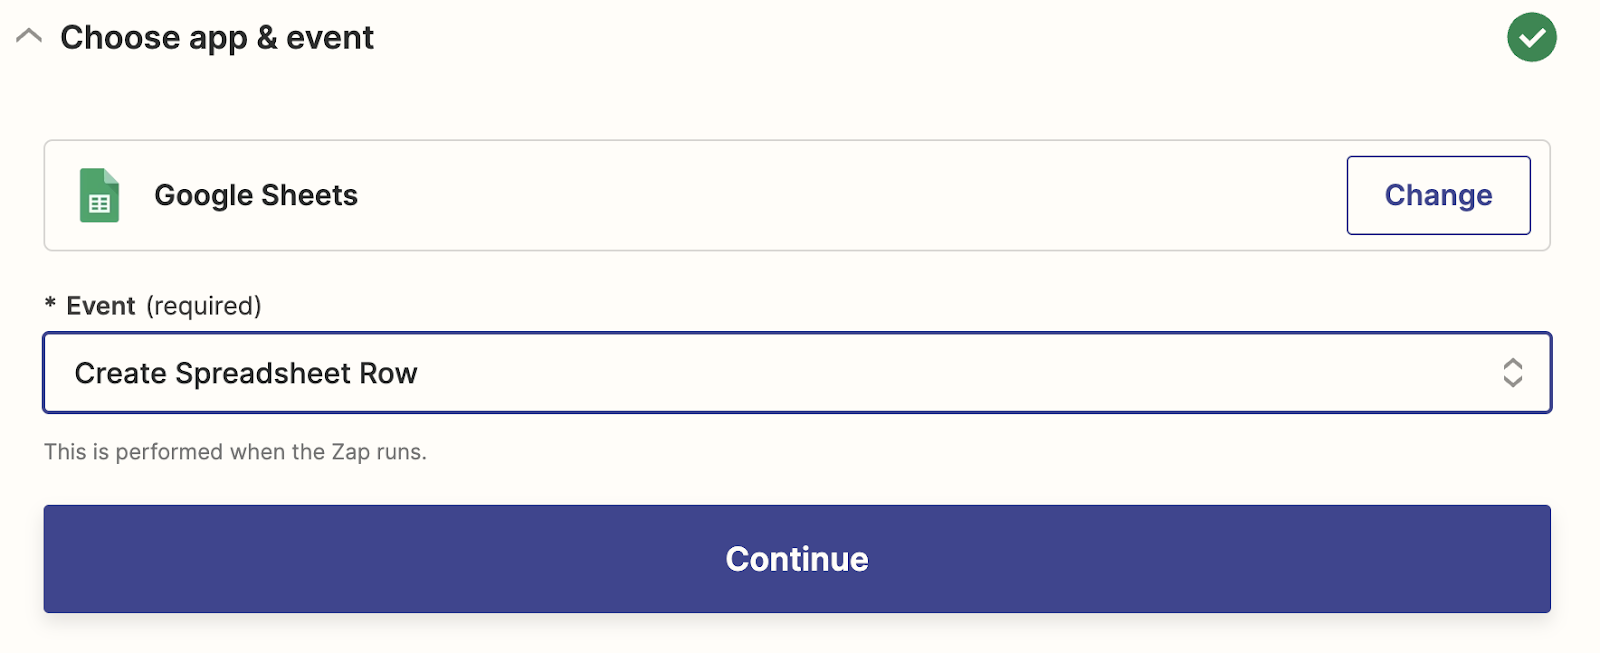
Click “Create Spreadsheet Row” in the “Event” field, then click “Continue”.
In a new tab, create a spreadsheet. This spreadsheet should have the same columns as the values you defined in the “webhook_data” variable earlier. In our earlier example, we set these values:
- x
- y
- width
- height
- image
- confidence
- class
Here is what our spreadsheet header row should look like:

Let’s call our spreadsheet “Solar Panel Predictions”. Go back to Zapier and then select the account that you want to use in your Zap. You will be asked to authenticate with Google and give Zapier permission to access your Google Sheets if this is your first time working with Google Sheets in Zapier.
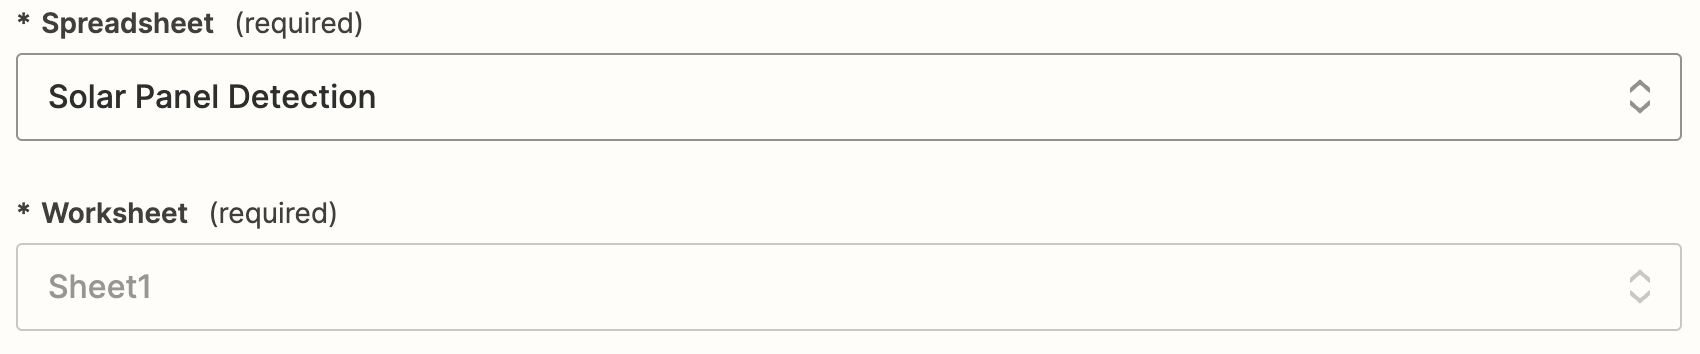
Once you have granted the requisite permissions, select the spreadsheet name from the “Spreadsheet” dropdown, and select the worksheet name from the Worksheet dropdown:
Zapier will show the names of all of the columns in your sheet. We need to tell Zapier what data points sent via webhook should appear in each column. For each column, select the right value from the webhook:
Once you have set up all of your columns, click “Continue”. Now we’re ready to test our Action to make sure everything is working as expected. Click “Test action”. This will send the data you sent in your webhook test to your Google Sheet.
Open up the spreadsheet with which you are working again. There should be a new row in the sheet with information from your prediction:

Great! We now have our Zap set up! Click “Publish Zap”. This will make your Zap live and ready to use in your production applications.
Conclusion
In this guide, we have written a script that runs inference on all of the images in a folder using a Roboflow model and sends the prediction data to a Zapier webhook. Zapier then routes the data sent via our webhook to a Google Sheet.
You could substitute the Google Sheet Action with another action – from sending an email to sending an SMS notification – based on your requirements. You can also add more Actions to your Zap. For example, you could save predictions to a spreadsheet and then send a message to Slack.
Now you have the tools you need to connect Roboflow with Zapier. Happy building!
Cite this Post
Use the following entry to cite this post in your research:
James Gallagher. (Feb 21, 2023). How to Send Roboflow Model Predictions to Zapier Webhooks. Roboflow Blog: https://blog.roboflow.com/zapier/