
Focusing is hard. In recent years, the amount of distractions available to us has been increasing, and we often lose track of how much we are distracted.
To help myself stay engaged, I created a project that accurately tracks how many times I'm distracted in a certain period of time.
In this guide, you'll learn how to build an app to track your productivity as well as play Spotify music every time you are distracted using eye tracking. Before we begin, I’ll first break down everything you need to do at a higher level to better understand the project.
To build the full project we will:
- Build an eye tracking vision model
- Download needed tools
- Configure logic and variables
- Set up the eye tracking boundaries and Spotify API
- Set up graphing the code
Build an Eye Tracking Vision Model
First, you'll creat a Roboflow account to help build a model that can accurately detect your eyes, pupil, phone, and face. Refer to this general Roboflow tutorial video if any tasks below are unclear.
- Sign up to Roboflow and create a new workspace.
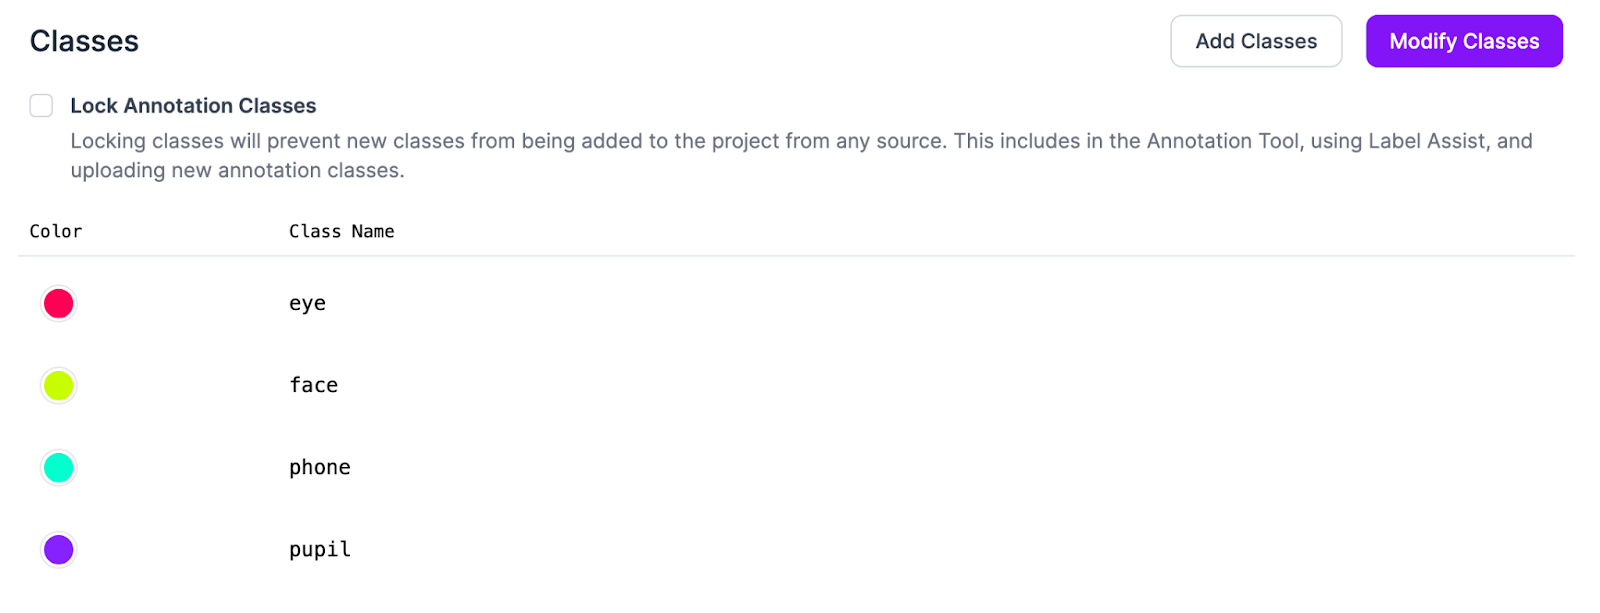
- Create classes by going to the add classes tab and then add the classes you need.
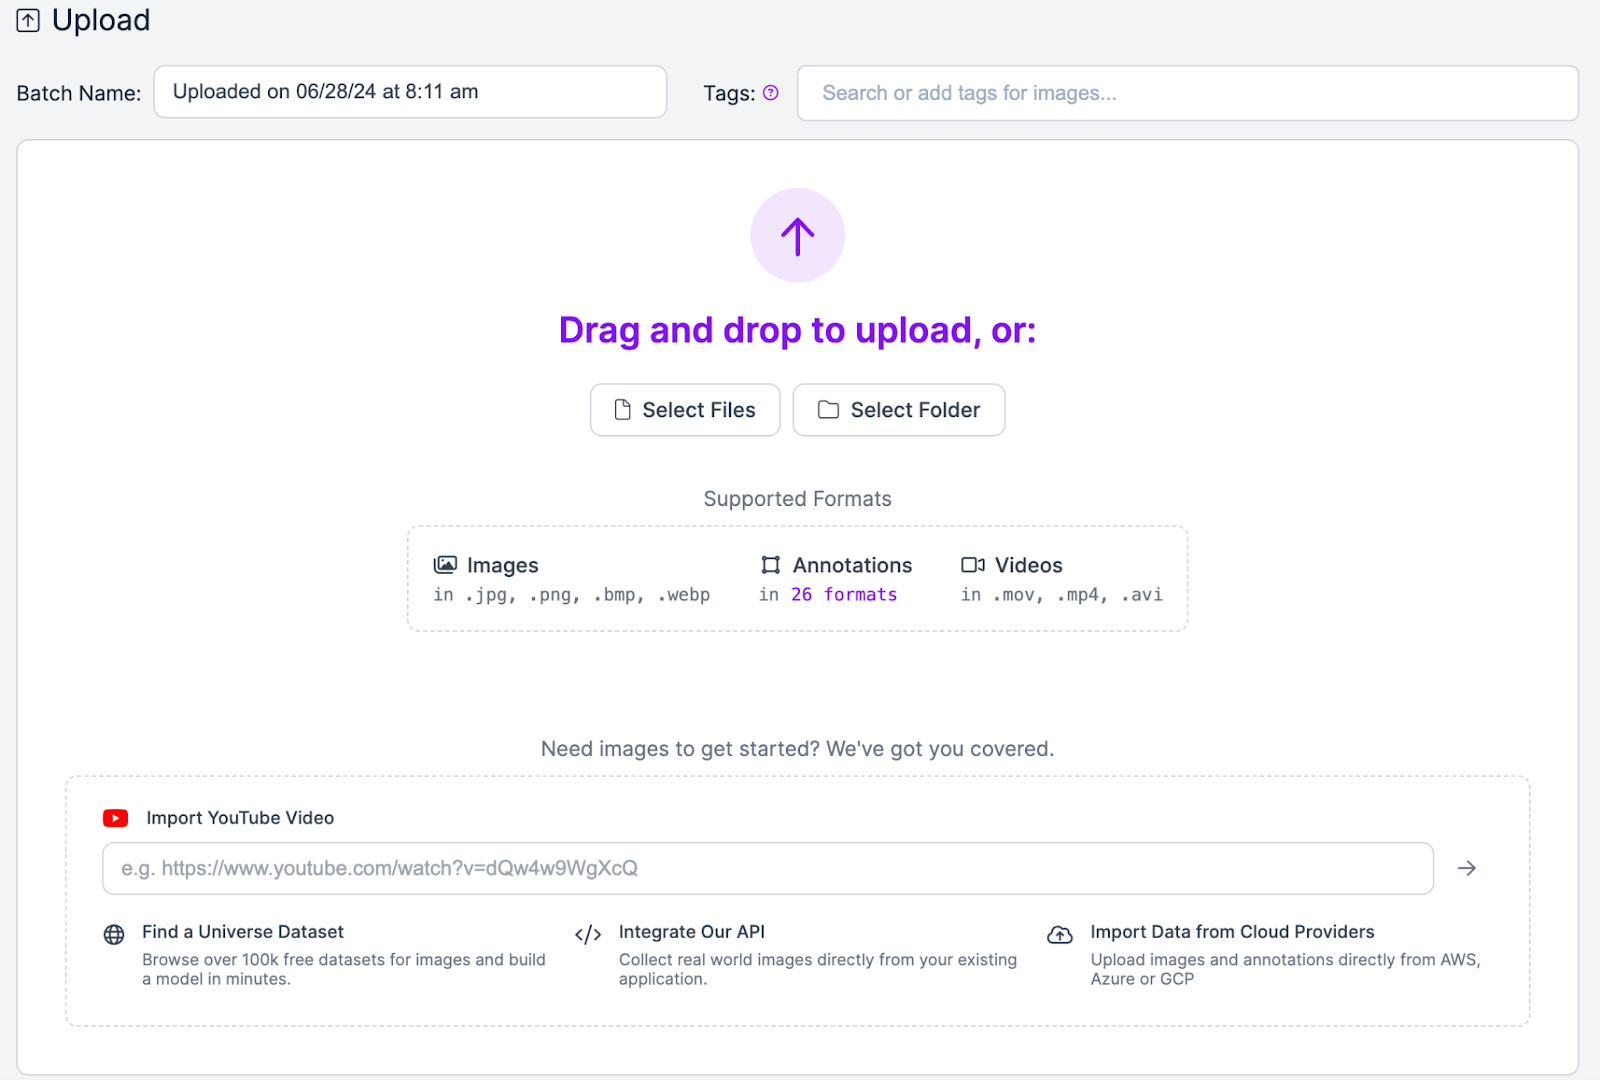
- Upload images
To get high quality images of your face, record a video on your laptop or phone and use a frame generator to get images of your face. Upload images or videos here:
- Start Annotating images
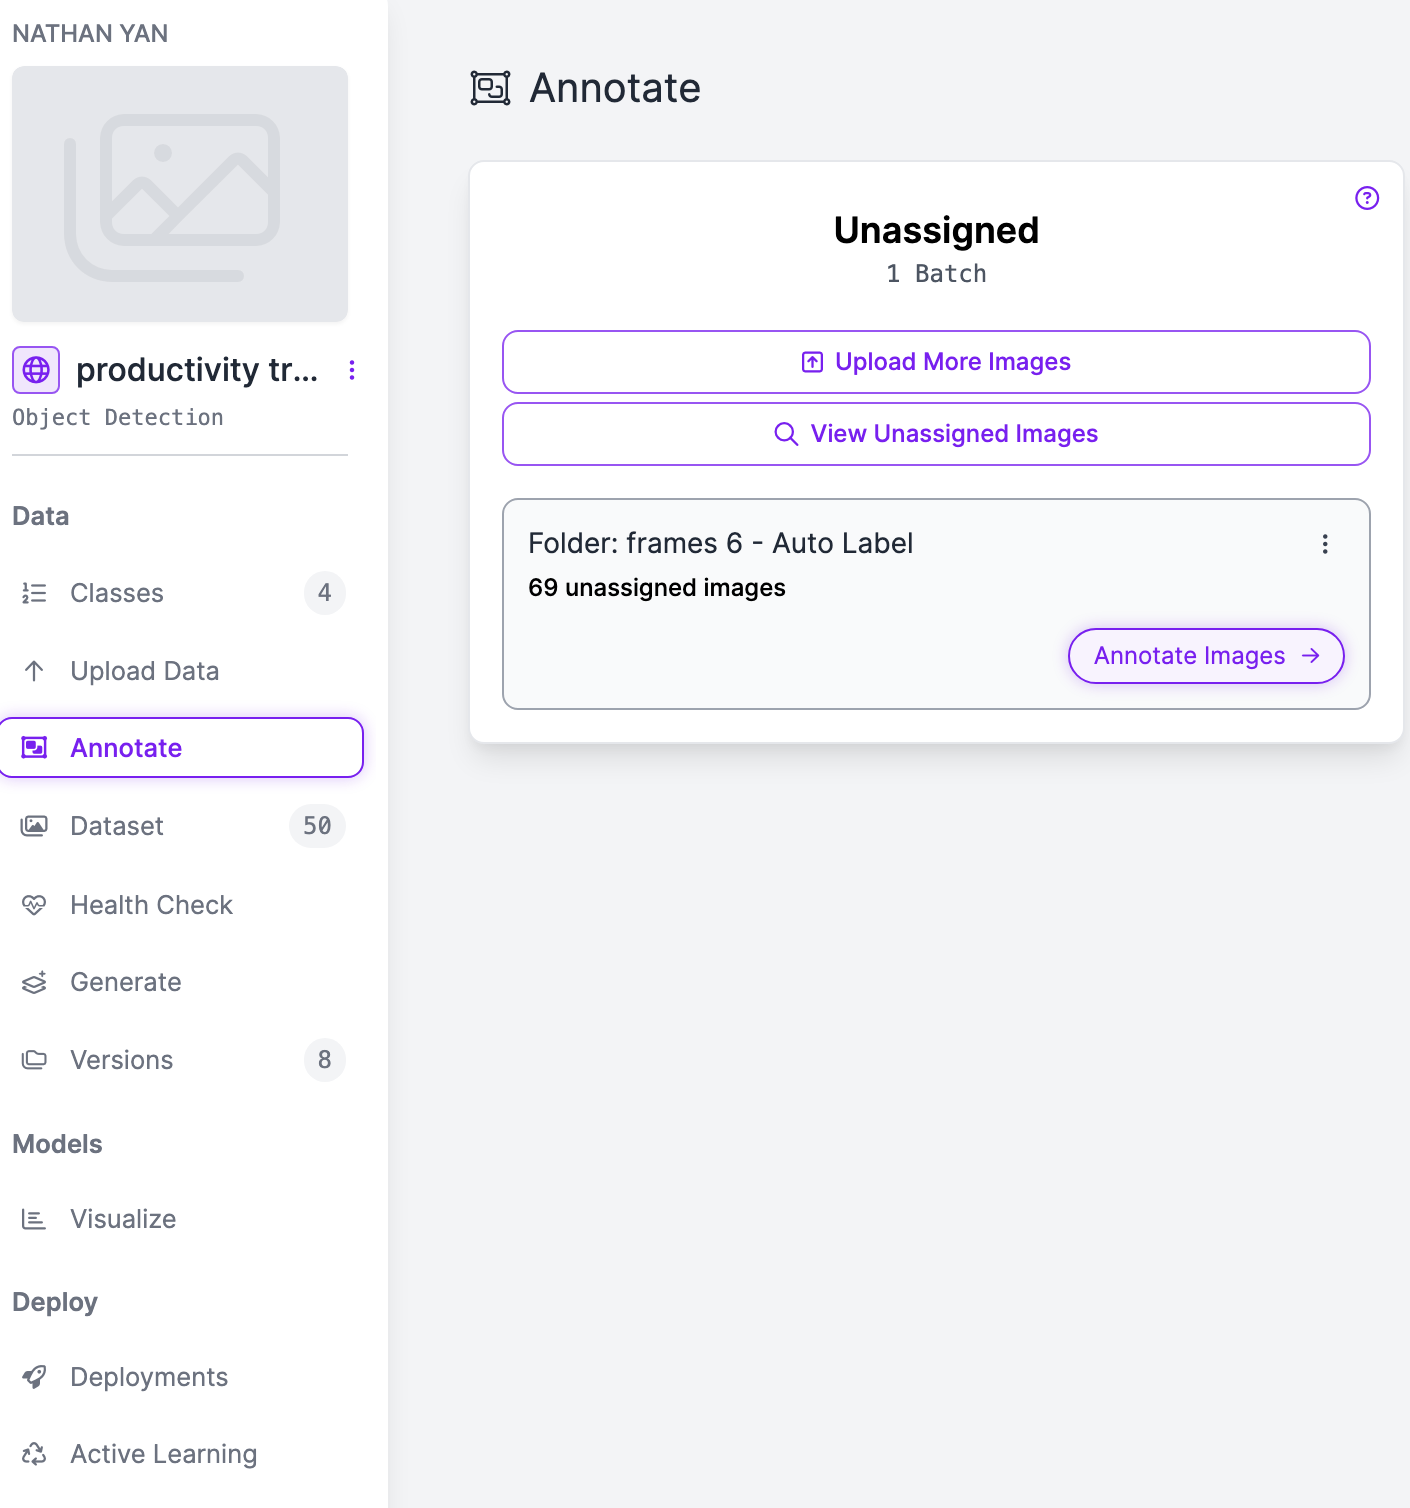
Next go to the Annotate screen in order to start labeling data. Click the annotate images button to get started.
- Annotate the images
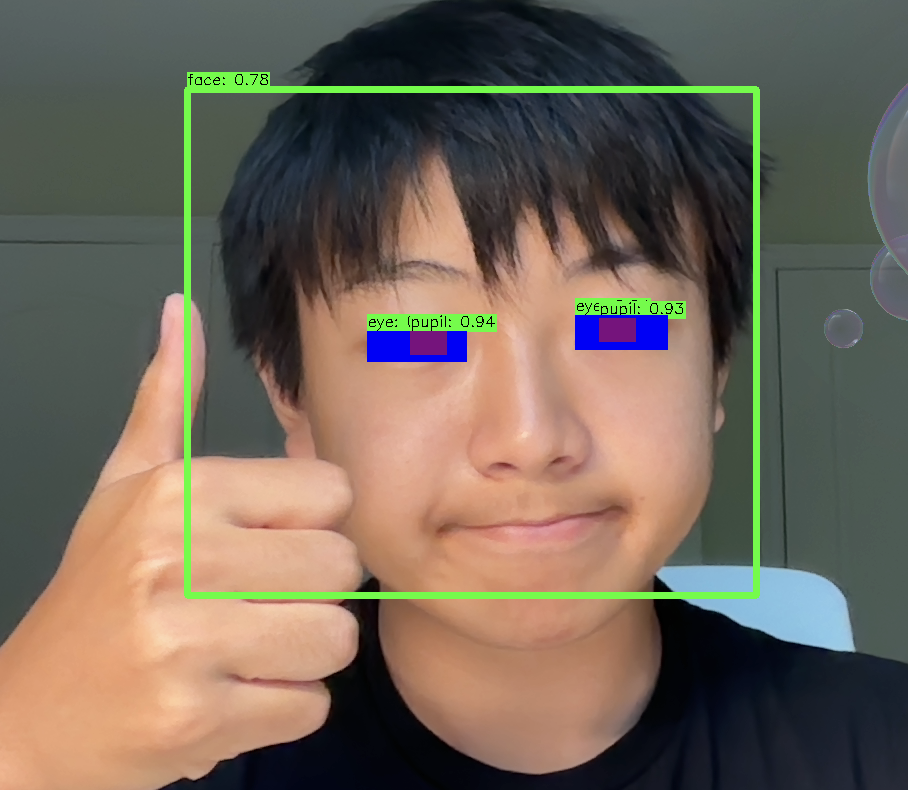
Draw on the boxes around your objects in the annotation screen. In this case, I drew boxes around my face, pupil, and eye.
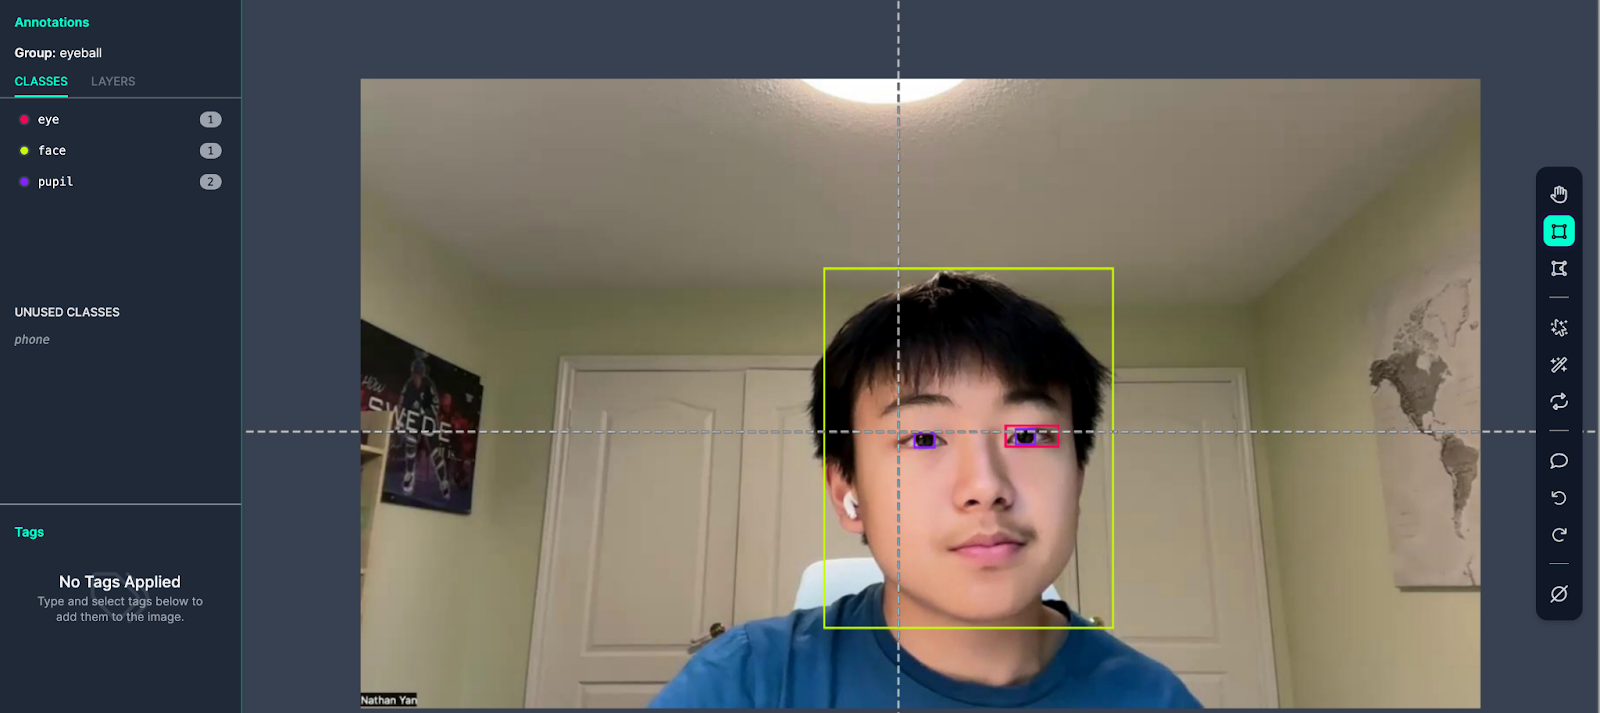
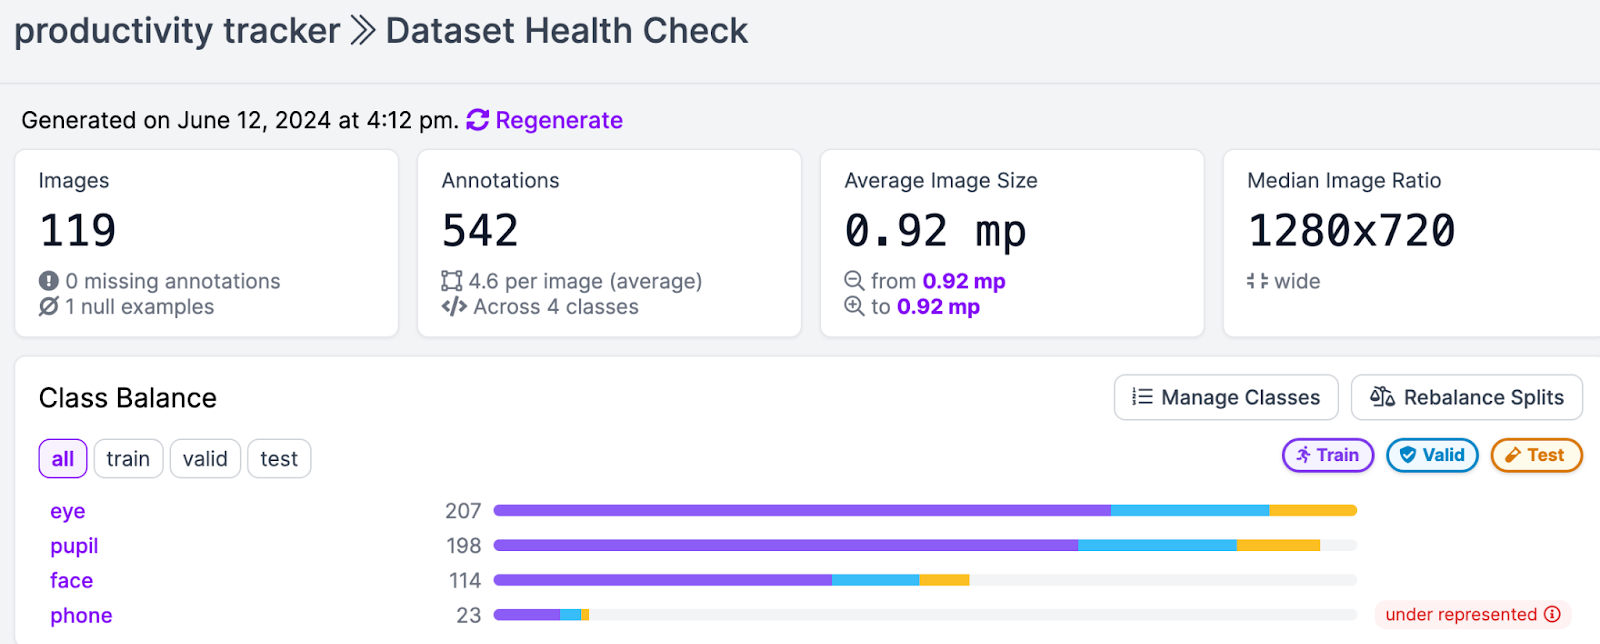
Label around 100 images of your face. Additionally, have around 25 images of you with your phone, and your model should do relatively well.
Here were the statistics from my model, accessible from Roboflow’s Health Check feature.
- Generate a dataset
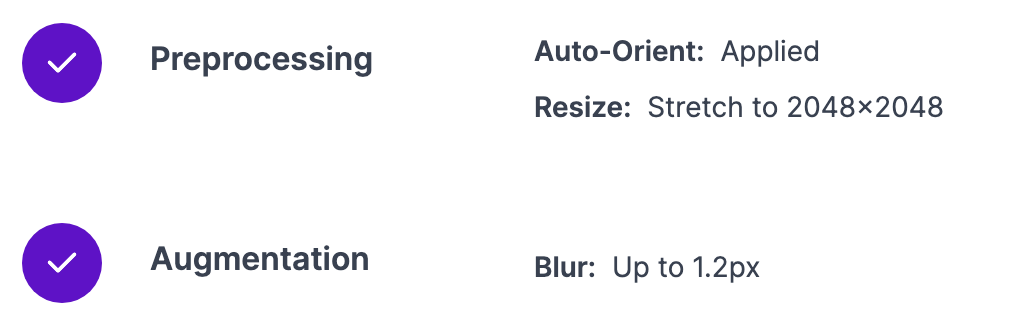
After labeling, go to generate in the sidebar, and make sure to add a step to preprocessing.
Resize the image to 2048x2048. By making the image bigger, this helps the model detect the pupils more accurately.
- Deploy your model
After finishing up the steps in generating and after training, you should see a screen like this:
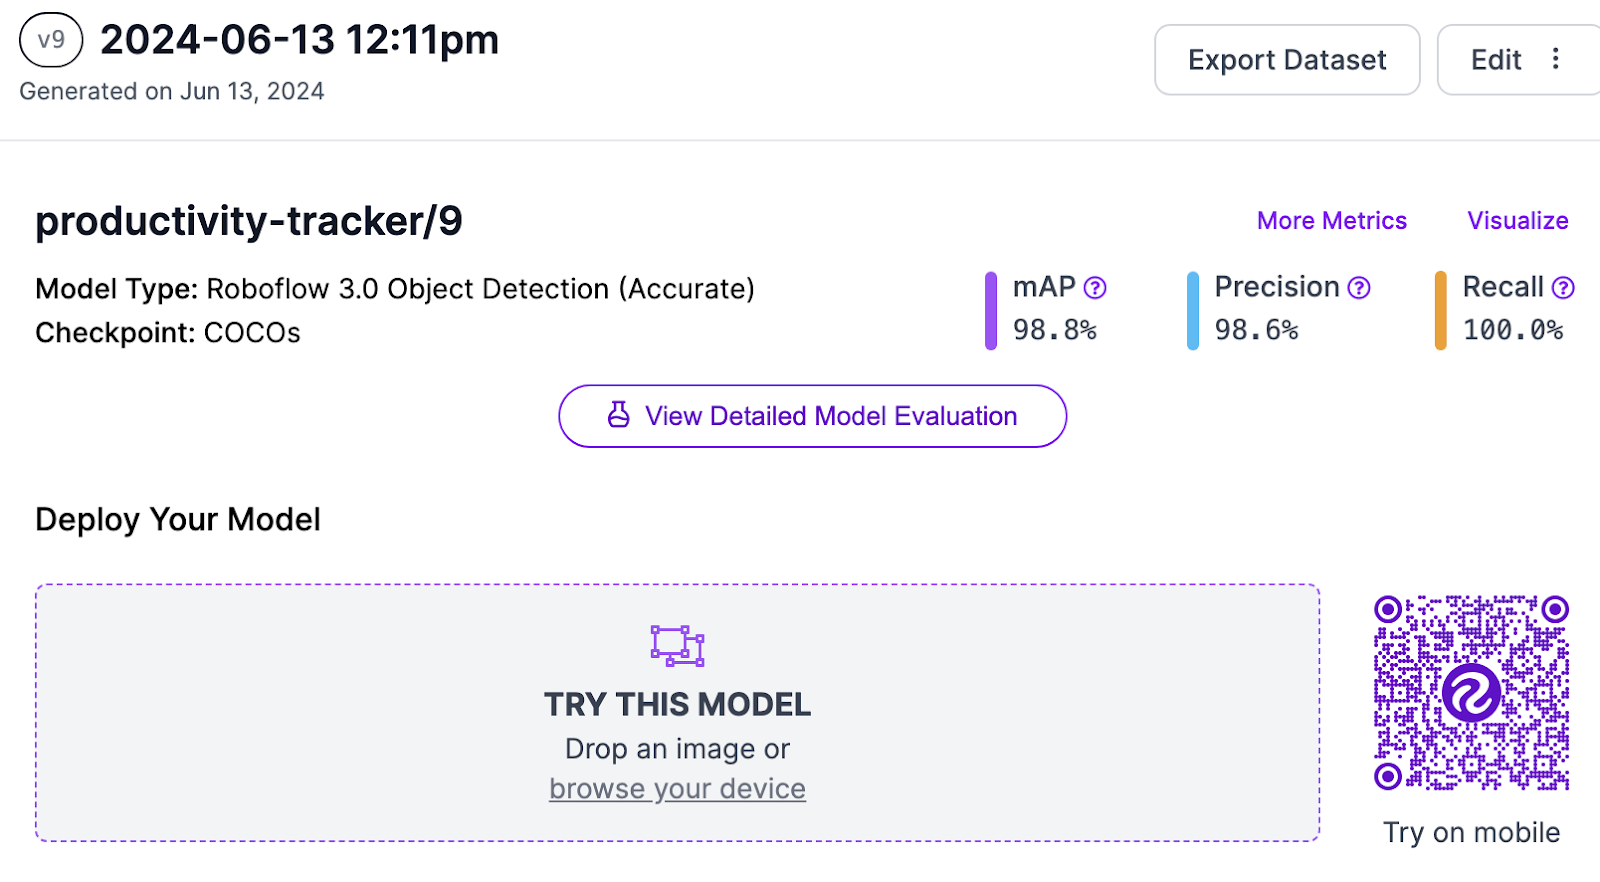
Your model is now ready. It’s time to write code in order to play Spotify music when you get distracted, and graph your productivity.
Download Tools
To start, download the following modules by pip installing them.
- Inference
- Roboflow
- Matplotlib
- Opencv
- Spotipy (Spotipy’s API tool)
NOTE: Downloading Opencv may take a long time (~1 hour) due to wheels. If there are any issues, try upgrading setuptools and wheels.
!pip install opencv-python inference matplotlib spotipy roboflowNext, import the following libraries into a new Python file:
import cv2
from typing import Union, List, Optional
from inference.core.interfaces.camera.entities import VideoFrame
from inference import InferencePipeline
from datetime import datetime
import matplotlib.pyplot as plt
import spotipy
from spotipy.oauth2 import SpotifyOAuth
Define Variables
In this step, you will have to define variables you need for the project.
Below is a brief description of what each variable is used for.
API Key: Roboflow’s API Key is needed in order to use the model we created.
Eye_Vals and Pupil_Vals: Stores the values of the two eyes and pupils in a dictionary. This dictionary contains the following information for each eye and pupil:{ "label": label,
"confidence": confidence,
"start_point": start_point,
"end_point": end_point,
"x": x,
"y": y,
"width": width,
"height": height
}
Colors: For the different colors we’ll use in the model (for the eyes, pupil, face and phone coloring)
Total information: Stores all the detected items in one frame. Each item is stored in a dictionary that has the following information:{ "label": label,
"confidence": confidence,
"start_point": start_point,
"end_point": end_point,
"x": x,
"y": y,
"width": width,
"height": height
}
Prev information: Stores all the detected items in the previous frame. Same storing logic as information.
Prev_difference_left and Prev_difference_right: Set at 50, it stores the previous difference of how far the eye is from the pupil (to see if you’re looking away from the screen which means you’re unproductive)
once: Set to True, used to only play spotify music once
x_point: Stores the time at which you were unproductive
y_point: Counts how many times you were unproductive
This is the same format and logic for the other four variables.
api_key = "API_KEY"


# Finds where the pupil and eyes are
pupil_vals = []
eye_vals = []


# Colors
GREEN = (0, 255, 0)
RED = (0, 0, 255)
BLUE = (255, 0, 0)
PURPLE = (128, 0, 128)
ORANGE = (0, 165, 255)
YELLOW = (0, 255, 255)


# Gets our eye tracking values
total_information = []
prev_information = []
prev_difference_left = 50
prev_difference_right = 50
once = True


# For graphing
x_point = []
x_point_phone = []
x_point_eyes = []
y_point = [0]
y_point_phone = [0]
y_point_eyes = [0]
Add Draw Functions
# Draw functions
def draw_box(x, y, width, height, image, COLOR):
   start_point = (int(x - width / 2), int(y - height / 2))
   end_point = (int(x + width / 2), int(y + height / 2))


   cv2.rectangle(image, start_point, end_point, COLOR, cv2.FILLED)
In the code above, we write a function that draws boxes on specified parts of an image.
The Color scheme of each item is:
Pupils are Purple
Eyes are Blue
Face is Green
Phone is Red
def get_specific_eyes(eye_vals, pupil_vals):
   if eye_vals[0]['x'] < eye_vals[1]['x']:
       right_eye = eye_vals[0]
       left_eye = eye_vals[1]
   if eye_vals[0]['x'] > eye_vals[1]['x']:
       right_eye = eye_vals[1]
       left_eye = eye_vals[0]
   if pupil_vals[0]['x'] < pupil_vals[1]['x']:
       right_pupil = pupil_vals[0]
       left_pupil = pupil_vals[1]
   if pupil_vals[0]['x'] > pupil_vals[1]['x']:
       right_pupil = pupil_vals[1]
       left_pupil = pupil_vals[0]
   return right_eye, left_eye, right_pupil, left_pupil
The get_specific_eyes function takes in the two eyes and pupil values (which we defined in the last step), and looks at the X axis of both. The X axis starts at the top left corner.
This means that if the first eye (eye_vals[0]) has a x coordinate less than the second eye (eye_vals[1]), then the right eye is eye_vals[0] and the left is eye_vals[1]. However if the first eye has a x coordinate greater than the second eye, then the right eye is eye_vals[1] and the left is eye_vals[0].
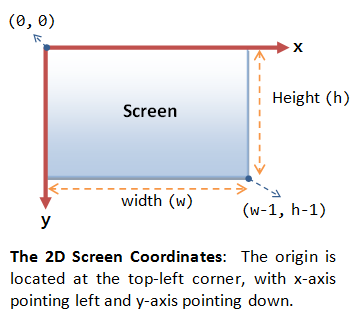
This logic is mirrored onto the left and right pupils.
Connect to Spotify API
If music helps you focus, I recommend utilizing Spotify's API tools in order to add a reminder when you're distracted. However, you will need to have a premium Spotify subscription. If you do not, you can simply skip this step.
First, in order to get your client id and client secret keys, you’ll need to create an app using the “Getting started” section of these instructions.
# Replace with your Spotify app credentials
client_id = 'Client_Id'
client_secret = 'Client_Secret'
redirect_uri = 'http://localhost:8888/callback'


# Scope to control playback
scope = 'user-modify-playback-state user-read-playback-state'


# Authenticate and get token
sp = spotipy.Spotify(auth_manager=SpotifyOAuth(client_id=client_id,
                                              client_secret=client_secret,
                                              redirect_uri=redirect_uri,
                                              scope=scope))
# Search for a playlist
def search_playlist(name):
   results = sp.search(q=f'playlist:{name}', type='playlist', limit=1)
   if results['playlists']['items']:
       playlist = results['playlists']['items'][0]
       print(f"Found playlist: {playlist['name']} with URI: {playlist['uri']}")
       return playlist['uri']
   else:
       print("Playlist not found")
       return None
After that, create a search playlist function that uses Spotify’s api to find the playlist you want. The function searches for the inputted playlist in an item list. If it finds the playlist, it will print “Found playlist” along with the playlist name.
To use it, input a name into the function like what I did here (I chose classical since that's what makes me focus the best):
playlist_name = "Best Classical Music"
search_playlist(playlist_name)
Above, we create a function called play_playlist that will:
- find the playlist - playlist_uri = search_playlist(playlist_name)
- find a device that has the spotify account - if playlist_uri: devices = sp.devices()
- Shuffle the playlist - sp.shuffle(True, device_id=device_id)
- Start playing the song - sp.start_playback(device_id=device_id, context_uri=playlist_uri)
# Function to play a track
def play_playlist(playlist_name):
   playlist_uri = search_playlist(playlist_name)
   if playlist_uri:
       devices = sp.devices()
       if devices['devices']:
           device_id = devices['devices'][0]['id']  # Use the first available device
           sp.shuffle(True, device_id=device_id)


           sp.start_playback(device_id=device_id, context_uri=playlist_uri)
           print(f"Playing playlist on device: {devices['devices'][0]['name']}")
       else:
           print("No active devices found. Please open Spotify on your device and try again.")
After that, you can test it by running the following code:
play_playlist("Best Classical Music")
Combining both functions, you should be able to start playing this playlist: (make sure to like the playlist first if it isn't working.)

If you want to play your own personal playlist, replace “Best classical Music” with the playlist of your choice.
Run the Model
In this step, we create the main logic for everything we did in the previous 5 steps. The function will:
- Draw out the predictions
- Show the image
- Create the eye tracking logic
- Use Spotify’s API to play music when one is distracted
- Add information to graphic logic
Here is the main code. In the following code snippets, code is repeated in order to explain each part clearly.
# Main prediction function
def on_prediction(
   predictions: Union[dict, List[Optional[dict]]],
   video_frame: Union[VideoFrame, List[Optional[VideoFrame]]],
) -> None:
   if not isinstance(predictions, list):
       predictions = [predictions]
       video_frame = [video_frame]
   global once, start_time, prev_information, prev_difference_left, prev_difference_right
   for prediction, frame in zip(predictions, video_frame):
       if prediction is None:
           continue

       # SOME PROCESSING
       image = frame.image
       for obj in prediction['predictions']:
           # Get bounding box coordinates
           x = obj['x']
           y = obj['y']
           width = obj['width']
           height = obj['height']
           label = obj['class']
           confidence = obj['confidence']

           start_point = (int(x - width / 2), int(y - height / 2))
           end_point = (int(x + width / 2), int(y + height / 2))

           information = {
               "label": label,
               "confidence": confidence,
               "start_point": start_point,
               "end_point": end_point,
               "x": x,
               "y": y,
               "width": width,
               "height": height
           }

           if label == "phone" and "phone" not in prev_information:
               x_point.append(datetime.now()-start_time)
               x_point_phone.append(datetime.now()-start_time)
               y_point.append(y_point[len(y_point)-1]+1)
               y_point_phone.append(y_point_phone[len(y_point_phone)-1]+1)

               if once == True:
                   play_playlist("Best Classical Music")
                   once = False


           total_information.append(information)

           # Prepare label text
           label_text = f"{label}: {confidence:.2f}"

           # Get text size
           (text_width, text_height), baseline = cv2.getTextSize(label_text, cv2.FONT_HERSHEY_SIMPLEX, 0.5, 1)

           # Draw background rectangle for the label
           cv2.rectangle(image, (start_point[0], start_point[1] - text_height - baseline),
                           (start_point[0] + text_width, start_point[1]), (0, 255, 0), cv2.FILLED)
           cv2.putText(image, label_text, (start_point[0], start_point[1] - baseline),
                       cv2.FONT_HERSHEY_SIMPLEX, 0.5, (0, 0, 0), 1)

       for i in range(len(total_information)):
           if total_information[i]['label'] == 'phone':
               draw(total_information[i]['x'], total_information[i]['y'], total_information[i]['width'], total_information[i]['height'], RED, image)
           elif total_information[i]['label'] == 'face':
               draw(total_information[i]['x'], total_information[i]['y'], total_information[i]['width'], total_information[i]['height'], GREEN, image)
           elif total_information[i]['label'] == 'eye':
               draw(total_information[i]['x'], total_information[i]['y'], total_information[i]['width'], total_information[i]['height'], BLUE, image)
               eye_vals.append(total_information[i])
       for j in range(len(total_information)):
           if total_information[j]['label'] == 'pupil':
               draw(total_information[j]['x'], total_information[j]['y'], total_information[j]['width'], total_information[j]['height'], PURPLE, image)
               pupil_vals.append(total_information[j])

       if len(eye_vals) == 2 and len(pupil_vals) == 2:
           right_eye, left_eye, right_pupil, left_pupil = get_specific_eyes(eye_vals, pupil_vals)
           right_side_eye = right_eye["x"] - right_eye["width"]/2
           left_side_eye = left_eye["x"] + left_eye["width"]/2
           right_side_pupil = right_pupil["x"]
           left_side_pupil = left_pupil["x"]
           difference_right = right_side_pupil - right_side_eye
           difference_left = left_side_eye - left_side_pupil

           if ((difference_left < 38) or (difference_right < 38)) and (prev_difference_left > 38 and prev_difference_right > 38):
               x_point.append(datetime.now()-start_time)
               x_point_eyes.append(datetime.now()-start_time)
               y_point.append(y_point[len(y_point)-1]+1)
               y_point_eyes.append(y_point_eyes[len(y_point_eyes)-1]+1)

               if once == True:
                   play_playlist("Best Classical Music")
                   once = False

           prev_difference_right = difference_right
           prev_difference_left = difference_left

       if total_information:
           prev_information.clear()
           for info in total_information:
               prev_information.append(info["label"])
       else:
           prev_information = []
       total_information.clear()
       eye_vals.clear()
       pupil_vals.clear()

       cv2.imshow('frame', image)

       if (datetime.now()-start_time).total_seconds() > 120:
           pipeline.terminate()
           pipeline.join()
           cv2.destroyAllWindows()
           break

       if cv2.waitKey(1) & 0xFF == ord('q'):
           break
First, make sure predictions are a list or dictionary object. Do the same for video_frame. After, set both to lists.
def on_prediction(
   predictions: Union[dict, List[Optional[dict]]],
   video_frame: Union[VideoFrame, List[Optional[VideoFrame]]],
) -> None:
   if not isinstance(predictions, list):
       predictions = [predictions]
       video_frame = [video_frame]
Next, set all the needed variables to be global in order to use them in the function.
global once, start_time, prev_information, prev_difference_left, prev_difference_rightMake sure to skip the logic if there are no detections (this saves time to output a frame).
   for prediction, frame in zip(predictions, video_frame):
       if prediction is None:
           continue
In this code block, we get the image through the frame. Using “image = frame.image”
       # SOME PROCESSING
       image = frame.image
       for obj in prediction['predictions']:
           # Get bounding box coordinates
           x = obj['x']
           y = obj['y']
           width = obj['width']
           height = obj['height']
           label = obj['class']
           confidence = obj['confidence']


           start_point = (int(x - width / 2), int(y - height / 2))
           end_point = (int(x + width / 2), int(y + height / 2))


           information = {
               "label": label,
               "confidence": confidence,
               "start_point": start_point,
               "end_point": end_point,
               "x": x,
               "y": y,
               "width": width,
               "height": height
           }


           total_information.append(information)
Then, using the predictions in that frame (gotten from prediction[‘predictions’]), we are able to get the x, y, width, height, label, and confidence of the box.
After, we calculate the start_point and end_point and add that information as well as the previously obtained information such as x, y, width, etc. to the “total_information” list.
Next, we add one of the ways to track one's productivity. If one of the labels in the frame is a phone, we add the time of when I was unproductive to the x_point list. Since y_point tracks the times I was unproductive, add one more to y_point in order to track how productive I am.
           if label == "phone" and "phone" not in prev_information:
               x_point.append(datetime.now()-start_time)
               x_point_phone.append(datetime.now()-start_time)
               y_point.append(y_point[len(y_point)-1]+1)
               y_point_phone.append(y_point_phone[len(y_point_phone)-1])


               if once:
                   playlist_name = "Best Classical Music"
                   search_playlist(playlist_name)
                   play_playlist("Best Classical Music")
                   once = False
Finally, we check if this is the first time I am unproductive. If so, the “if once == True” statement is true and it plays the Spotify music. Remove the if statement logic if you do not want to play Spotify music.
           # Prepare label text
           label_text = f"{label}: {confidence:.2f}"


           # Get text size
           (text_width, text_height), baseline = cv2.getTextSize(label_text, cv2.FONT_HERSHEY_SIMPLEX, 0.5, 1)


           # Draw background rectangle for the label
           cv2.rectangle(image, (start_point[0], start_point[1] - text_height - baseline),
                           (start_point[0] + text_width, start_point[1]), (0, 255, 0), cv2.FILLED)
           cv2.putText(image, label_text, (start_point[0], start_point[1] - baseline),
                       cv2.FONT_HERSHEY_SIMPLEX, 0.5, (0, 0, 0), 1)
Now, draw the label code for each detected bounding box. An example of what the code does is shown below:
for i in range(len(total_information)):
           if total_information[i]['label'] == 'phone':
               draw(total_information[i]['x'], total_information[i]['y'], total_information[i]['width'], total_information[i]['height'], image, RED)
           elif total_information[i]['label'] == 'face':
               draw(total_information[i]['x'], total_information[i]['y'], total_information[i]['width'], total_information[i]['height'], image, GREEN)
           elif total_information[i]['label'] == 'eye':
               draw(total_information[i]['x'], total_information[i]['y'], total_information[i]['width'], total_information[i]['height'], image, BLUE)
               eye_vals.append(total_information[i])
       for j in range(len(total_information)):
           if total_information[j]['label'] == 'pupil':
               draw(total_information[j]['x'], total_information[j]['y'], total_information[j]['width'], total_information[j]['height'], image, PURPLE)
               pupil_vals.append(total_information[j])
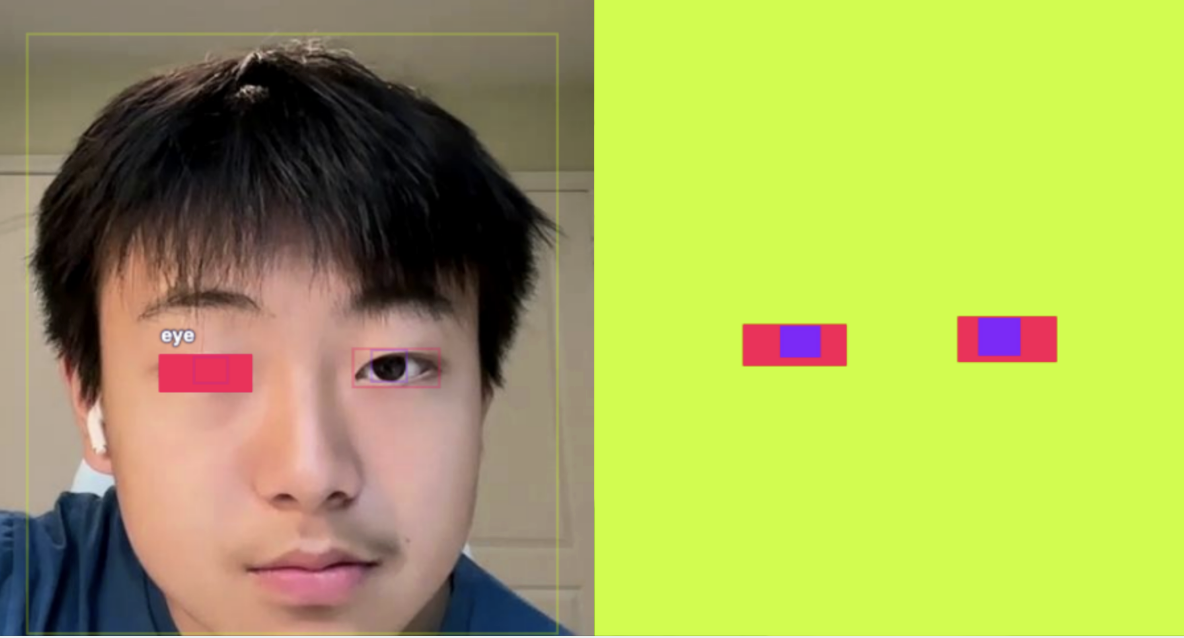
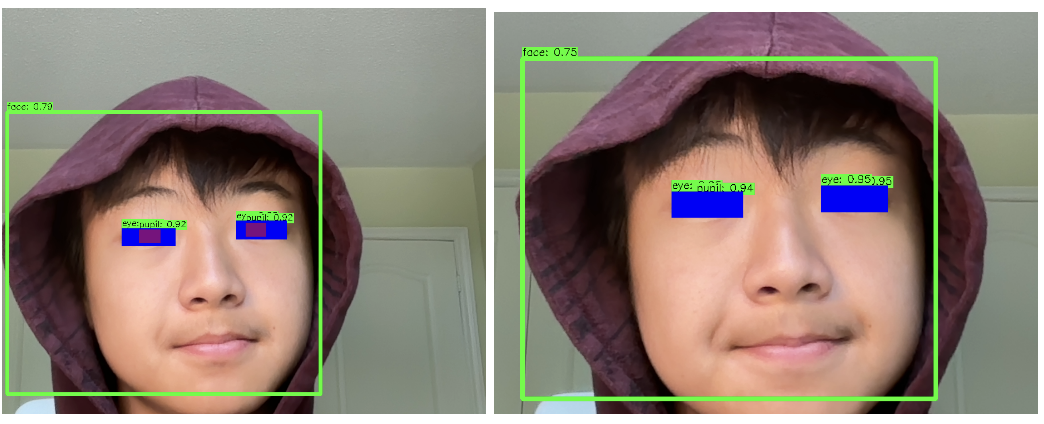
The code above is used to draw out each image using the function and information gotten from previous code. Instead of drawing the objects in the loop for predictions, by drawing each object in a specified order, we are able to confirm no overlap in bounding boxes as the eyes may potentially cover the pupils.
In the two images below, the left one specifies the order of drawing, which is why we are able to see the pupils (since it was drawn last). The other image (right) did not specify, which meant the eye’s were drawn above the pupil, blocking them from our view.
Then, we add the information from total_information to the pupil_vals and eye_vals lists.
       if len(eye_vals) == 2 and len(pupil_vals) == 2:
           right_eye, left_eye, right_pupil, left_pupil = get_specific_eyes(eye_vals, pupil_vals)
           right_side_eye = right_eye["x"] - right_eye["width"]/2
           left_side_eye = left_eye["x"] + left_eye["width"]/2
           right_side_pupil = right_pupil["x"]
           left_side_pupil = left_pupil["x"]
           difference_right = right_side_pupil - right_side_eye
           difference_left = left_side_eye - left_side_pupil
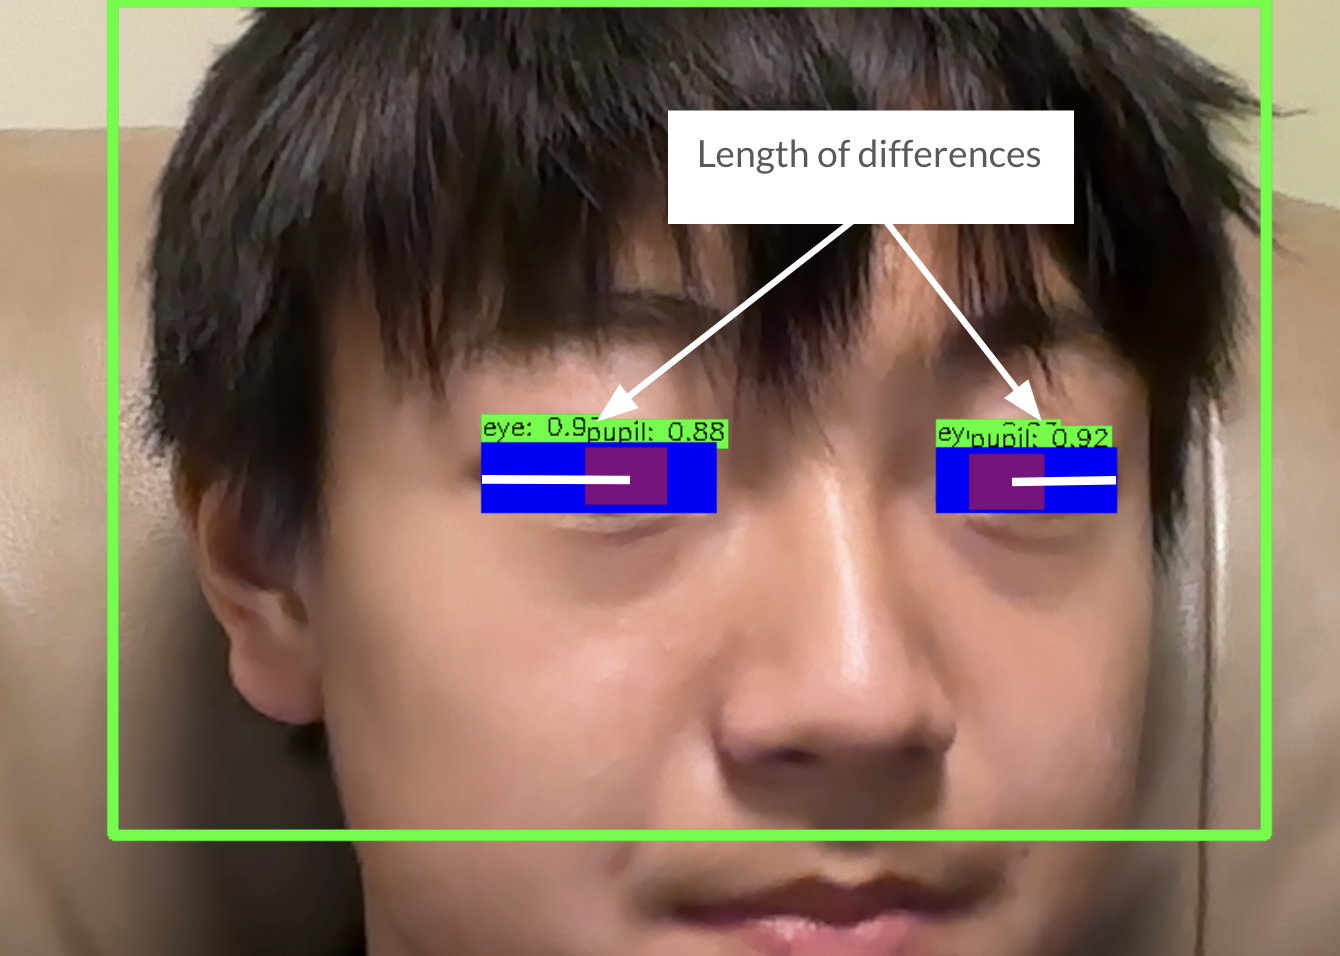
Next, in order to track the difference between the pupil and eye length, I tracked the distance from the outer sides of both eyes to the midpoint of the pupil. These lengths of differences are known as “difference_left” and “difference_right”.
           if ((difference_left < 38) or (difference_right < 38)) and (prev_difference_left > 38 and prev_difference_right > 38):
               x_point.append(datetime.now()-start_time)
               x_point_eyes.append(datetime.now()-start_time)
               y_point.append(y_point[len(y_point)-1]+1)
               y_point_eyes.append(y_point_eyes[len(y_point_eyes)-1]+1)


               if once == True:
                   playlist_name = "Best Classical Music"
                   search_playlist(playlist_name)
                   play_playlist("Best Classical Music")
                   once = False
Using the two differences, I track how small the length of the distance is on one of the pupils. If one pupil’s distance is smaller than 38, then the classical music will play and x_point will add the time. Similar to the phone logic, if this is the first time (indicated if once is still True), then we will play spotify music.
           prev_difference_right = difference_right
           prev_difference_left = difference_left

       if total_information:
           prev_information.clear()
           for info in total_information:
               prev_information.append(info["label"])
       else:
           prev_information = []
       total_information.clear()
       eye_vals.clear()
       pupil_vals.clear()
In this code block, we implement the previous variable logic by defining previous differences and previous information. We also clear the values for total information, eye_vals, and pupil_vals as they are old variables.
cv2.imshow('frame', image)
Finally, we can show the frame of the image. Which looks something like this!
if (datetime.now()-start_time).total_seconds() > 30:
           pipeline.terminate()
           pipeline.join()
           cv2.destroyAllWindows()
           break

       if cv2.waitKey(1) & 0xFF == ord('q'):
           break
The last few pieces of the function are for when the pipeline shuts down. For now, I set a timer that leaves the function when it reaches a time of over 30 seconds. Change the number “30” to any number of seconds you want the code to stop at.
Run the Real-time Pipeline
To run our predictions we will use an Inference pipeline. Inference pipelines are used mainly for real-time object detection models, which means it is perfect for our use case.
pipeline = InferencePipeline.init(
 video_reference=0,
 model_id="productivity-tracker/9", # Replace with your own model
 max_fps = 30,
 confidence=0.6,
 api_key=api_key,
 on_prediction=on_prediction,
)


start_time = datetime.now()
pipeline.start()
Now, we can finally define the pipeline and run it. Also make sure to define the start_time in order to calculate the times at which you were distracted.
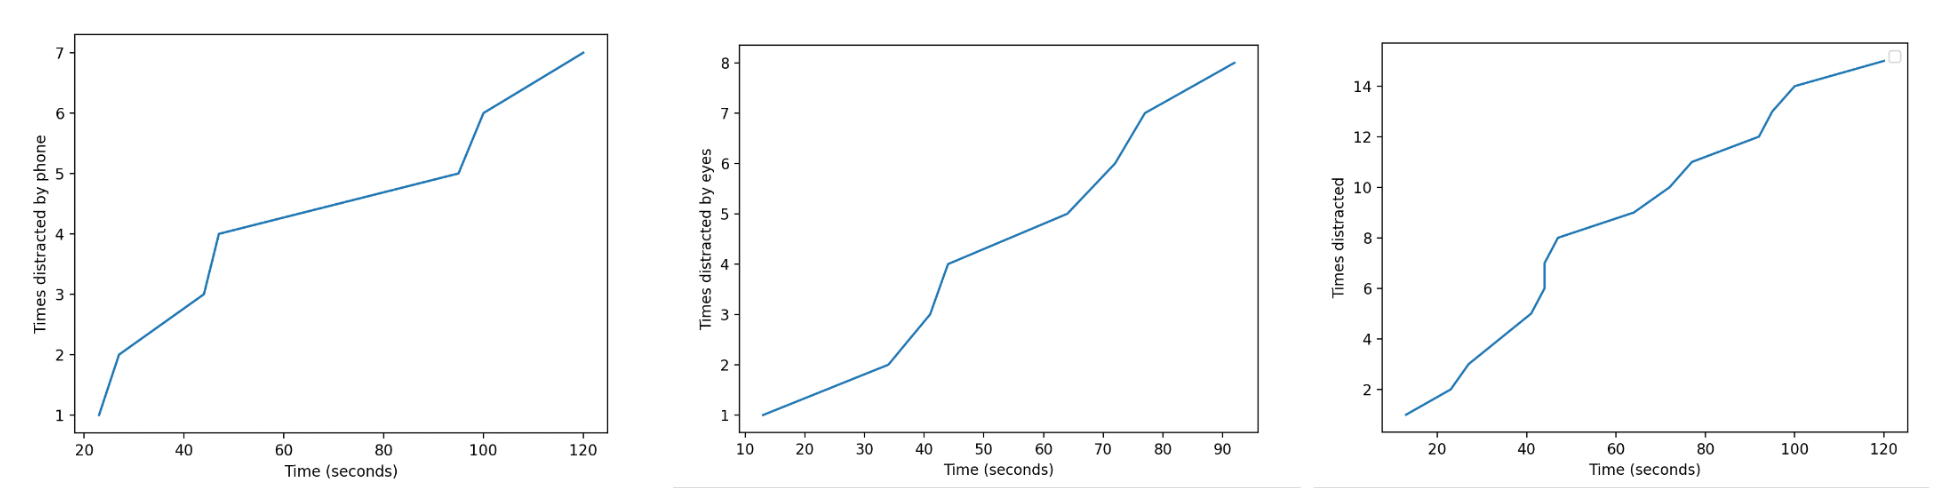
Plot Outputs on a Graph
In the last section, we utilize matplotlib’s graphing capabilities in order to plot three graphs:
- Overall times distracted
- Times distracted by phone
- Times distracted through gazing off
if x_point:

   x_point = [delta.seconds for delta in x_point]
   y_point.pop(0)

   plt.figure(1)
   plt.plot(x_point, y_point)
   plt.xlabel("Time (seconds)")
   plt.ylabel("Times distracted")
   plt.legend()

   if x_point_eyes:
       x_point_eyes = [delta.seconds for delta in x_point_eyes]
       y_point_eyes.pop(0)

       plt.figure(2)
       plt.plot(x_point_eyes, y_point_eyes)
       plt.xlabel("Time (seconds)")
       plt.ylabel("Times distracted by eyes")

   if x_point_phone:
       x_point_phone = [delta.seconds for delta in x_point_phone]
       y_point_phone.pop(0)

       plt.figure(3)
       plt.plot(x_point_phone, y_point_phone)
       plt.xlabel("Time (seconds)")
       plt.ylabel("Times distracted by phone")

   plt.show()
else:
   print("100% productive!")
To graph the chart of distractions, I first have to check if I was distracted at all. If so, it will get the x_points and y_points and plot the gradual increase in distraction overtime. Otherwise, it will print that I was not distracted a single time throughout the time period given. The other two graphs also have similar logic as if the list of x_point eyes / x_point phone was not empty, then it will graph a chart.
Conclusion
By using computer vision, we are able to build a real-time productivity tracker. In this example, we used object detection with logic to trigger notifications and send data for tracking. Using multiple libraries such as Matplotlib and Spotify, we are able to graph and add ways of strengthening productivity within our personal workspace. Overall, through the use of computer vision, we can successfully track how distracted we are within a period of time.
This same process can be applied to build any real-time tracking application.