
Heatmaps have a wide-ranging business impact, for industries of all shapes and sizes including retail, manufacturing, healthcare, logistics, and sports.
Retailers use them to analyze shopper behavior and optimize store layouts. Manufacturers deploy them to detect production inefficiencies by mapping worker or machine movement. In healthcare, they help monitor patient activity for safety and operational planning. Logistics firms optimize picker and forklift paths in warehouses, while sports teams analyze player coverage and strategy. In short: heatmaps turn movement into measurable insight.
Heatmaps are an intuitive way to visualize data, using color gradients to highlight areas of high activity or concentration. In computer vision, they’re especially useful for tracking movement - whether it’s a pet roaming an apartment or workers navigating a factory floor.
This guide walks you through building a computer vision-powered heatmap using Roboflow. We'll use the example of mapping my dog’s movement in my apartment - from collecting video data to generating the heatmap by sending data from the workflows directly into a custom Python script. Along the way, we’ll spotlight Roboflow’s powerful tools that make implementing vision systems easier than ever before and wrap up with real-world industry applications.
How to Create a Heatmap with Computer Vision Step-by-Step
1. Data Collection
To start, I needed data to track my dog’s movements. I set up a camera in my apartment to capture video footage of her wandering around - covering key spots like the living room, kitchen, and hallway. Roboflow makes this easy by allowing video uploads and automatically extracting frames for analysis. The goal was to gather enough footage to represent her movement patterns over time.
Key Tip: Position your camera to maximize coverage and ensure good lighting for accurate detection.
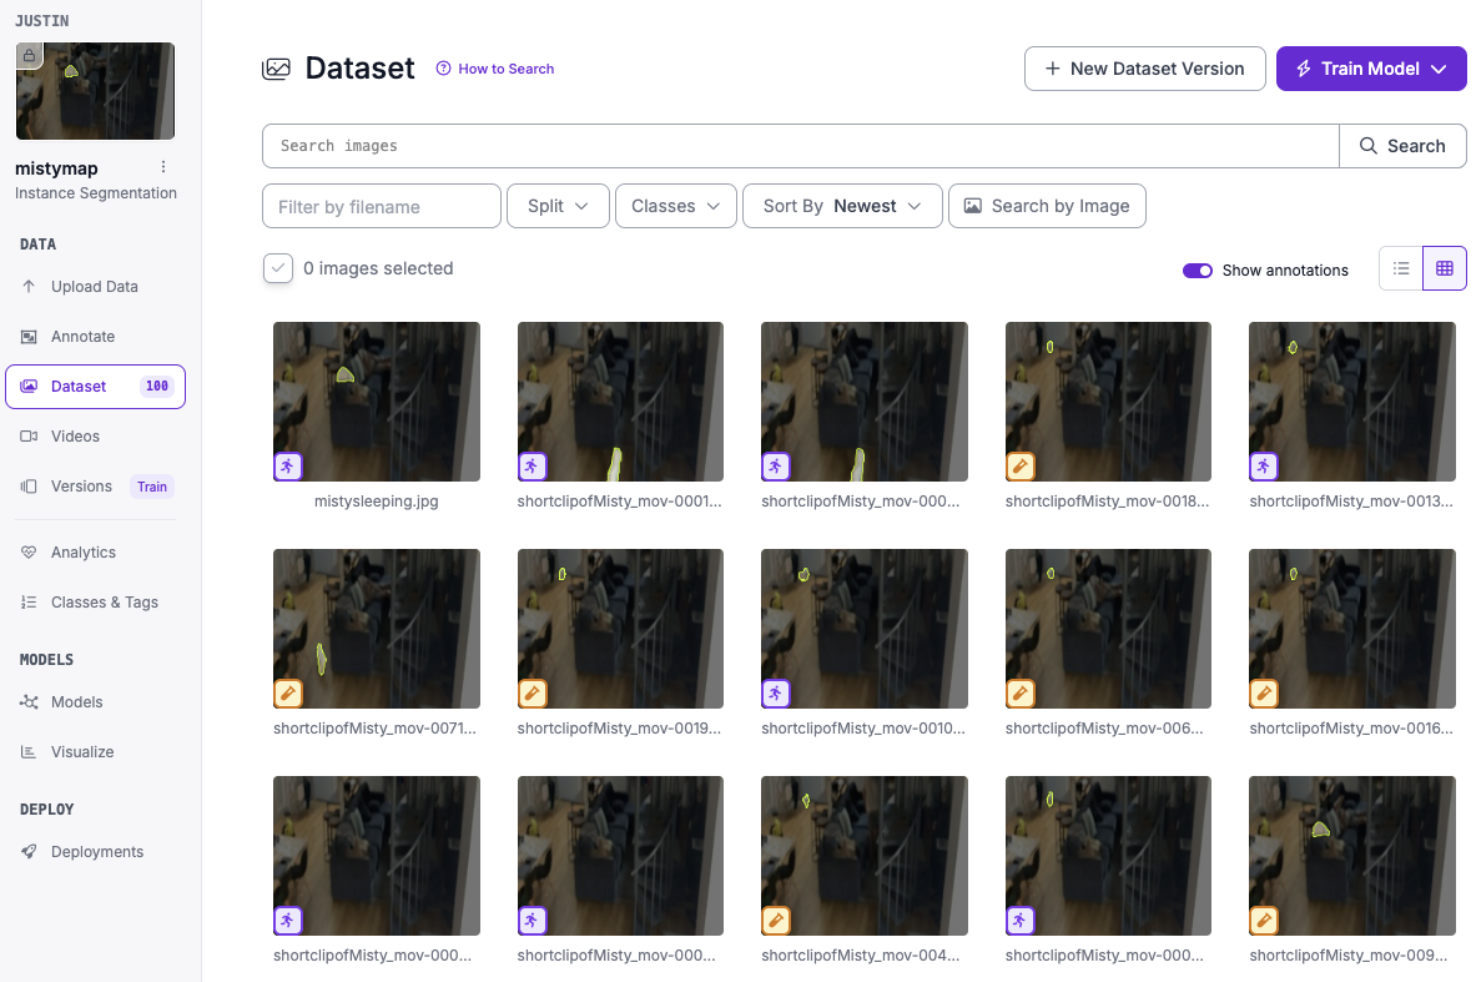
2. Labeling
With video frames in hand, I moved on to labeling. I opened each image in the annotation interface and began drawing bounding boxes around my dog to mark her location. The built-in AI-assisted labeling made things even easier, as shown below, after labeling a few frames, I got into a rhythm and got all the frames annotated in under 30 minutes. Frame by frame, the dataset came together efficiently, and the process felt more like ASMR than anything else.
Roboflow also supports instant segmentation tools like Segment Anything Model (SAM 2), which helps break down complex shapes faster than traditional bounding boxes. For cases where more precision is needed (e.g., crowded or cluttered frames), using SAM 2 can dramatically reduce manual work.
Best Practice: Be consistent with bounding box placement, and consider using segmentation when dealing with overlapping objects or tight environments.
3. Training with RF-DETR
Once labeling was complete, I trained an object detection model using Roboflow’s RF-DETR (Roboflow Detection Transformer). RF-DETR is a transformer-based model built for high-accuracy detection in dynamic, cluttered environments - perfect for tracking a fast-moving subject like a dog weaving through furniture.
To begin training, I simply selected RF-DETR from Roboflow’s model options, configured the dataset split (train/validation/test), and clicked “Train Model.” No need for hyperparameter tuning or complex setup - Roboflow abstracts that for you. What stood out was RF-DETR’s performance in handling occlusions and motion blur, maintaining high detection confidence even in tricky lighting or partially obstructed scenes. As seen in the GIF below.
Compared to other models I tested, RF-DETR required fewer labeled examples to generalize well and offered near real-time inference - critical if you want to deploy heatmaps on live video feeds.
Why RF-DETR? Its transformer backbone allows it to understand spatial relationships across the whole frame, making it extremely reliable for object permanence and edge-case detection.
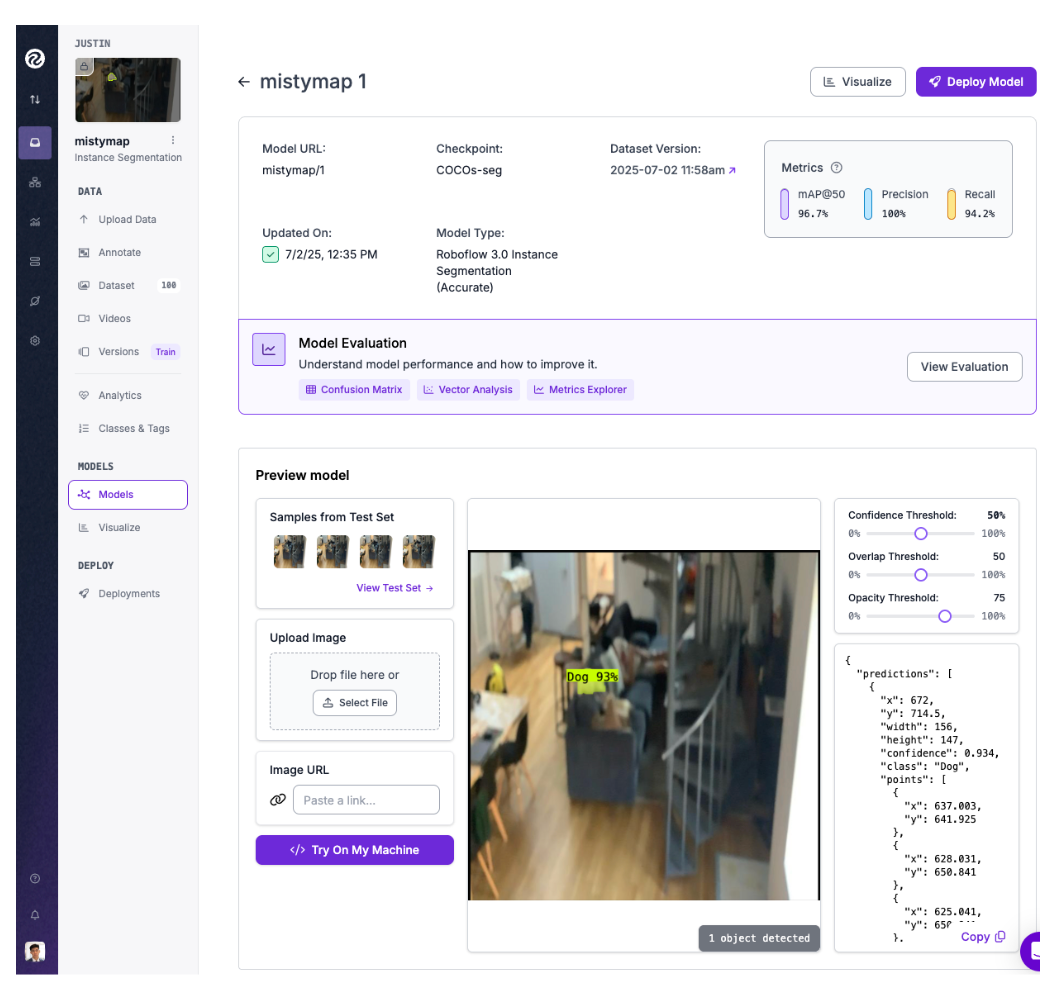
4. The Evaluation Loop
Training isn’t a one-and-done step - evaluation is where you refine the model. Roboflow’s evaluation loop let me test RF-DETR on a validation set and returned key metrics like precision, recall, and mean average precision (mAP). When I noticed it struggled with detections near the couch (where lighting was dim), I added more labeled frames from that area and retrained the model. Ultimately giving me the fine-tuned weights as seen in the image below.
This feedback loop - label, train, evaluate, improve - helped me incrementally improve model performance until I was satisfied with the results.
Pro Tip: Use Roboflow’s visual inspection tools to analyze missed detections and identify underrepresented regions in your dataset.
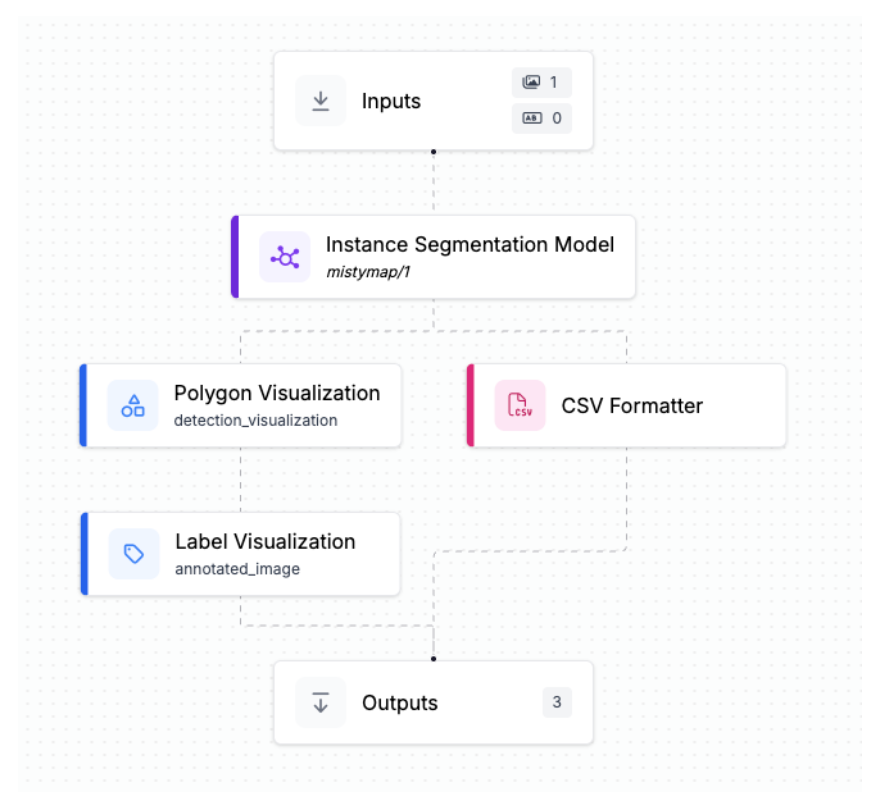
5. Deploying Through Workflows
With a solid model ready, I moved to deployment using Roboflow Workflows. Workflows are end-to-end pipelines that process incoming data, run inference, and output results in real-time. I set up my workflow to:
- Ingest live video or pre-recorded footage
- Run inference using the trained RF-DETR model
- Output bounding box coordinates and timestamps
This gave me a chronological log of (x, y) coordinates showing where my dog was at every moment - a perfect input for building the heatmap. Explore my workflow in-depth here.
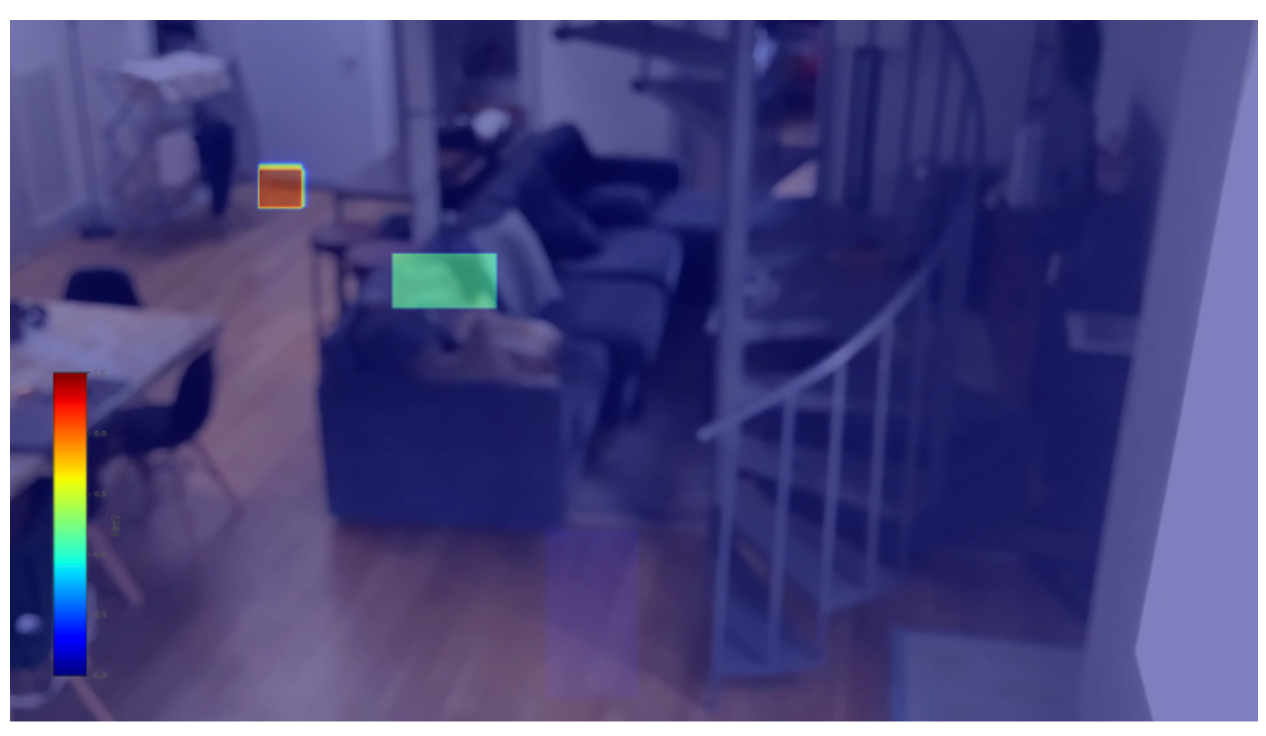
6. Creating the Heatmap with a Custom Python Script
With bounding box coordinates exported, I built a Python script to generate the heatmap. I one-shotted the script using an AI coding assistant, and within seconds, had a working solution. The script normalized the coordinates to fit my apartment layout and used a color gradient to plot a heatmap.
The logic was simple: count how often each location appeared in the log, smooth it out, and map it to a color scale. Warm colors showed where my dog spent the most time (like her napping corner), while cooler shades highlighted less-traveled zones.
Script Snapshot: Under 20 lines of code to go from raw detections to a polished heatmap.
Industry Use-Cases for Heatmaps Made with Computer Vision
While mapping my dog’s movement was a fun proof of concept, the real value of heatmaps lies in business. Here are some standout use cases across industries:
Retail
Customer behavior analysis
Use: CV tracks shoppers' movement using overhead cameras
Value: Identify high-traffic areas, improve product placement, and optimize layouts with A/B testing
Manufacturing & Warehousing
Workstation Time Tracking
Use: Analyze how long workers or robots spend in specific zones
Value: Reduce ergonomic strain, balance workloads, and streamline bottlenecks
Forklift & Picker Route Optimization
Use: Monitor movement paths and idle zones in warehouses
Value: Rearrange inventory placement and improve route planning for faster operations
Healthcare
Patient Safety Monitoring
Use: Track patients prone to wandering or falling
Value: Prevent accidents and alert staff in real time
Staff Movement Optimization
Use: Analyze nurse/doctor navigation patterns
Value: Optimize shifts, reduce unnecessary travel, and improve response times
Sports & Athlete Performance
Positional Heatmaps in Games
Use: Track player movement across the field
Value: Evaluate strategies, stamina, and space usage to improve gameplay
Build a Heatmap Using Computer Vision
Creating a heatmap with Roboflow is a straightforward but powerful workflow. From collecting raw video to building a custom Python visualization, each step added clarity and insight to my dog’s behavior. But the same process can be applied to real-world operations - tracking people, vehicles, robots, or equipment - to surface meaningful patterns and opportunities for optimization.
Roboflow’s tools, especially RF-DETR and Workflows, make this entire process accessible even for non-technical users. Whether you’re building a passion project or solving a business-critical challenge, turning vision into visibility has never been easier. Drive smarter decisions with computer vision: build your heatmap with Roboflow.
Cite this Post
Use the following entry to cite this post in your research:
Justin Kim. (Jul 17, 2025). How to Make a Heatmap with Computer Vision. Roboflow Blog: https://blog.roboflow.com/build-heatmaps-with-computer-vision/