
Efficient warehouse management depends on knowing which pallet bays are occupied and which are available. Overfilled or underutilized bays lead to wasted space, slower picking, and higher costs.
Automated vision systems can analyze images captured at regular intervals, providing real-time occupancy insights. Managers can optimize storage, plan replenishment, and prevent bottlenecks efficiently.
This tutorial demonstrates how to build a real-time warehouse capacity monitoring workflow using rack images, a vision–language model (VLM) for object detection of rack slots and pallets, and a second VLM for deterministic occupancy classification. By separating visual detection from structured reasoning, the workflow produces reliable, machine-readable outputs that can directly power dashboards, alerts, and warehouse management systems.
Real-Time Capacity Planning for Warehouse Racks
A reliable warehouse capacity monitoring workflow starts with a clear and representative baseline dataset. Reference images should include both empty and occupied rack slots and reflect realistic warehouse conditions, such as variable lighting, partial pallet placement, occlusions, and differing pallet sizes. These factors directly influence the accuracy of visual detection systems.
Establishing a Baseline Dataset
The dataset should clearly expose rack structure and pallet geometry so that rack slots and pallets can be detected as distinct objects. Accurate occupancy classification depends on the spatial relationship between these detected elements, making visual clarity and consistency more important than exhaustive manual labeling.
The dataset used in this tutorial is rack space, which focuses on warehouse racking environments and provides images well-suited for slot- and pallet-level detection. Its visual structure makes it appropriate for demonstrating an occupancy inspection workflow based on object detection and spatial reasoning.
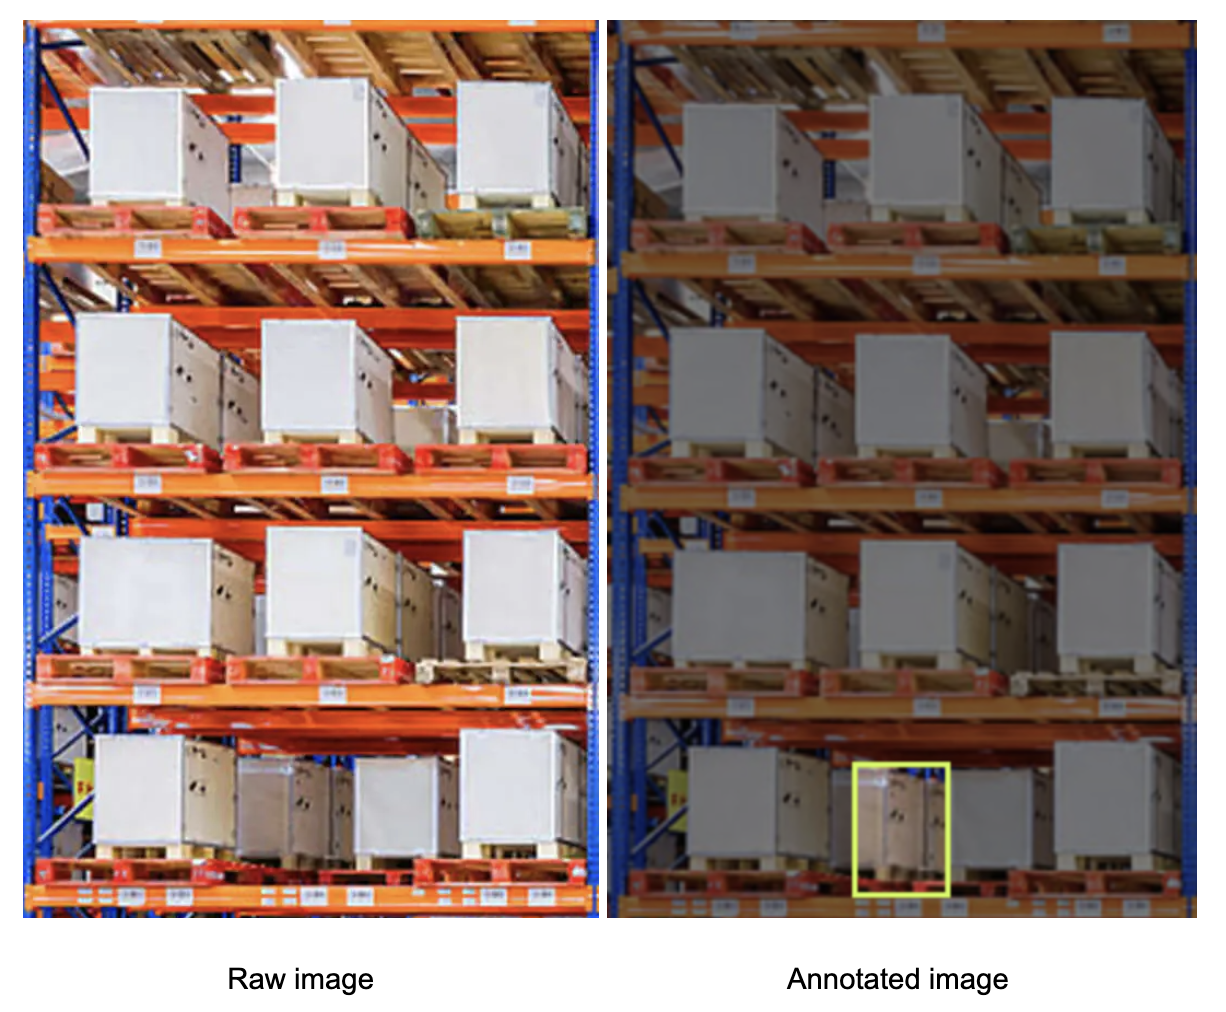
For demonstration purposes, the tutorial uses a single test image containing one empty rack slot, with all remaining slots occupied. The image is a single bay cropped from an image in the dataset, reflecting the workflow’s design to process one bay at a time.
Build the Real-Time Capacity Monitoring Workflow
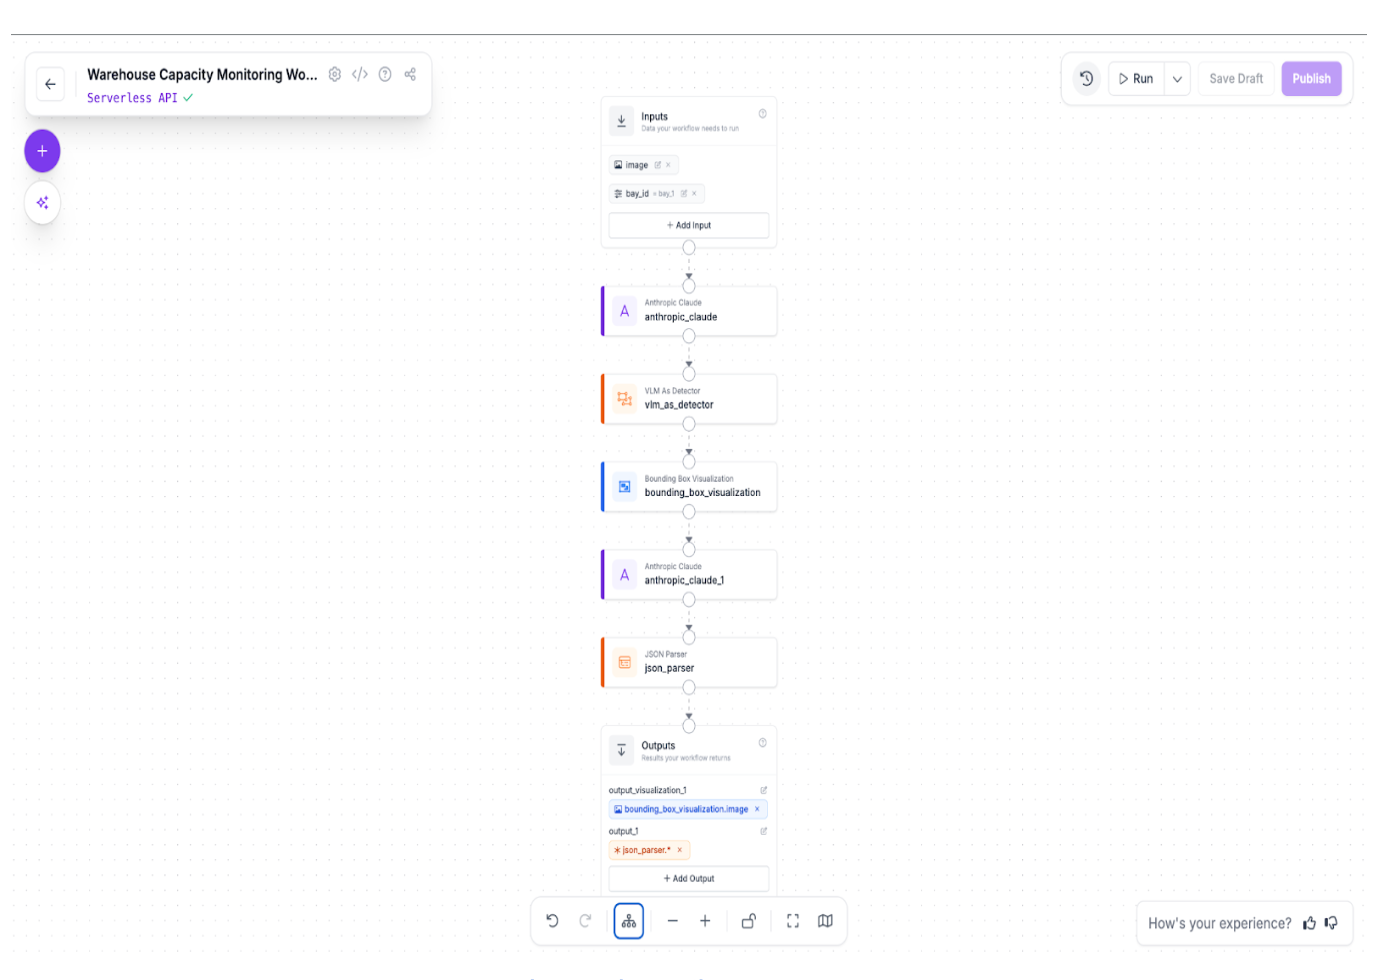
Here is the workflow we'll create. This Roboflow Workflow translates visual rack state into structured, system-ready capacity data. It is designed to operate on periodic image snapshots captured at defined intervals, enabling consistent and repeatable capacity assessments without requiring continuous video streams or real-time sensor feeds.
Step 1: Provide structured inputs
Each workflow run is initialized with two inputs:
- bay_id: a string identifier for the rack bay being inspected
- image: the raw image of the rack bay
Step 2: Configure the Object Detection VLM Block
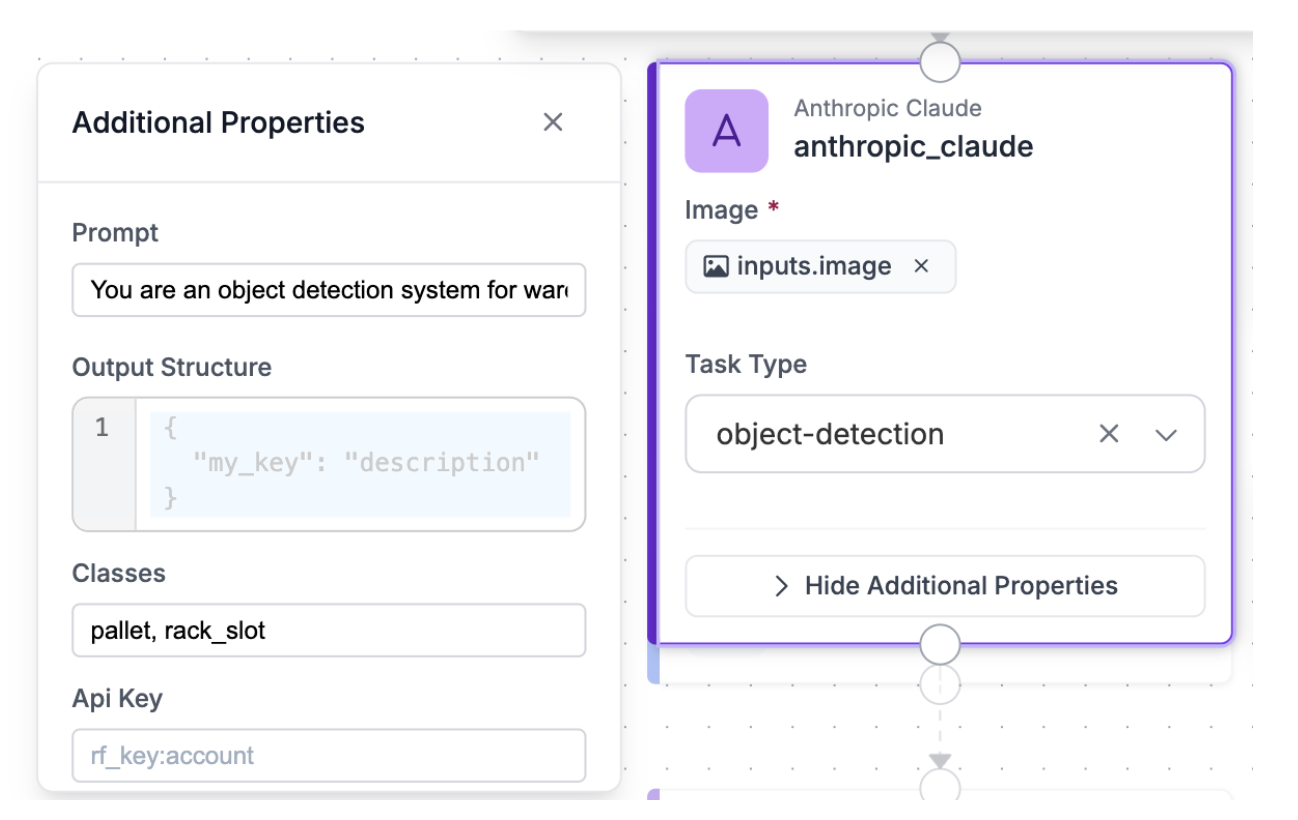
At the core of the workflow, an Anthropic Claude VLM block performs object detection on the warehouse rack image. This block is responsible for identifying and localizing all relevant physical entities in the scene, specifically rack slots and pallets. The task type for this block is set to object detection, allowing the model to return bounding boxes and class labels for each detected object.
Claude Sonnet 4.5 was selected for this step due to its strong visual reasoning capabilities and reliability in structured visual tasks. It performs well in environments with repetitive industrial layouts, such as warehouse racking, where precise spatial understanding is required. Rather than inferring occupancy directly, the model focuses solely on accurately detecting the presence and location of rack slots and pallets.
The output of this block is a raw detection response describing all identified objects and their bounding boxes. By separating detection from reasoning, the workflow reduces ambiguity, improves robustness, and ensures that downstream logic operates on an explicit, model-derived representation of the rack structure. This design choice lays a stable foundation for consistent occupancy classification in later steps.
Prompt used:
You are an object detection system for warehouse racks. Detect and localize every rack_slot visible in the image, including both occupied and empty slots. A rack_slot is a fixed rectangular storage space defined by the rack beams and uprights, and it must be detected even if it contains no pallet, box, or object. Do not skip empty slots. Empty rack slots often appear as open rectangular gaps or shelves with visible background and no items; these are still valid rack_slot objects and must be detected. Also detect pallets separately. The absence of a pallet inside a rack_slot does not mean the rack_slot should be ignored. Prioritize complete coverage of the rack structure and ensure that every visible slot position is detected exactly once, regardless of occupancy.
Step 3: Configure the VLM as Detector Block
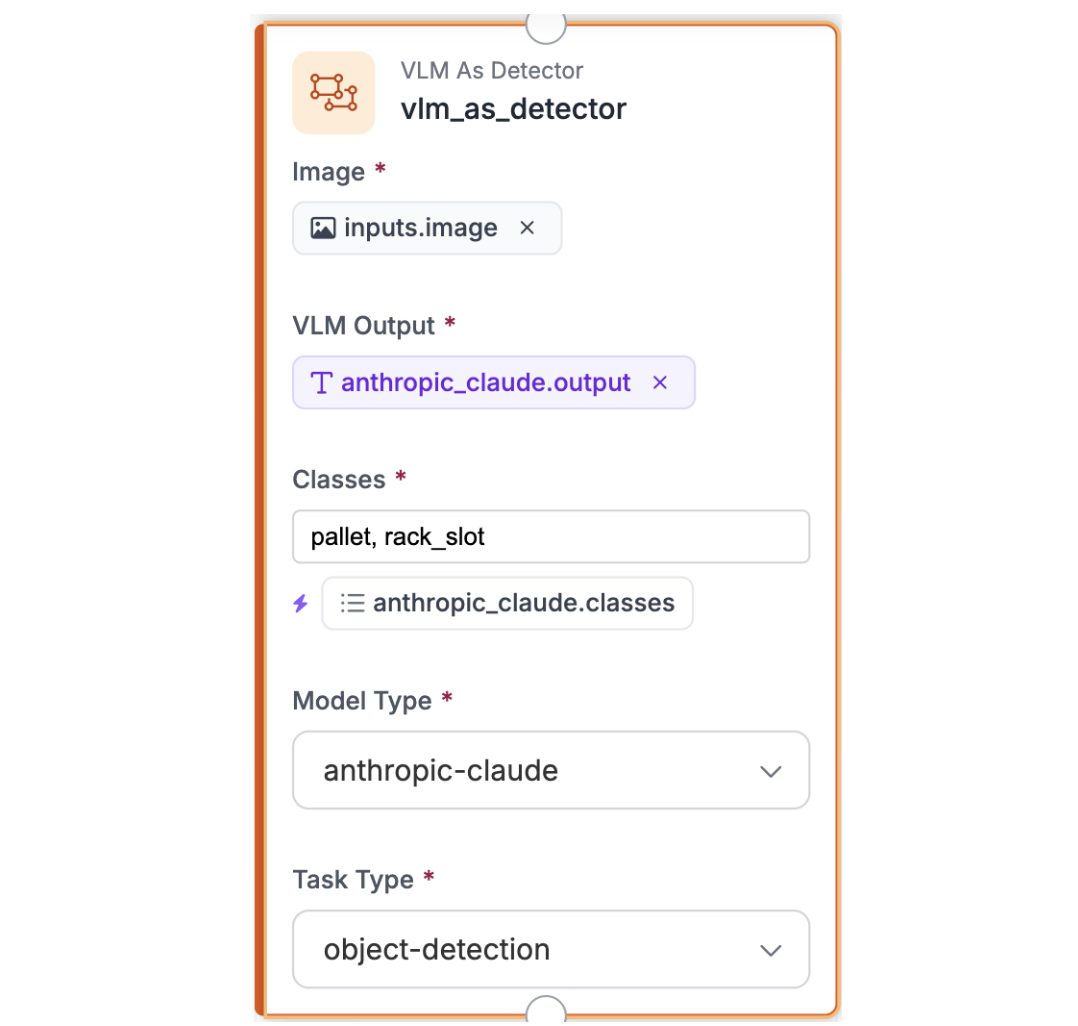
The VLM as Detector block converts the raw, unstructured output from the Claude Sonnet 4.5 object detection step into a normalized detection format. It extracts class labels and bounding box coordinates for rack slots and pallets, producing a clean, machine-readable representation that can be reliably consumed by downstream blocks. This ensures consistent object definitions and removes any ambiguity from the VLM’s raw response before visualization and occupancy reasoning.
Step 4: Configure the Bounding Box Visualization Block
The Bounding Box Visualization block takes the raw rack image together with the parsed predictions from the VLM as Detector block and overlays the detected bounding boxes on the image. This provides a visual sanity check of rack slot and pallet detections, making it easy to verify spatial alignment and detection coverage before proceeding to occupancy classification.
Step 5: Configure the Reasoning VLM Block
In this step, a second VLM block performs the reasoning layer of the workflow. It takes the bounding box visualization image as input, which visually encodes the detected rack slots and pallets, and also receives the structured detection results via the detector predictions referenced in the prompt and output structure using the syntax `$steps.vlm_as_detector.predictions`. Using structured answering, the model combines visual context with these authoritative detection signals to assign an occupancy status to each rack slot based on the presence or absence of a pallet, producing a clean, deterministic JSON output suitable for downstream parsing and integration.
Prompt used:
You are a warehouse capacity inspection system. You are provided with two inputs: the raw rack image ($inputs.image) and object detection predictions ($steps.vlm_as_detector.predictions) that describe the locations, bounding boxes, and classes of detected rack slots and pallets within the image. Treat the detector predictions as the authoritative source for all rack slots and pallets present; do not invent, infer, or omit any slots beyond those listed in the predictions. For each detected rack slot, determine its occupancy using the following rule: compute the center point of each detected pallet’s bounding box, and mark a rack slot as occupied only if at least one pallet’s center point lies strictly within the rack slot’s bounding box. Ignore minor or incidental bounding-box overlaps caused by detector noise or edge contact. If no pallet center point falls within a rack slot, mark that slot as empty. Use the provided bay identifier ($inputs.bay_id) as the bay_id in the output. Include every detected rack slot exactly once in the output, assign each a stable slot_id derived from the detector output, and return ONLY valid JSON that conforms exactly to the specified output schema. Do not include explanations, confidence scores, or any text outside the JSON.
Output structure used:
{
  "output_schema": "{\"type\":\"object\",\"properties\":{\"bay_id\":{\"type\":\"string\",\"description\":\"Identifier for the warehouse bay being inspected\"},\"slots\":{\"type\":\"array\",\"items\":{\"type\":\"object\",\"properties\":{\"slot_id\":{\"type\":\"string\",\"description\":\"Identifier for the rack slot within the bay\"},\"occupancy\":{\"type\":\"string\",\"enum\":[\"occupied\",\"empty\"],\"description\":\"Occupancy status of the slot: 'occupied' if a pallet is present, 'empty' if it is vacant\"}},\"required\":[\"slot_id\",\"occupancy\"]}},\"required\":[\"bay_id\",\"slots\"]}",

  "instructions": "You are a warehouse capacity inspection system. You are provided with two inputs: the raw rack image ($inputs.image) and object detection predictions ($steps.vlm_as_detector.predictions) that describe the locations, bounding boxes, and classes of detected rack slots and pallets within the image. Treat the detector predictions as the authoritative source for all rack slots and pallets present; do not invent, infer, or omit any slots beyond those listed in the predictions. For each detected rack slot, determine its occupancy using the following rule: compute the center point of each detected pallet’s bounding box, and mark a rack slot as occupied only if at least one pallet’s center point lies strictly within the rack slot’s bounding box. Ignore minor or incidental bounding-box overlaps caused by detector noise or edge contact. If no pallet center point falls within a rack slot, mark that slot as empty. Use the provided bay identifier ($inputs.bay_id) as the bay_id in the output. Include every detected rack slot exactly once in the output, assign each a stable slot_id derived from the detector output, and return ONLY valid JSON that conforms exactly to the specified output schema. Do not include explanations, confidence scores, or any text outside the JSON."
}
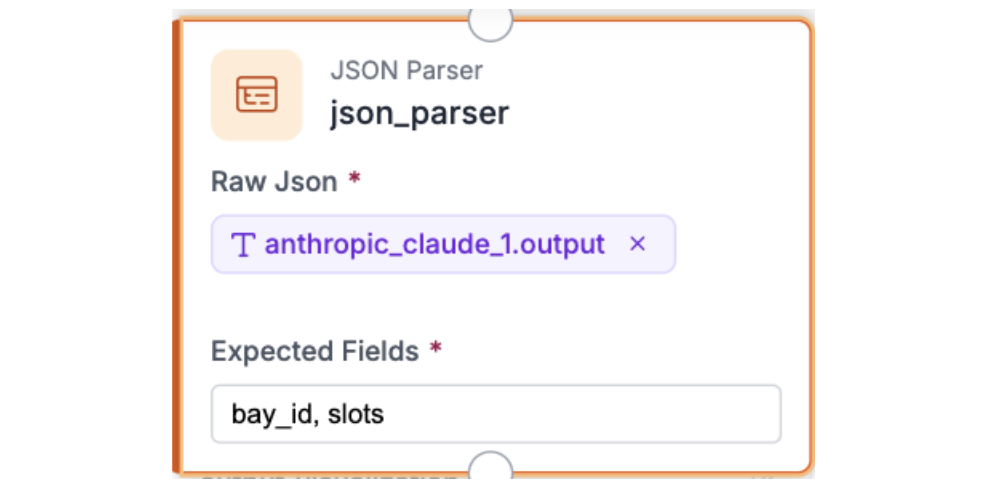
Step 6: Parse the Output with JSON Parser
Once the Claude block returns its structured response, a JSON Parser block is used to extract and normalize the relevant fields. This step ensures that each required value is cleanly separated and ready for use in subsequent workflow stages.
Expected fields
In the JSON Parser configuration, define the fields to extract: bay_id, slots
Each field is exposed as an independent output that downstream steps can reference directly. This makes it straightforward to log results, trigger alerts, or apply conditional logic based on inspection outcomes.
By parsing the model output into well-defined fields, this step converts the Claude response into reliable, reusable data that can be easily integrated with dashboards, operational systems, or automated reporting pipelines.
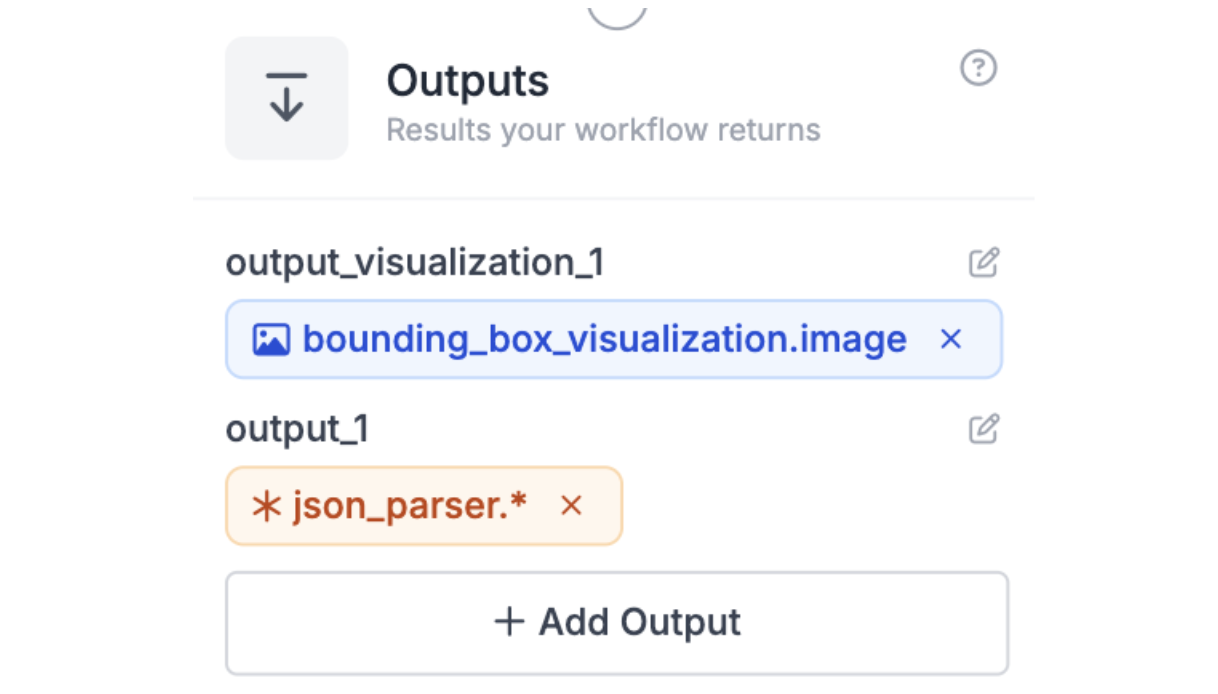
Step 7: Output Block
The workflow concludes with an Output block that exposes the processed results. It receives the bounding box visualization image and the parsed JSON from the JSON Parser block, making both the visual inspection and structured occupancy data available for downstream use or review.
Step 8: Test the Workflow
With all inputs and blocks configured, the workflow is ready for testing. Run the sample image along with a sample bay ID, such as “bay_1,” through the pipeline to verify correct operation. During testing, confirm that:
- The bounding box visualization accurately labels all pallets and rack slots.
- The `bay_id` in the output matches the input identifier.
- Each rack slot is correctly classified as `occupied` or `empty`.
- The JSON output fully conforms to the schema, with no missing fields.
This step validates that the workflow consistently converts raw images into reliable, structured occupancy data while providing a visual representation for easy verification.
Below is the output you should get - the bounding box visualization:
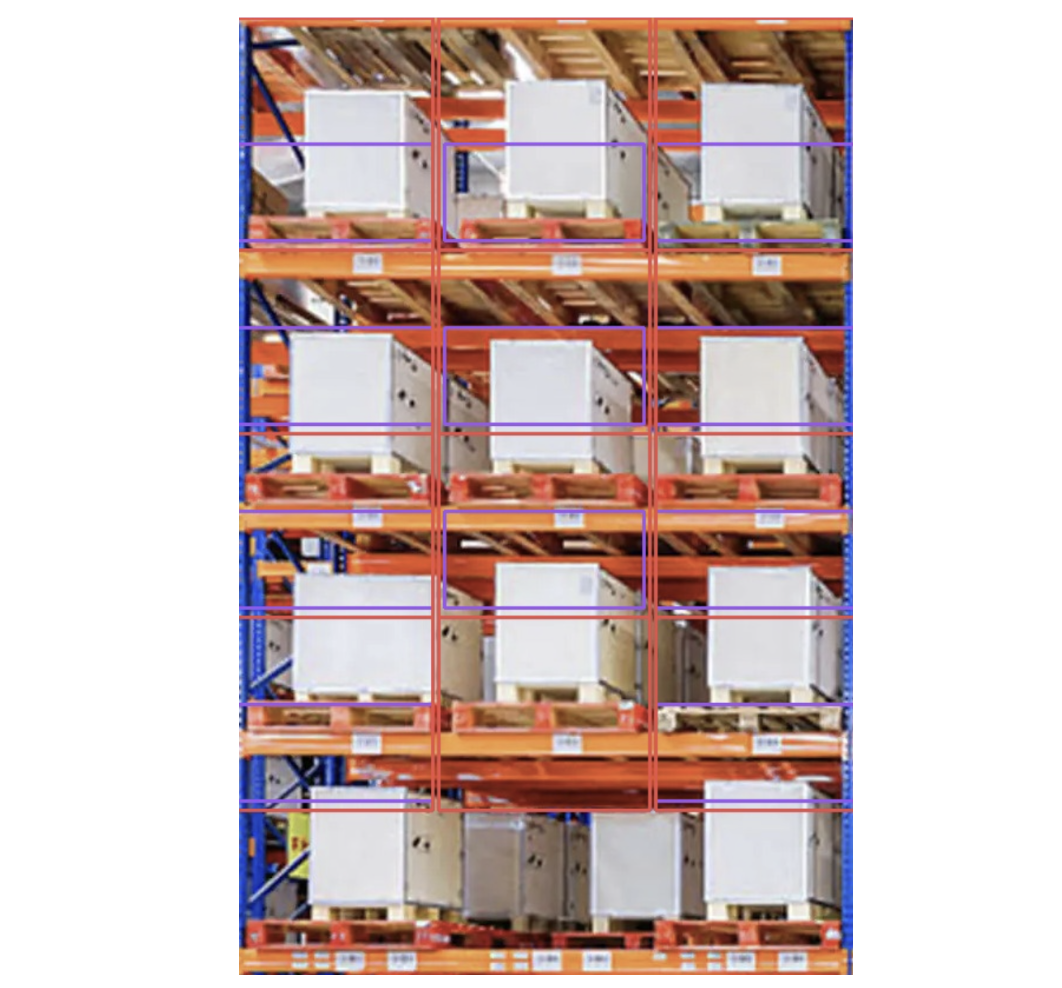
The bounding boxes are slightly misaligned but semantically correct. Purple boxes represent the pallet class and correctly total 11 detections, while red boxes represent the rack_slot class with 12 detections. The bottom-row middle slot contains no pallet yet is still detected as a rack slot, which is the expected and correct behavior for this test image.
The structured occupancy classification:
[
  {
    "output_1": {
      "bay_id": "BAY-001",
      "slots": [
        { "slot_id": "slot_1", "occupancy": "occupied" },
        { "slot_id": "slot_2", "occupancy": "occupied" },
        { "slot_id": "slot_3", "occupancy": "occupied" },
        { "slot_id": "slot_4", "occupancy": "occupied" },
        { "slot_id": "slot_5", "occupancy": "occupied" },
        { "slot_id": "slot_6", "occupancy": "occupied" },
        { "slot_id": "slot_7", "occupancy": "occupied" },
        { "slot_id": "slot_8", "occupancy": "occupied" },
        { "slot_id": "slot_9", "occupancy": "occupied" },
        { "slot_id": "slot_10", "occupancy": "occupied" },
        { "slot_id": "slot_11", "occupancy": "empty" },
        { "slot_id": "slot_12", "occupancy": "occupied" }
      ],
      "error_status": false
    }
  }
]
Scaling and Production Considerations
Once a single bay workflow is validated, the next step is ensuring the system can scale across multiple racks, cameras, or sensor inputs without losing performance or reliability. In a typical warehouse, dozens or even hundreds of pallet bays may need to be monitored simultaneously. To handle this, the workflow can be duplicated or parameterized for each bay while maintaining a centralized process for ingestion, processing, and logging.
Edge cases also become more common at scale. Partially filled bays, misaligned pallets, or obstructed camera views can introduce ambiguities in occupancy status. By defining clear rules, such as treating partially visible slots as “occupied” until verified, the system maintains consistency and avoids false alarms.
Integration with operational dashboards, automated reporting pipelines, and alerting systems becomes critical when scaling. Structured JSON outputs can feed real-time dashboards showing bay utilization, enable predictive capacity planning, and trigger notifications for restocking or reorganization. For large warehouses, batch processing periodic snapshots or using asynchronous processing ensures the system remains responsive.
Finally, workflows should support incremental updates, allowing new racks, camera positions, or annotation improvements to be added without rebuilding the entire system, ensuring long-term maintainability and operational flexibility.
Real-Time Capacity Planning for Warehouse Rack and Pallet-Bay Occupancy Conclusion
Automated monitoring of warehouse rack occupancy can significantly improve space utilization, operational efficiency, and inventory management. Overall, this tutorial highlights how modern visual language models can enable near real-time warehouse capacity monitoring, empowering managers with precise, data-driven insights to optimize workflows and maximize operational efficiency.
Further reading
Below are a few related topics you might be interested in:
Cite this Post
Use the following entry to cite this post in your research:
Contributing Writer. (Jan 29, 2026). Real-Time Capacity Planning for Warehouse Rack Occupancy. Roboflow Blog: https://blog.roboflow.com/capacity-planning-for-warehouse-racks/