
Cycle time drives throughput, cost, and delivery reliability in manufacturing, but most teams still measure it with stopwatches, averages, and gut feel. When it slips, the instinct is to push people harder or add labor, even though the real losses come from waiting, handoffs, rework, and variability that traditional tools never see.
Cycle time isn’t a labor problem. It’s a data problem. In this article, you'll learn how computer vision measures cycle time continuously from the physical process, exposes hidden delays in real time, and turns cycle time from a guessed metric into a live operational signal you can act on.
Here's What Cycle Time Actually Measures
Cycle time is often mixed up with takt time and throughput, and that confusion leads teams to fix the wrong problems.
- Cycle time is how long a single item takes to move through a process from start to finish. If a box arrives at a station at 10:00 and leaves at 10:02, its cycle time is two minutes, and that includes not just work, but waiting, movement, inspection, and any rework along the way.
- Takt time is a target, not a measurement. It tells you how fast you should produce to meet demand, not how long items actually take.
- Throughput tells you how many items you complete over time, but it averages away what happens to individual units. A line can hit its throughput target while some items still get stuck waiting or looping through rework.
That’s why cycle time matters. It measures real behavior at the item level and exposes delays that averages hide. In short: takt time sets the pace, throughput counts output, and cycle time reveals the truth about how work actually flows through your process.
Where Is Cycle Time Really Lost?
Most cycle time is not lost while work is being done. It is lost between steps, when items are waiting instead of moving. The main reasons cycle time increases are:
- Waiting: Items often wait for machines, workers, materials, inspections, or approvals. During this time, no work is happening, but time keeps passing. This waiting usually makes up the largest part of cycle time.
- Handoffs: Every time an item moves from one station, person, or system to another, it can be delayed. Even small delays add up when they happen again and again throughout the day.
- Rework: If an item has a defect or mistake, it may need to be fixed and sent back through the process. This adds extra steps, extra waiting, and extra time.
- Small stops: Short pauses like adjusting a part, fixing a minor jam, or looking for a tool may only take a few seconds. But across many items and many stations, these small stops add up to a lot of lost time.
All of these delays happen between actions, not during the main work itself. Because they are small and frequent, they are easy to miss and hard to measure with manual tracking. Yet together, they are the biggest reason cycle time becomes long and unpredictable.
Why Manual Studies and Sensors Miss Variability
Most factories measure cycle time in two ways: manual time studies or fixed sensors. Both provide signals, but neither shows the full picture.
Manual time studies capture a short, supervised snapshot. When someone is watching, behavior improves, problems get fixed quickly, and the data reflects best-case performance. The results are then averaged, which hides variability. A five-minute “average” cycle time might mean every item takes five minutes, or that most take three while a few take ten. Those are very different problems, but the report looks the same.
Sensors and PLCs automate data collection, but they only log events at fixed points. They can tell you when a part arrived and when it left, but not how long it waited, how long it was worked on, or why delays happened in between. Adding more sensors helps, but it’s expensive and still leaves blind spots.
Both approaches rely on sampling and averages. Cycle time issues don’t come from averages: they come from variability that changes by shift, product, workload, or condition. If you can’t see that variability, you can’t fix it, which is why cycle time targets are often missed even when people are working hard and machines look busy.
How Computer Vision Measures Cycle Time Continuously
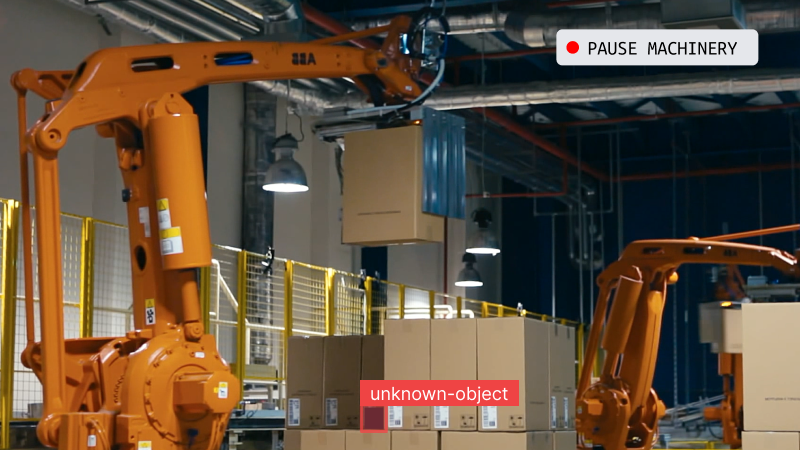
Computer vision can be used to measures cycle time in a very different way. Instead of watching people or adding sensors to machines, it watches the process itself, all the time. A camera looks at the work area and records what is happening. CV models then analyzes the video to understand when items arrive, when work starts, when delays happen, and when items leave.
In simple terms, a vision system does four things:
- It sees when an item enters a work area
- It follows that same item as it moves
- It sees when the item leaves
- It records the time for each step
The cycle time is simply the time between entry and exit for that item. Nothing needs to be guessed or assumed.
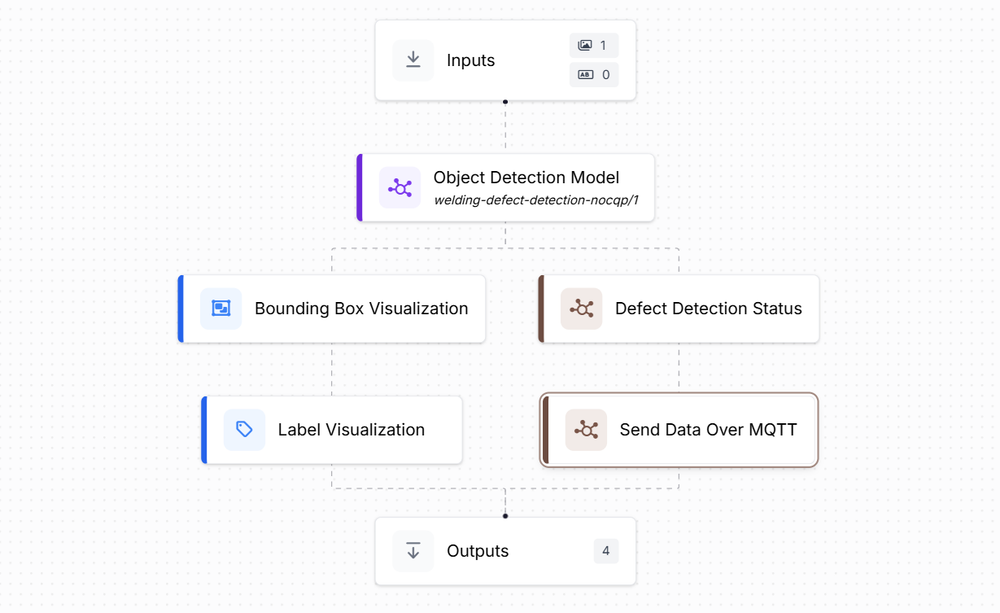
Seeing what is happening: Computer vision models are trained to recognize important things in the workspace, such as:
- parts or products,
- whether a station is busy or idle,
- whether an operator is working or waiting,
- whether an item is positioned correctly or needs fixing.
These checks happen many times every second. This means the system is always measuring, not just during a study or inspection.
Learn more about how to build a computer vision inspection system in our blogs:
Following each item: The system does not just see items, it tracks them. If several parts are moving at once, the system knows which one is which and follows each one from start to finish. This makes it possible to know:
- how long an item waited,
- how long it was worked on,
- how long it spent moving,
- and whether it went through rework.
Each item gets its own timeline.
Object tracking and counting
Learn more about how to track objects using computer vision in our blogs:
Measuring by zones: To turn movement into cycle time, the workspace is divided into simple zones, such as:
- input area,
- work station,
- inspection area,
- output area.
When an item enters a zone, a timer starts. When it leaves, the timer stops. By doing this, the system can measure:
- total cycle time,
- waiting time,
- processing time,
- inspection time,
- and rework time.
The camera sees everything. The zones decide what gets measured.
Tracking object time in zone
Read more about monitoring objects in zone:
Finding patterns over time: Because the system measures every item, all day, it becomes easy to spot patterns:
- longer cycle times on certain shifts,
- delays for specific products,
- differences between operators,
- changes after maintenance or layout updates.
Instead of averages, you see the full range of behavior.
Improving over time: At first, the system may make small mistakes. But these mistakes can be fixed. When wrong results are reviewed and corrected, the model learns from them. New examples can be added, and the model can be retrained to handle changes in lighting, camera angles, products, or layouts. With active learning, the system automatically highlights unclear cases so they can be reviewed first. Over time, the system becomes more accurate and better matches real factory conditions, without changing how people work.
Active learning workflow to improve model
Learn more about active learning to improve models:
Computer vision turns cycle time measurement into complete, continuous data. Every item is measured, and every delay is visible. This makes cycle time reliable instead of estimated and helps teams clearly see where time is truly being lost.
Turning Timestamps into Bottleneck Insights
Raw cycle time data on its own is not very helpful. Just having a list of timestamps does not explain much. The data becomes useful only when it shows where time is being lost and why.
For example, knowing that a part took 15 minutes to finish is not enough. But if the data shows that the part spent 10 of those minutes waiting and only 5 minutes being worked on, then you know exactly where the problem is. The goal is not to know that a station took 10 minutes on average. The goal is to know:
- which station is slowing the whole process,
- whether the delay comes from working or waiting,
- and when those delays happen most often.
Finding bottlenecks by station: In any process with multiple steps, one station usually limits the overall flow. This station is the bottleneck. By comparing cycle time across stations, it becomes easy to see where this bottleneck is. The station with the longest cycle time often deserves attention first. But averages alone are not enough.
Looking at the spread of cycle times matters just as much. A station that is slow but consistent may cause fewer problems than a station that is fast sometimes and very slow at other times. High variation creates queues, delays, and instability.
Cycle time data also helps explain why a station looks slow. A station may show long cycle times simply because parts arrive late, not because the station itself is inefficient. In that case, the real problem is upstream.
Understanding differences by product (SKU): When many products run through the same process, averages hide important details. One product may move smoothly, while another regularly causes delays. By breaking cycle time down by product, teams can see:
- which products take longer,
- where those delays happen,
- and whether they come from setup changes, transport distance, or rework.
This makes improvement focused and practical. Instead of changing the whole line, teams can fix problems for specific products where it matters most.
Comparing shifts and teams: Cycle time often changes across shifts. One shift may be faster because operators are more experienced. Another may slow down due to staffing, supervision, or equipment condition. By looking at cycle time by shift, teams can see:
- where training is needed,
- where processes drift,
- and whether equipment performance changes over time.
This comparison shows whether problems are limited to certain stations or affect the whole process.
The real value is not the amount of data collected. It is the visibility the data provides. When cycle time is measured in detail and updated continuously:
- supervisors can spot bottlenecks as they shift,
- engineers can test improvements and see results quickly,
- maintenance teams can catch issues before failures,
- operators can understand how their work affects flow.
Cycle time stops being a report and becomes a tool. This level of insight is only possible when measurement is continuous, detailed, and reliable which is exactly what computer vision enables.
Why Vision Pipelines Are Better Than One-Off Automation
Many early computer vision systems are built as small, isolated solutions. For example, one script detects an object, another counts items, and another triggers an alert. These setups may work at first, but they are fragile. When the process changes or a new requirement is added, the system often breaks or needs to be rewritten.
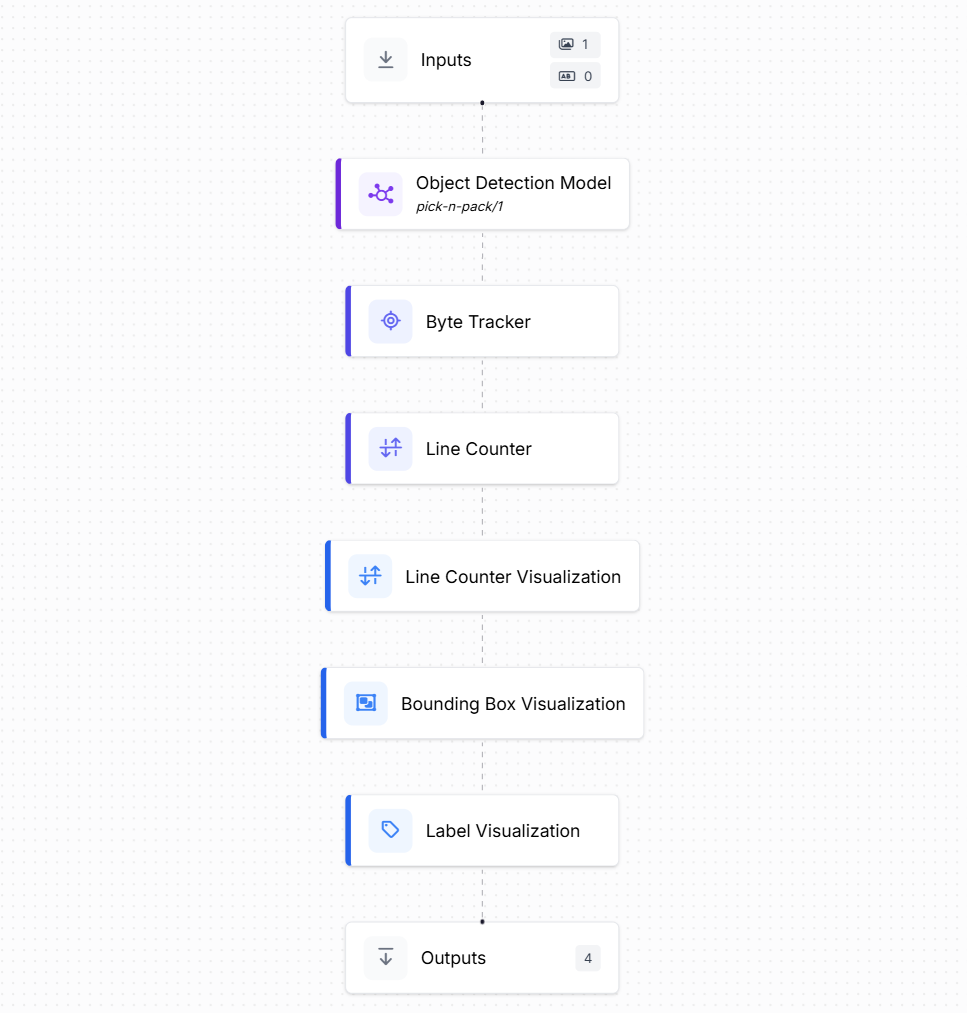
A vision pipeline takes a better approach. Instead of solving one small task, it treats vision as part of the full process. It connects detection, tracking, decision rules, and deployment into one continuous workflow.
For example, in a typical machine vision application, a camera can:
- detect different product types,
- track each product as it moves,
- count how many units pass through,
- and measure how long each unit takes.
Once this pipeline is in place, it can be easily extended. The same system that counts products can also include another model to detect defects, check alignment, or identify missing components. You are not starting from scratch each time, you are building on the same pipeline.
What makes a vision pipeline effective: A good vision pipeline usually includes:
- Detection to identify products, parts, or defects
- Tracking to follow each item over time
- Logic to decide when an item enters, exits, waits, or goes through rework
- Edge deployment so the system runs close to the process with low delay
All these steps work together as one system instead of separate scripts. This is where tools like Roboflow Workflows fit naturally. Instead of writing custom code for every new use case, teams can define the workflow visually and adjust it as the process changes. This makes the system easier to maintain and scale in real production environments.
See the example in our blog post Machine Vision in Manufacturing to learn how you can use Roboflow Workflows to build an entire vision pipeline easily.
Why edge deployment matters: Running vision pipelines at the edge is especially important for cycle time measurement. Decisions need to be fast, reliable, and always available. If results arrive late or stop when the network goes down, the data loses value. By running locally:
- delays are measured in real time,
- data stays private,
- and the system keeps working even if connectivity drops.
This makes vision pipelines dependable enough for daily operations, not just experiments. Learn more how you can deploy Roboflow Workflows on the Edge:
Reframing Cycle Time as an Observability Problem
Traditional approaches treat cycle time as something to be estimated. Computer vision treats it as something to be observed. This reframing has practical consequences:
- Improvements target waiting and handoffs, not just labor speed.
- Variability is measured and managed, not ignored.
- Bottlenecks are identified under specific conditions, not assumed to be fixed.
- Continuous measurement replaces periodic studies.
Computer vision does not replace lean principles or industrial engineering. It provides the missing instrumentation that those disciplines have long needed.
Practical Considerations for Deployment
Successful computer vision deployment requires care.
- Camera placement should prioritize visibility of transitions, not aesthetics.
- Lighting and occlusion must be considered, especially in industrial environments.
- Models should be evaluated for consistency over time, not just initial accuracy.
- Logic should be versioned and tested as processes evolve.
How to Improve Cycle Time with Computer Vision Conclusion
Cycle time is a visibility problem. When you can see every item move through the process, continuously and in real time, waiting, handoffs, and rework stop hiding behind averages and assumptions. Computer vision turns cycle time from a lagging report into a live operational signal you can act on.
Get started with Roboflow Workflows today, to move from measuring delays to systematically eliminating them, one bottleneck at a time. Or speak with an AI expert for help with your unique use cases.
Cite this Post
Use the following entry to cite this post in your research:
Timothy M. (Jan 7, 2026). How to Improve Cycle Time with Computer Vision. Roboflow Blog: https://blog.roboflow.com/cycle-time-with-computer-vision/