
Image segmentation models like SAM 2 and YOLOv8 Segmentation return masks. These masks can be processed in various ways according to your project: you can filter masks by area, trigger logic based on the presence or absence of predictions, and more.
Before you build applications with vision models, it is helpful to visualize model predictions. This will help you develop a better understanding of how your model is behaving.
Using the Roboflow supervision Python package, you can draw segmentation masks returned by a variety of computer vision models onto images. In this guide, we will show how to draw segmentation masks with supervision.
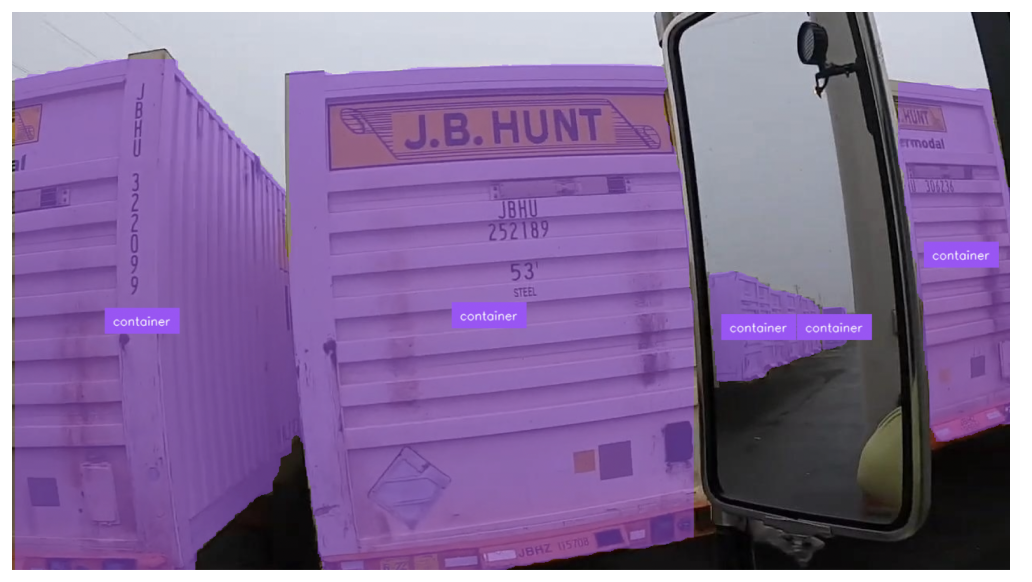
Here is an example of our annotator in use:
Without further ado, let’s get started!
How to Draw Segmentation Masks with Python
To draw segmentation masks, we are going to use the supervision Python package. Supervision comes with a suite of annotators that allow you to plot predictions from various model types, from object detection to segmentation.
To get started, first install supervision:
pip install supervisionStep #1: Load Data
To draw segmentation masks, we need to load our data into a supervision Detections object. This object stores computer vision model predictions in a standard format that works with all supervision APIs, including detection visualizations, detection filtering, and metrics.
For this guide, let’s load data from a model trained on Roboflow and deployed with Roboflow Inference, an open source inference server.
We can load model predictions using the following code:
import cv2
import supervision as sv
from inference import get_model

model = get_model(model_id="yolov8n-640")
image = cv2.imread(<SOURCE_IMAGE_PATH>)
results = model.infer(image)[0]
detections = sv.Detections.from_inference(results)
There are several data loaders available for popular computer vision Python packages, including:
- from_deepsparse (Deepsparse)
- from_detectron2 (Detectron2)
- from_mmdetection (MMDetection)
- from_sam (Segment Anything Model)
- from_yolo_nas (YOLO-NAS)
For a complete list of data loaders, see the supervision Detections documentation.
Step #2: Choose an Annotator
Now that we have loaded predictions from our model into a supervision object, we can use those detections with the supervision Annotators API to visualize model results.
There are several annotators available with support for segmentation masks. To plot segmentation masks, we can use the MaskAnnotator. If you want to plot all regions outside of a segmentation mask (ideal for removing backgrounds in images), you can use the BackgroundColorAnnotator.
For a full list of supported annotators in supervision for all computer vision model types, see the supervision Annotators documentation.
Let’s use the MaskAnnotator.
Step #3: Draw Predictions
We can annotate our detections like so:
mask_annotator = sv.MaskAnnotator()
label_annotator = sv.LabelAnnotator(text_position=sv.Position.CENTER_OF_MASS)

annotated_image = mask_annotator.annotate(
	scene=image, detections=detections)
annotated_image = label_annotator.annotate(
	scene=annotated_image, detections=detections)

sv.plot_image(annotated_image)
When our model is run on an image, here are the results:
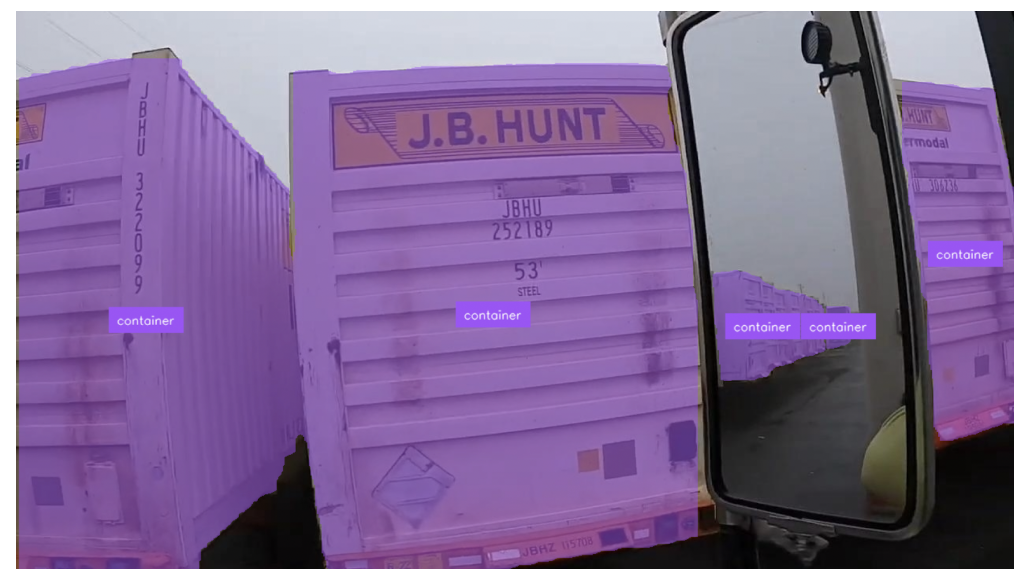
Our system has successfully plotted tight segmentation masks around detections.
Conclusion
Using the supervision Python package, you can draw segmentation masks from a range of popular computer vision models, from Segment Anything to YOLOv7 Segmentation to YOLOv8 Segmentation.
In this guide, we installed supervision, loaded detections from a model hosted on Roboflow and deployed with Roboflow Inference, then visualized detections from the model on an image with the MaskAnnotator.
To learn more about the suite of functionalities available in supervision, from annotators to metrics to detections processing and filtering, refer to the supervision documentation.
Cite this Post
Use the following entry to cite this post in your research:
James Gallagher. (Sep 3, 2024). How to Draw Segmentation Masks with Python. Roboflow Blog: https://blog.roboflow.com/draw-segmentation-masks-python/