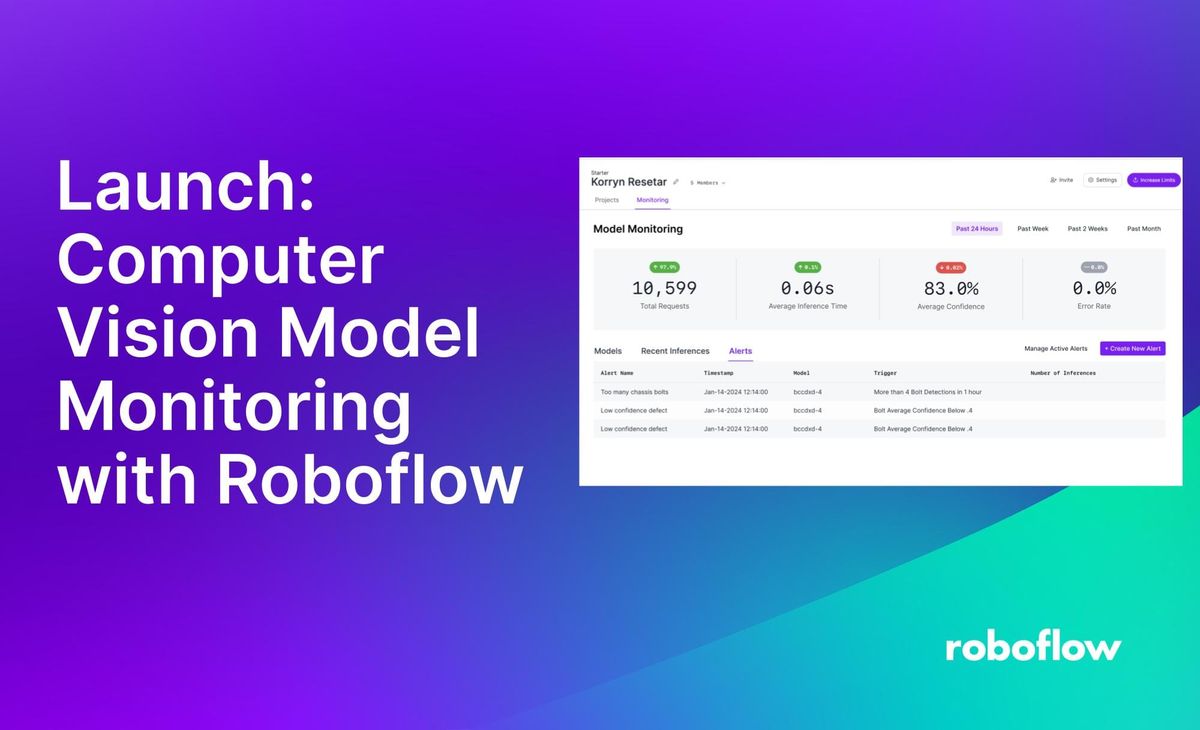
When you deploy computer vision models, it is essential to gather data on how your models perform in production.
Consider a scenario where you have deployed a model to detect nuts, bolts, and screws for use in a kit assembly system. Gathering data on how your model performs in real time gives you significant insight into how well your vision system is operating.
We are excited to announce Roboflow Model Monitoring, a feature that provides granular insights into how your deployed vision models are performing. All of this is securely managed from one central location on the Roboflow platform to help you manage hundreds of models deployed across thousands of locations.
With Roboflow Model Monitoring, you can:
- Determine if devices are running or offline
- View the number of inferences from each device you operate
- View the the average and median confidence of predictions
- Measure average inference time, and
- View individual prediction results, including detections
- View actual images used in the inference requests
- View your custom metadata in the dashboard
- Get alerted when key events occur or anomalies are detected
Roboflow Model Monitoring supports inferences made with Inference, an open source computer vision inference server that you can use to run models on your own hardware. This includes all inferences made using the Roboflow Hosted Inference API as well.
In this guide, you will learn how to use Roboflow Model Monitoring to better understand your fleet of models deployed with Roboflow.
Without further ado, let’s get started!
How to Monitor Vision Models with Roboflow
Roboflow Model Monitoring gives you extensive insights into how models deployed with Roboflow Inference are performing. You can use this feature to track ROI for your business and understand the precision of your model on different classes when deployed in production in real-time.
If your model starts failing on a specific class (a problem that can be caused by model drift), you will be able to see that immediately in your model monitoring dashboard and receive real time alerts.
You can evaluate statistics on:
- Inference count;
- Detections Count
- Precision;
- Average confidence;
- Inference time.
These statistics can be viewed for a selected time period.
To access the feature, click the “Monitoring” tab in your Roboflow account.
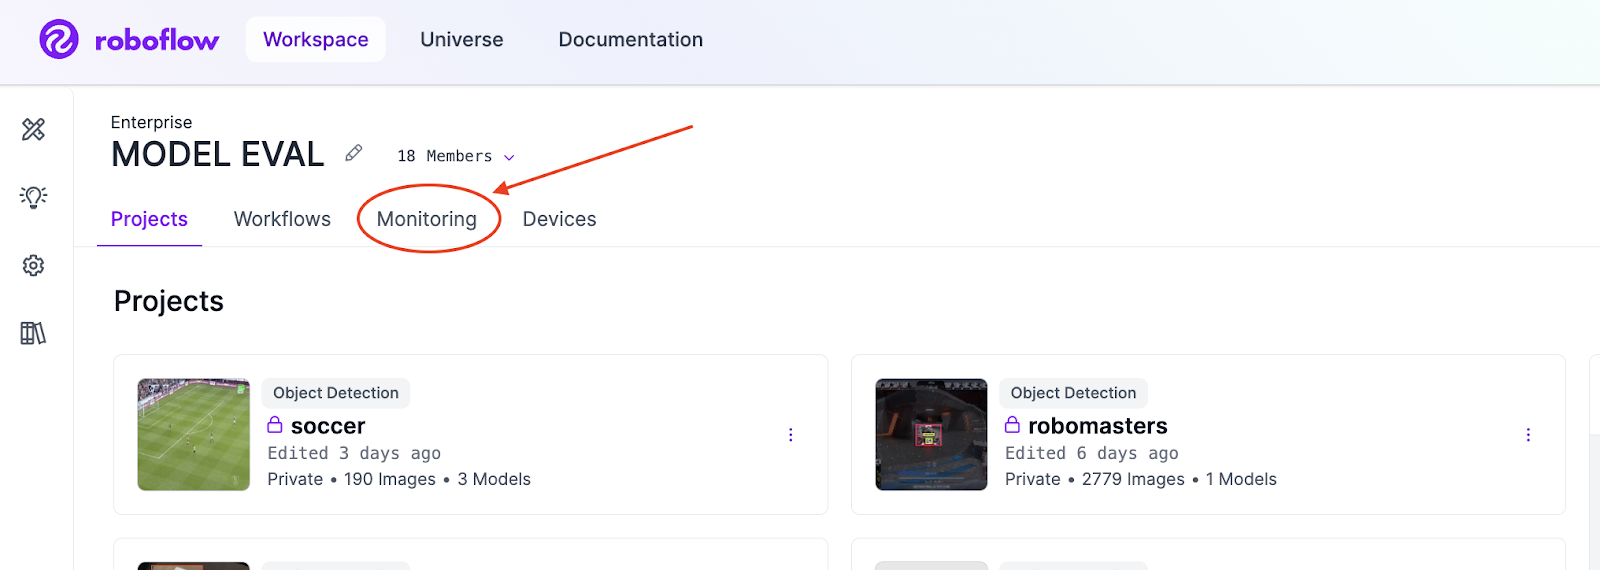
A Model Monitoring dashboard will appear where you can choose a time period over which you want to evaluate your models. The data displayed will correspond to the time filter you have selected (past week by default).
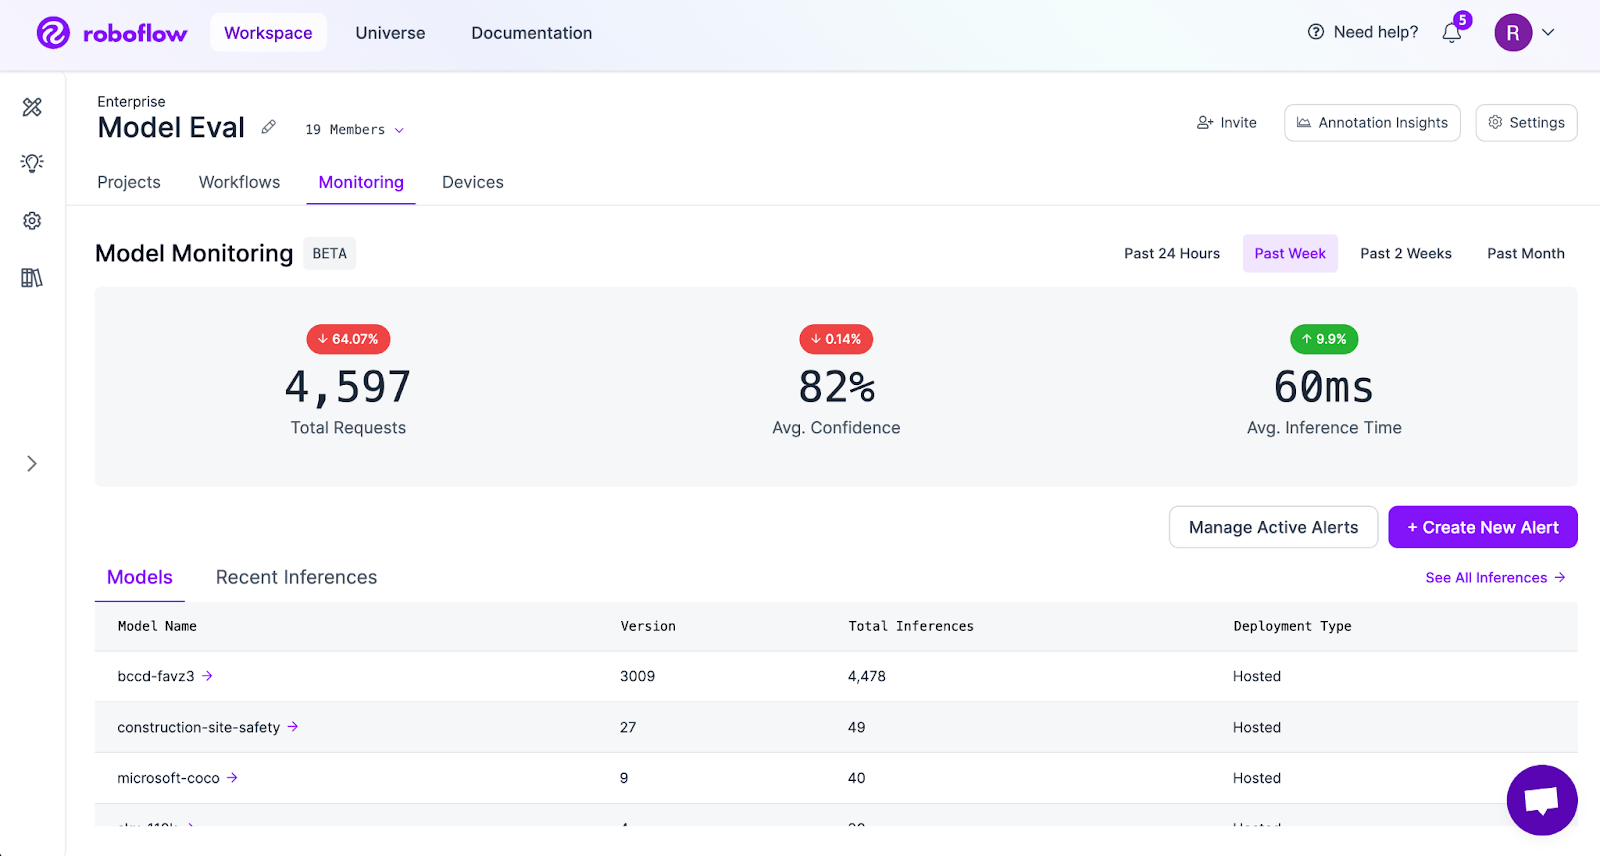
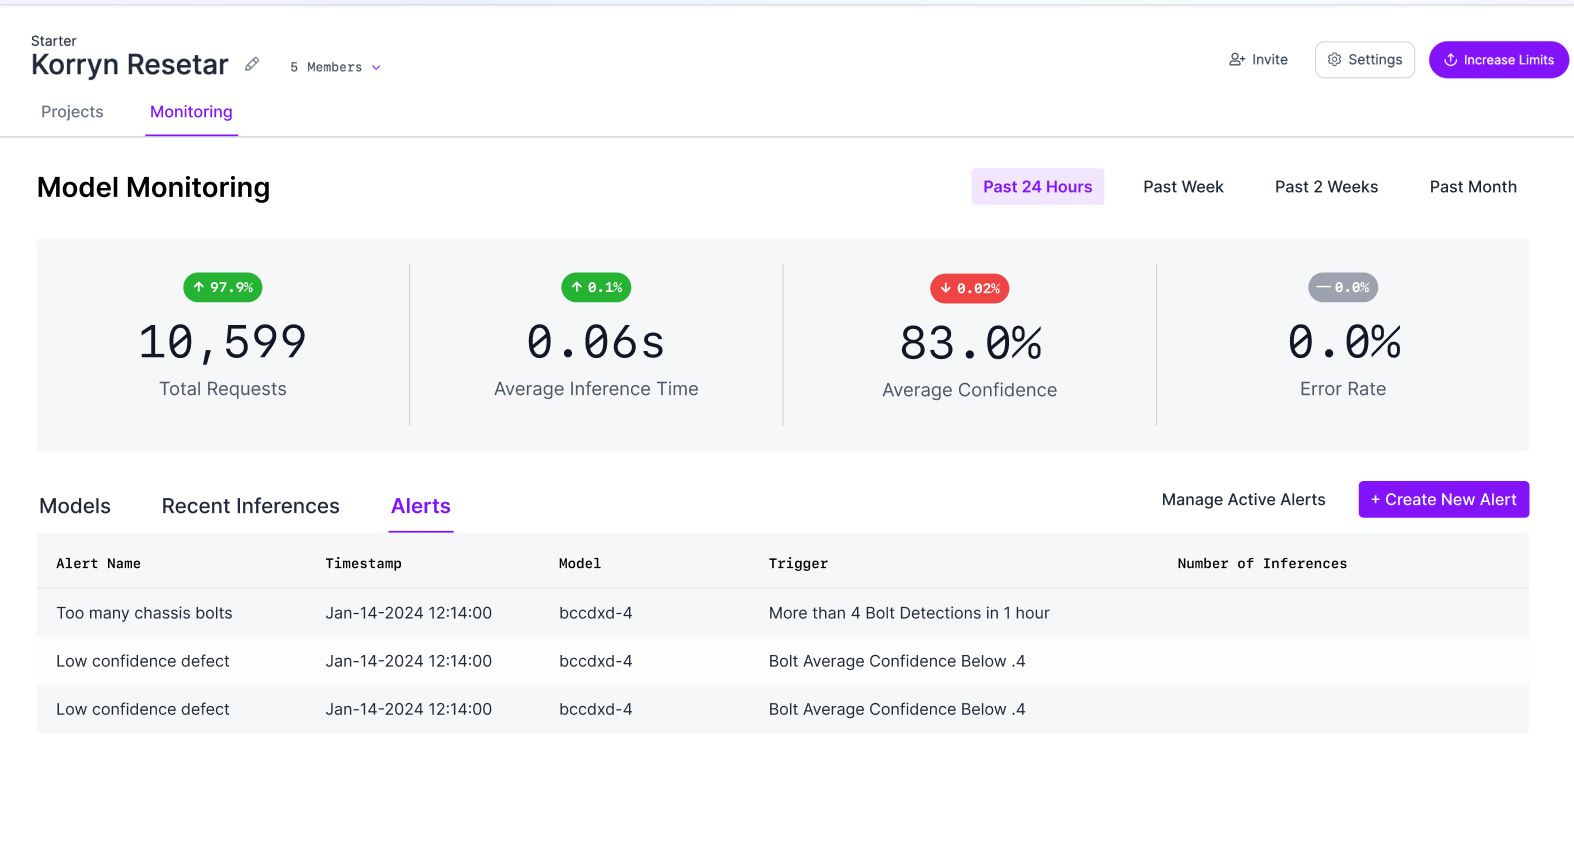
On the Model Monitoring dashboard, an aggregate view of your model performance is presented. You can see the request count, average inference time, and average confidence across all models. You can also see these statistics broken down by each individual model you have deployed.
Model Monitoring enables you to be proactive about analyzing models in production. If you notice that model performance is poorer than expected at any time – i.e., after a model version rollout, or months after a new manufacturing equipment rollout – you can review your data in Roboflow to better understand the problem.
For example, a class may not be properly represented in your test set (Which you can learn more about in the Roboflow Health Check feature). The model might struggle when an object is in an environment that has shifted since you last trained the model – Lighting changes are a common issue. You can use Roboflow’s model evaluation tool to understand if that is the case and, if so, in what environment(s) your model struggles most.
With the insights you uncover, you can make changes and train a new version of your model to improve performance.
Adding Custom Metadata
While Roboflow’s Model Monitoring dashboard provides base-level operational data to improve the observability of inferences made against your model in production, you can also connect this information to your specific business use case. For example, if your use case involves cameras in various locations, and you want to be able to filter information to data for a particular location, you can use the Roboflow API to attach location information to each individual inference. This will allow you to sort, search, and filter by location in the Model Monitoring dashboard.
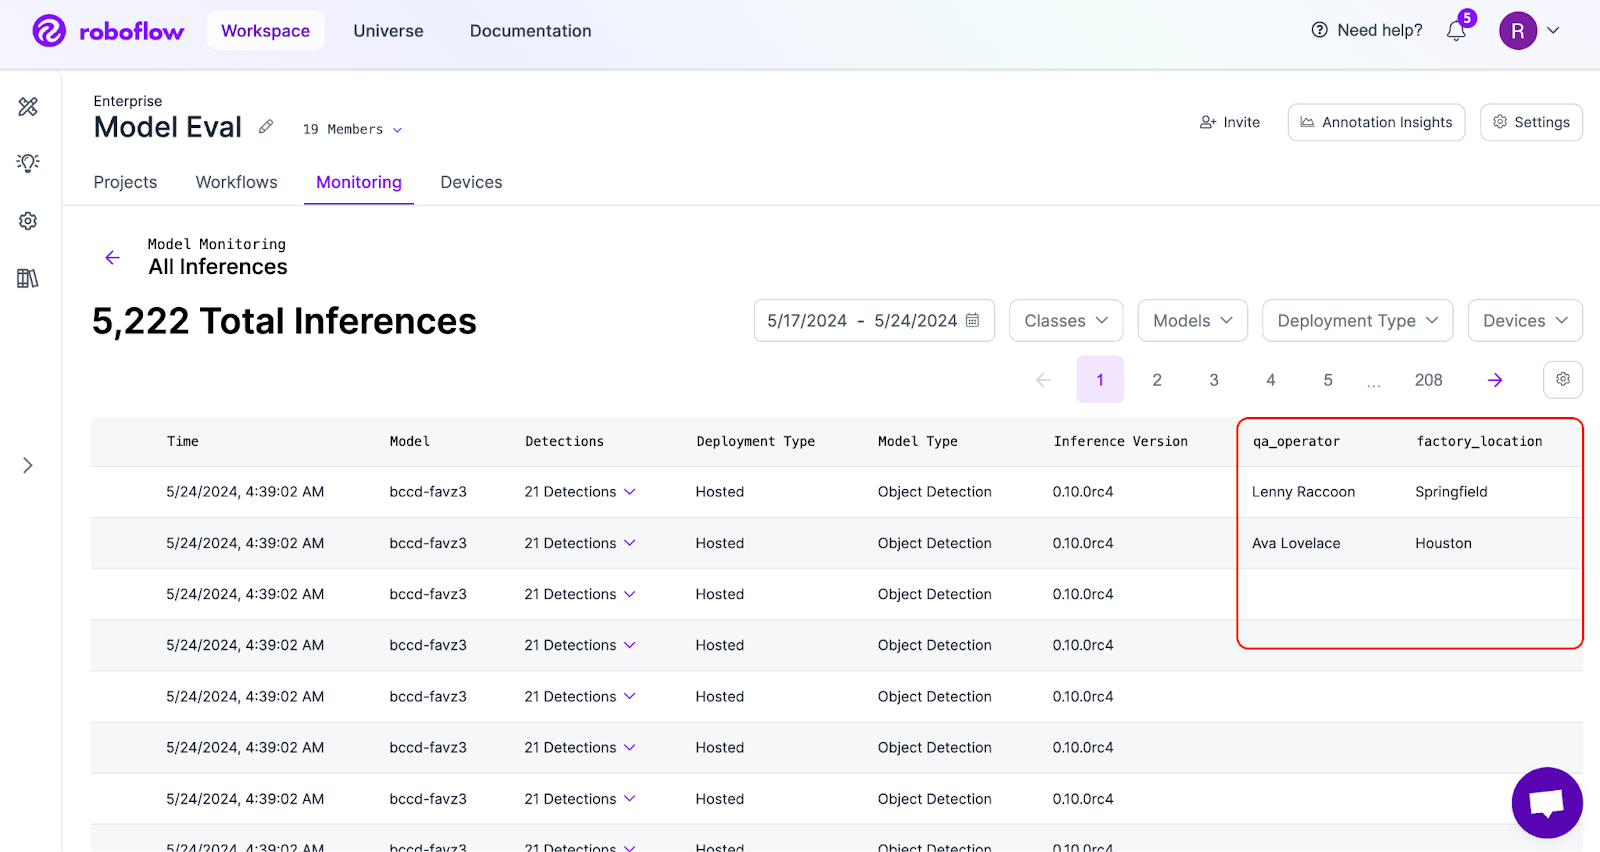
Adding this data involves a simple HTTP request. Each inference response from the Hosted Inference API or Inference Container returns an inference_id property in the response. With this, you can then make a POST https://api.roboflow.com/:workspace/inference-stats/metadata request to attach the information to that request. For more information, visit the Custom Metadata documentation.
Viewing inference images
The Model Monitoring dashboard also gives you the ability to see the actual images used in the inference request. Any images collected in Roboflow’s Active Learning pipeline will appear in the Model Monitoring Dashboard. To configure an Active Learning rule, view the instructions here. Note that not all images will be collected, whether an image is sampled is determined by the active learning rule that you configure.
Model Monitoring Alerts
Real time updates are important in understanding what’s happening with your production models. Model Monitoring Alerts allow you to receive notifications when certain events are encountered. For example, if your model tracks defects on a production assembly line, you can receive an alert anytime there are more than a certain number of defects detected. For information on setting up Alerts, visit the Alerts documentation page.
To manage the alerts that you have created, you can click the “Manage Active Alerts” button from the main dashboard view. From here, you can edit the configured alert by clicking the pencil icon, or you can delete it by clicking the trash can icon.

Any alerts that were triggered can be seen by clicking the “Alerts” tab in the table in the main dashboard view.
Conclusion
You can use Roboflow’s Model Monitoring solutions to monitor deployments of models run through Roboflow Inference. With Model Monitoring, you can analyze how every model running in production performs across all classes. You can analyze results over the last 24 hours, week, two weeks, or month.
Model Monitoring is available for enterprise customers through the Monitoring tab on your dashboard. To learn more about using Roboflow in your enterprise, contact the Roboflow sales team.
Cite this Post
Use the following entry to cite this post in your research:
James Gallagher, Rob Miller. (May 24, 2024). Launch: Computer Vision Model Monitoring with Roboflow. Roboflow Blog: https://blog.roboflow.com/model-monitoring/
