
As the environment in which a computer vision model changes, a model needs to be updated to adapt. For example, consider a model used to detect the presence of trains on a track. As new models and designs are used, seasonal conditions revolve, and other environmental factors change, model performance may be affected.
Drift refers to the tendency of computer vision models to become less performant over time as the model environment and targets change.
How to Detect, Monitor, and Fix Computer Vision Data Drift
Evaluating data drift is an essential part of maintaining computer vision infrastructure, lest models become less performant over time. In this guide, we’re going to talk about how to evaluate data drift in your computer vision projects. We’ll also disambiguate between data drift and concept drift, two related concepts that have different impacts on model performance.
Without further ado, let’s get started!
What Is Drift?
The longer a model has been in production, the more opportunities there are for the target objects the model is trained to identify and the environment in which the model is deployed have changed. The concept of drift can be seen across machine learning, where models can drift as the data on which the model was trained no longer reflects real world conditions to the same extent.
How Do Data Drift and Concept Drift Differ?
There are two types of drift:
- Data drift: This happens when environmental factors impact the model. For instance, target objects can be modified or updated in form factors that the original model did not learn. For instance, if a new locomotive design became available, an old locomotive object detection model not trained on vehicles with that design might not be able to identify the vehicle with the same precision.
- Concept drift: This happens when the objective for a trained model evolves. For example, consider a model trained to identify locomotives. If a new maintenance vehicle is deployed that needs to be identified, the existing trained model may not be able to identify the vehicle with a high degree of confidence.
Data drift happens in the background as a result of incremental changes in the environment over time, whereas concept drift is the result of a change in objective.
In this guide, we’ll focus on detecting, monitoring, and correcting computer vision data drift.
Why Is Monitoring Data Drift Important?
Consider a scenario where you are collecting images for a locomotive monitoring project. Since training the model, the locomotives may have changed. For example:
- The locomotives have new styles and form factors, making them different to the images you used to initially create your model;
- The trains are different colors;
- The lighting in the station has changed, and as a result the model cannot identify trains in lower light conditions to the same extent;
- The camera was changed and moved into a new position;
- The model was trained only on passenger trains, but commercial trains now pass through the station.
By measuring data drift, you can see how close the information in your model dataset is to input data. You can use this information to evaluate whether you need to add more representative images to your dataset. In the case of the train monitoring project, input data is drifting from the data on which the model was trained.
For example, if locomotive form factors have changed, you may want to add images with new locomotive styles to help your model learn to identify the new styles.
How to Detect, Monitor and Correct Data Drift
Let’s discuss how to detect, monitor, and correct data drift.
Step #1: Configure a Drift Dataset
In this guide, we’re going to use two datasets:
- A main dataset in which you store images for your application, and;
- A dataset to store a random sample of images collected on the edge that represents the environment in which your model is deployed.
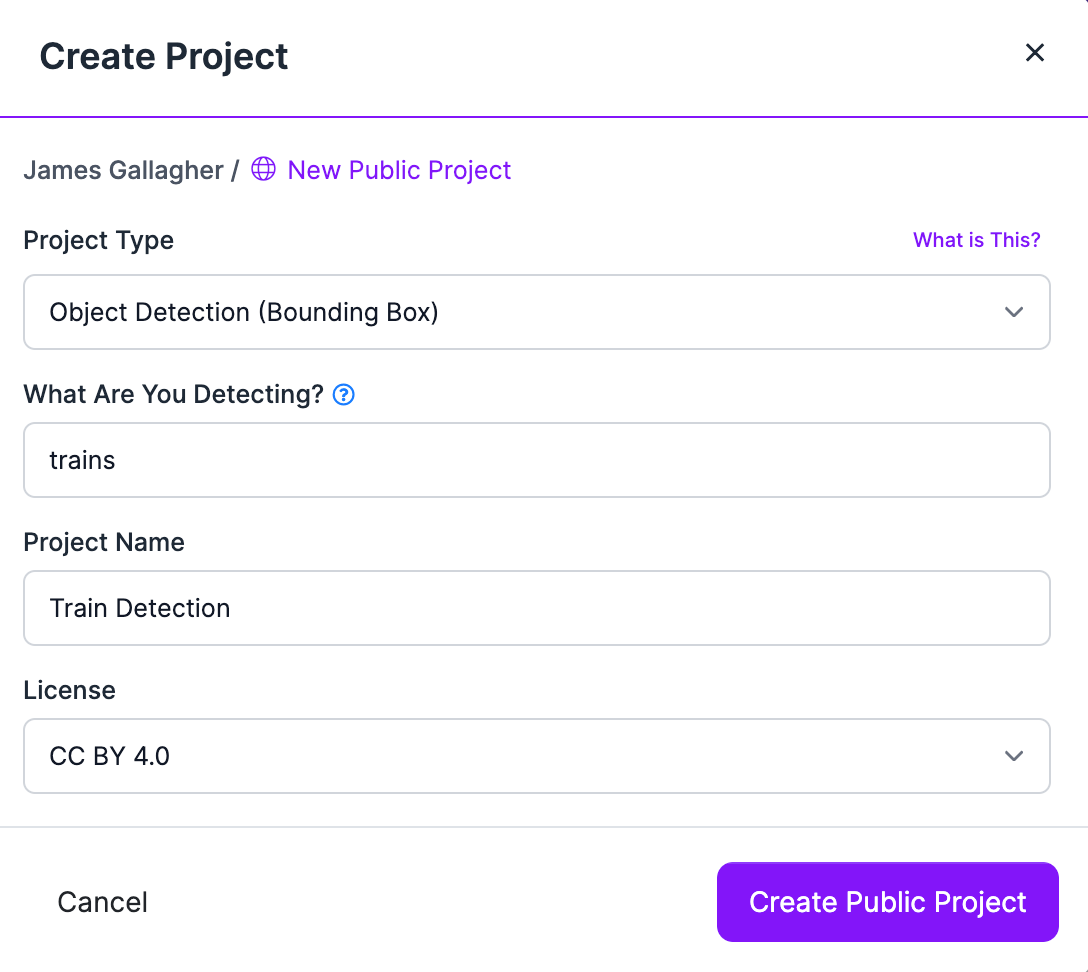
In this guide, we’re going to collect images for a train detection dataset. To get started, let’s first create a new project in Roboflow for our detection dataset. Go to the Roboflow application and click “Create Project” to create a new project. If you already have a project, you can skip this step.
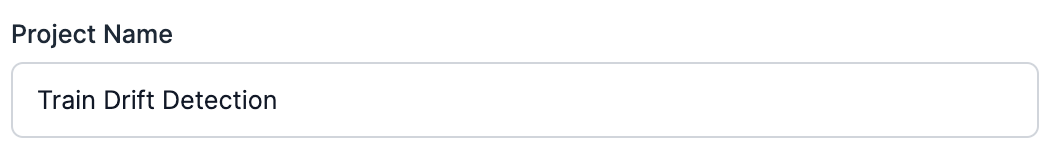
We'll also create a project in which we'll store a random sample of collected images for use in measuring data drift:
Step #2: Set Up Roboflow Collect
Roboflow Collect, an open source application, passively collects images for use in a computer vision dataset. You can instruct Roboflow Collect to collect images that are semantically similar to those already in your dataset, images related to a given text prompt, or to collect images at a specified interval.
Our latest addition to Roboflow Collect provides a script that you can use to monitor data drift with your collected images. The data drift script compares the images added to your dataset by Roboflow Collect to the images in your validation set and shows the semantic difference between the images in each dataset.
Now that we have our project ready, we can install Roboflow Collect and start collecting images. To install Roboflow collect, run the following commands:
git clone https://github.com/roboflow/roboflow-collect
pip3 install -r requirements.txt
We'll also need a Roboflow Inference Server through which we can run CLIP, which we'll use for determining the similarity between images in our datasets. The inference server will run on http://localhost:9001.
CPU Installation
sudo docker pull roboflow/roboflow-inference-server-arm-cpu:latest
sudo docker run --net=host roboflow/roboflow-inference-server-arm-cpu:latest
GPU Installation
sudo docker pull roboflow/inference-server:jetson
sudo docker run --net=host --gpus all roboflow/inference-server:jetson
Configure Roboflow Collect
We’re going to collect images that are similar to the prompt “train”. This works by comparing CLIP vectors, a numerical representation of text or images. CLIP vectors can be compared to understand the similarity between text and images. By providing the prompt “train”, we instruct Roboflow Collect to collect images related to trains.
We're going to use a YouTube livestream of a train station to gather images for our dataset (Note: The stream we use in this guide may not be active in the future.).
We can start collecting images using the following command:
The STREAM_URL argument instructs Roboflow Collect to capture images from the provided stream.
The CLIP_TEXT_PROMPT_THRESHOLD specifies how similar the image in the camera needs to be to the text prompt before an image is sent to Roboflow. We recommend running the script without this flag and monitoring the numbers reported in the console to see what similarity makes sense.
Here's an example of running the script without the flag:
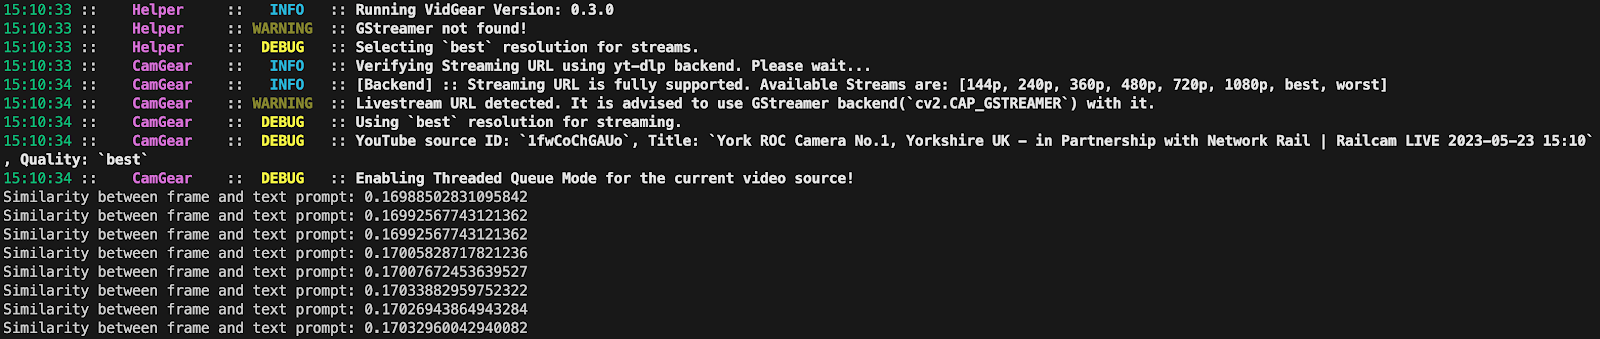
For our example, a low similarity is used because the image is large and contains lots of objects. The similarity should be capture for what you are looking without being low enough to capture data you do not want. The similarity was around 0.17 when a train was stationary on the tracks, so a number in that range is sufficient for our use case. We used 0.16 in the example above.
When we run this command, Roboflow Collect will start sending images related to our prompt to the project with the ID we specified in ROBOFLOW_PROJECT. Every so often, an image will be sent to our DRIFT_PROJECT which we’ll use to evaluate data drift over time.
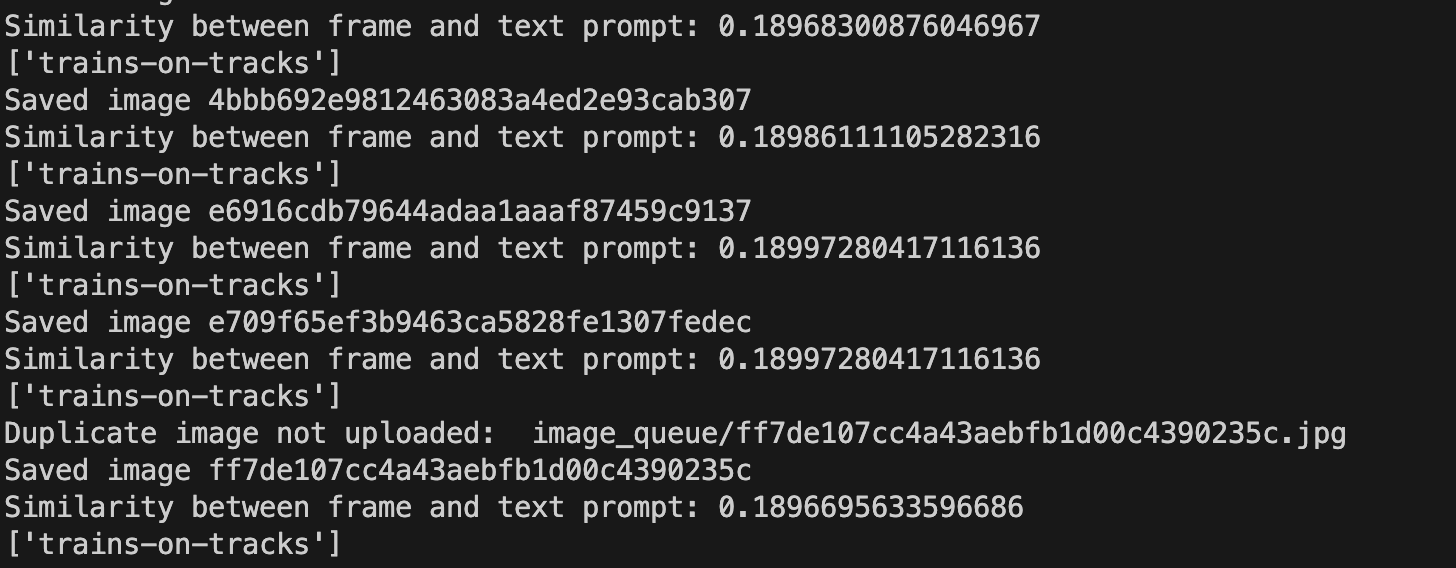
When images are collected, you will see an output like this in the console:
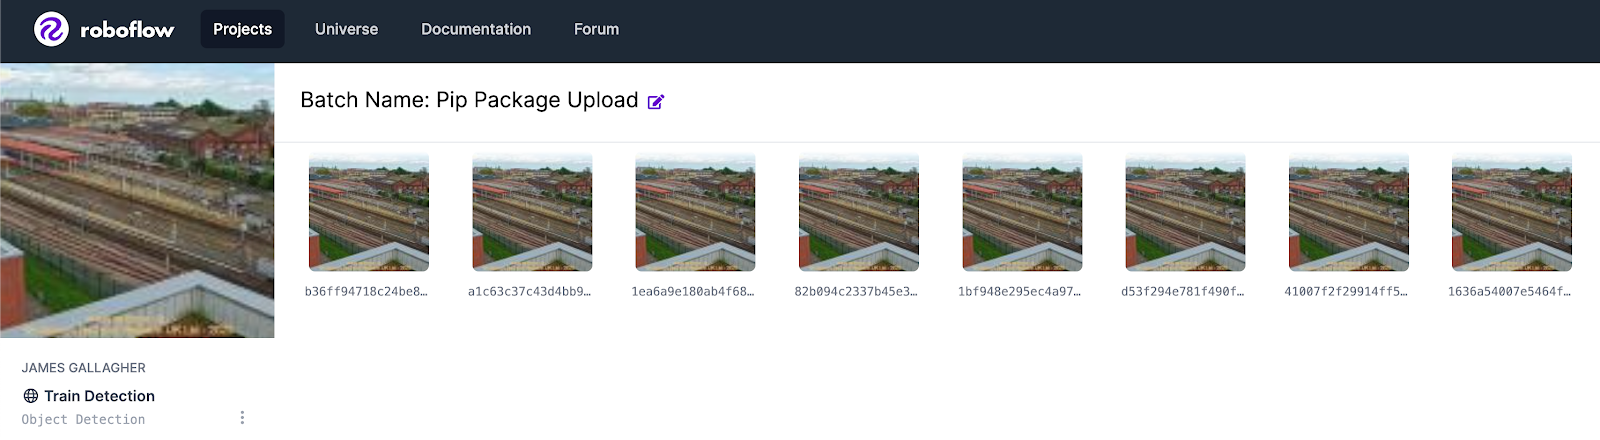
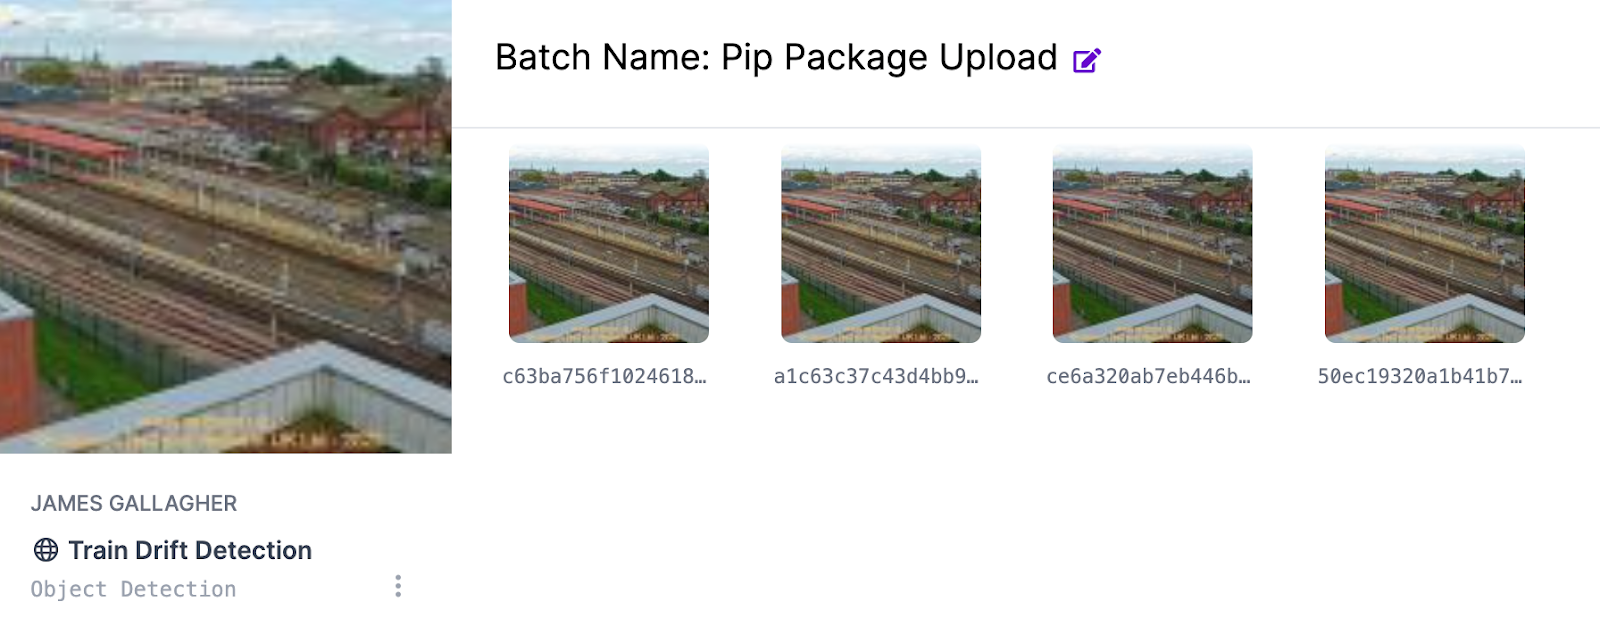
The images will be available in the Roboflow dashboard:
You can leave this command running for as long as you would like. If the event you are trying to capture is infrequent, you may want to leave Roboflow Collect on in the background so you can gather many samples of your image.
We recommend collecting a few hundred images in your dataset before starting to measure data drift. This will ensure you have enough images to create a large validation set for use with Roboflow Collect.
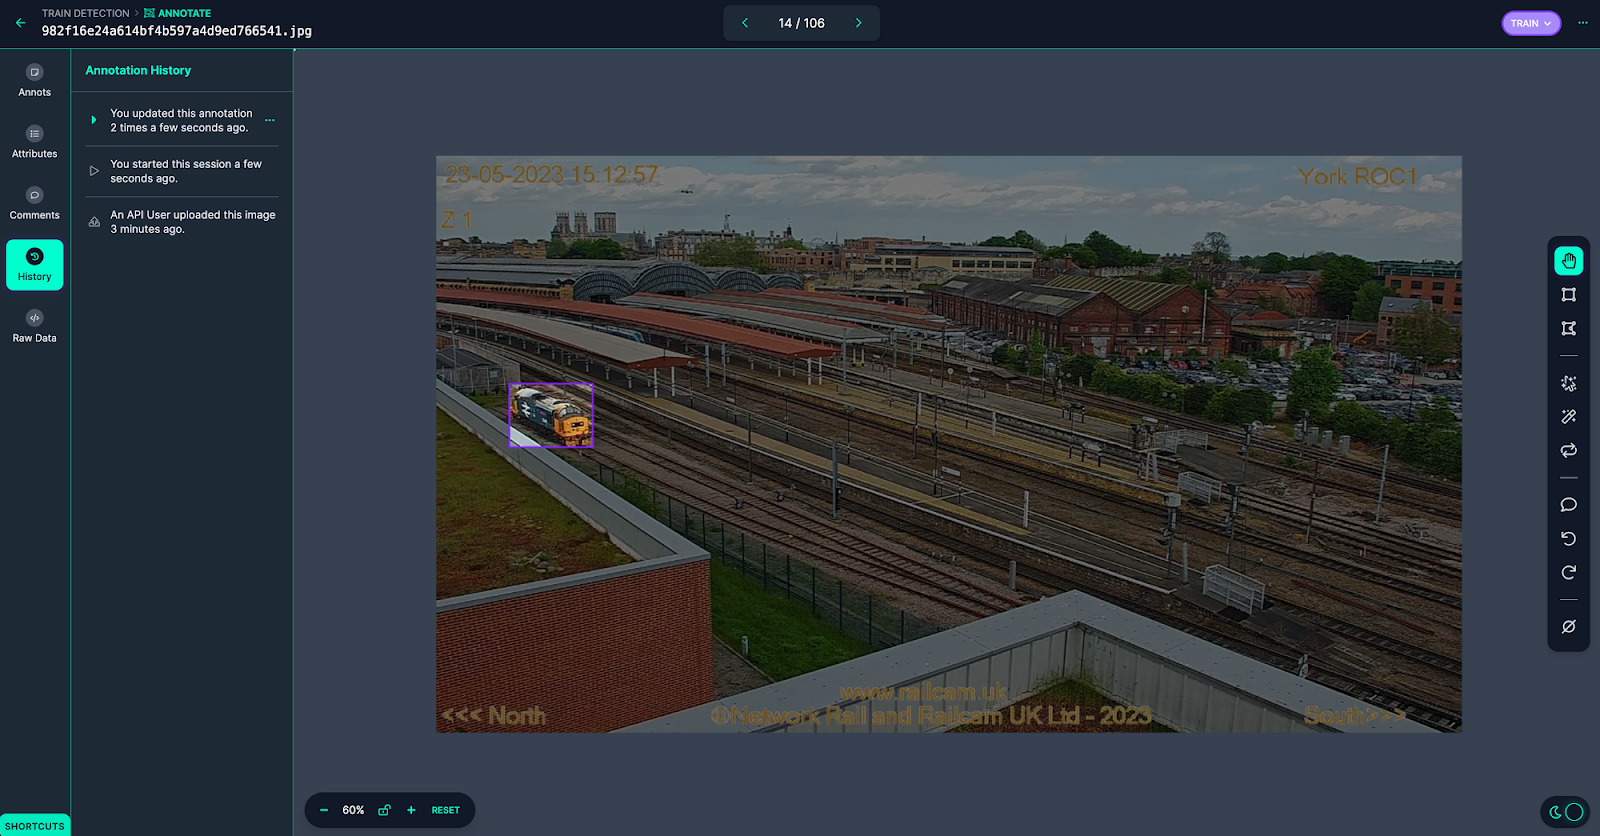
After you have collected enough data for your project, go to the Roboflow dashboard and annotate your images. If you already have annotated images, you can skip this step unless your new input images are different from the ones Roboflow Collect has added.
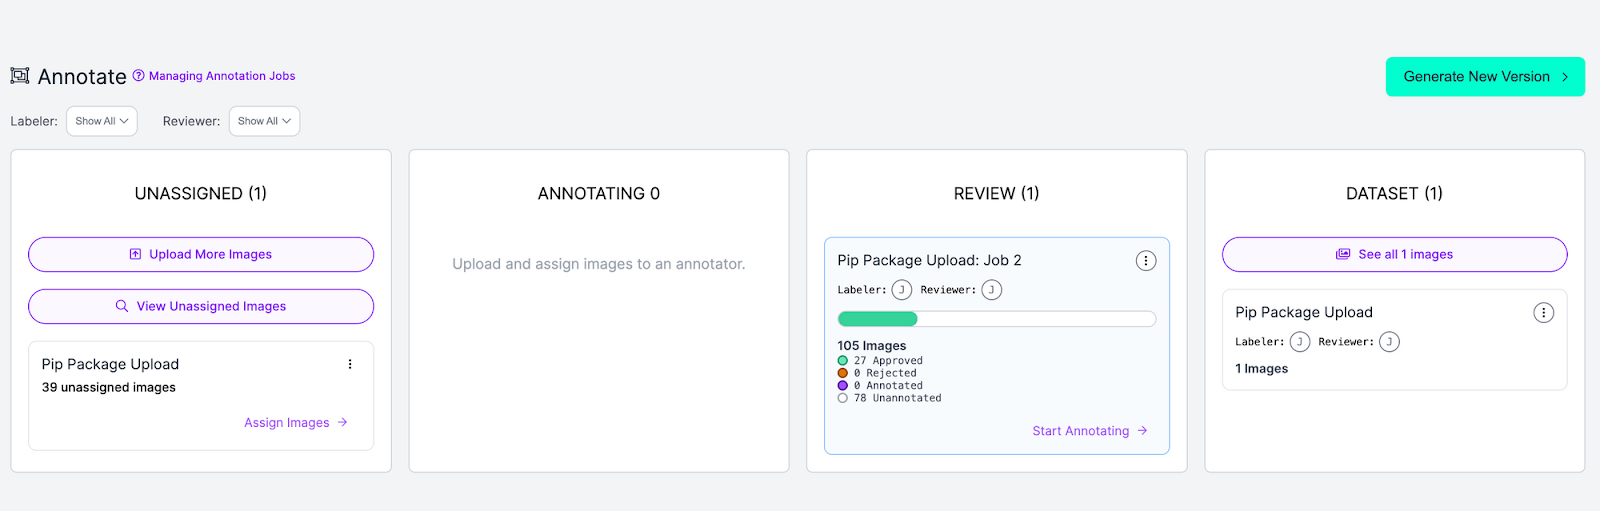
Once your images are annotated, exit the annotation tool and click "Annotate" in the sidebar. Then, click on the annotations you want to review in the Review column:
When we click on the upload job in the Review column, we will go to a page where we can approve our annotations:
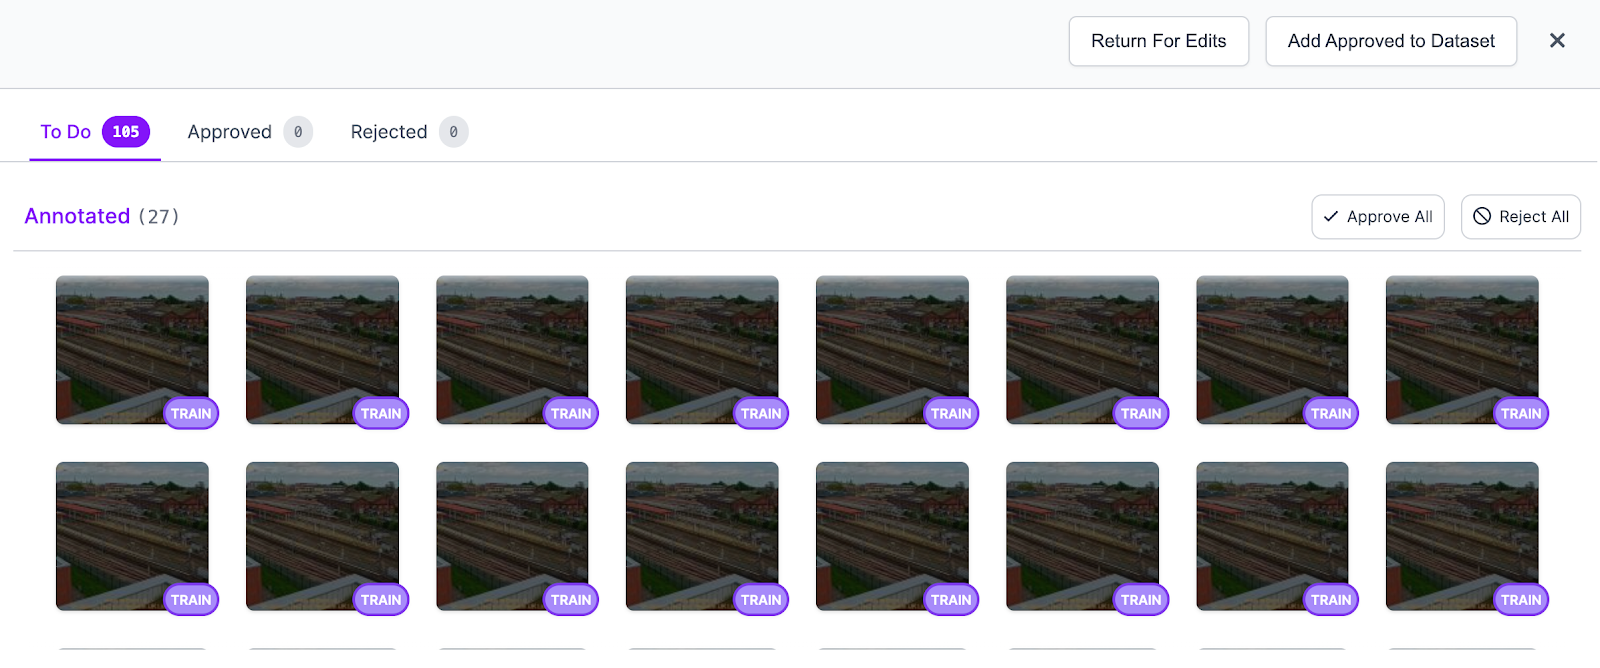
When you have annotated all images, click the "Add Approved to Dataset" button to choose a train, test, and valid split. We recommend a 70-15-15 split between your training set, test set, and validation set.
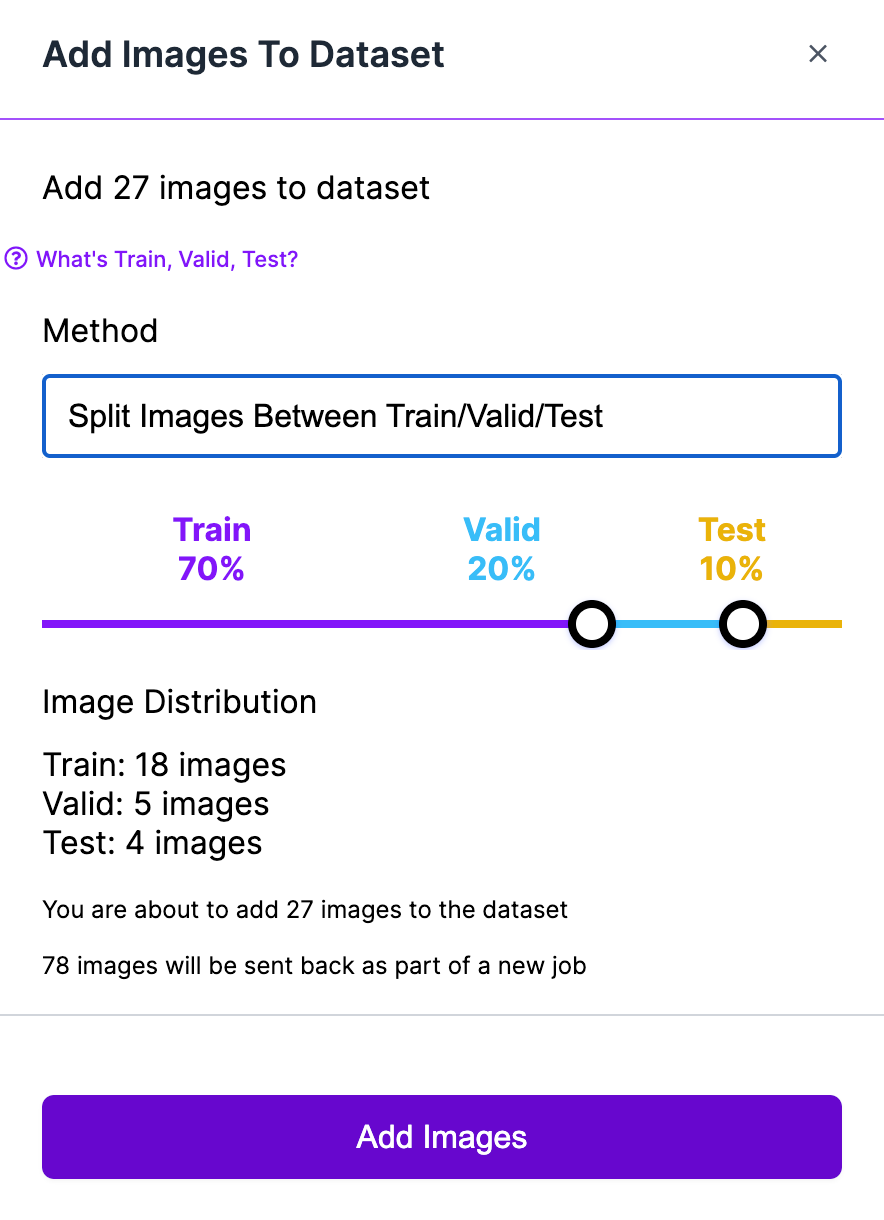
The images in the training dataset can be used for training in your project. If you’re ready to start training a model, check out the "Training a Computer Vision Model" section in our Getting Started guide that walks through training a model. We’ll use the validation images to evaluate data drift.
We need to go through this same process with our drift dataset, too:
In your drift dataset, you can mark all images as null in the annotation tool; the labels are not used by the drift monitoring application. Mark all images as null, approve the annotations, and add them to your dataset following the steps we went through earlier.
Step #3: Evaluate Data Drift
Now you have data in two datasets:
- Your main dataset on which models are trained, and;
- Your drift detection dataset.
After collecting data from Roboflow Collect, you can run the drift.py script in the project to measure data drift:
python3 drift.py --ROBOFLOW_KEY="" --ROBOFLOW_PROJECT="train-detection" --ROBOFLOW_WORKSPACE="workspace" --DRIFT_PROJECT="train-drift-detection --INCREMENT=monthThis script accepts the two projects with which we have been working: the main project on which we will train models, and the drift project that stores data gathered by Roboflow Collect.
There are a few flags you can pass to specify the interval on which data should be segmented:
--INCREMENT=day: Show drift by day.--INCREMENT=week: Show drift by week.--INCREMENT=month: Show drift by month.
You can only pass one of these flags at a time.
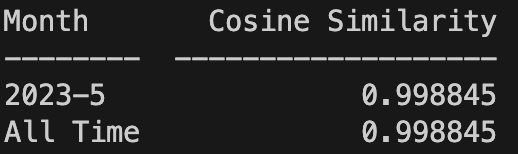
Let’s run the drift.py script with the --INCREMENT=month flag. The script returns the following:
Analyzing and Correcting Model Drift
The closer the numbers are to 1, the less data drift between our validation sets and the images that Roboflow Collect has collected. From the table above, we can see that our input data has not drifted substantially from the data in our validation set.
The number should not be distanced by a few points from 1; a score of 1 indicates all images are the same. In our case, the number is almost equal to 1 because we only sampled data for a few minutes.
Numbers below 0.8, for example, show the input data is 80% similar or less to the validation set in your model data. We recommend investigating data when it hits this threshold to understand the root cause of the data drift.
Here are some questions to ask yourself if you notice your model has drifted:
- Have inputs – frames from camera feeds, videos, pictures – changed since you last trained a model?
- Have the objects you want to identify changed in style, form factor, size, or design since you last trained your model?
- Was your model trained on data from all seasons?
There is no one “right answer” to correcting model drift. Asking the questions above will get you thinking about the ways in which your model may have drifted. To confirm your suspicions, you should analyze your input data to understand feature representation between different categories (i.e. lighting conditions, styles of objects, seasonality) to evaluate what may have caused your model to drift.
After identifying a potential issue, add new data to your dataset that is representative of the current environment in which your model is running. You can use the images Roboflow Collect gathers as a starting point as the tool is constantly collecting representative images from your environment. After labeling the images, add them to your dataset and train a new model.
You can use a tool like CVevals to evaluate your model against your test set of data, and the drift script to monitor whether drift has improved.
If you are regularly updating your model, we recommend running `drift.py` on a scheduled cadence so you have up-to-date insights into data drift.
How to Fix Computer Vision Data Drift Conclusion
Computer vision models are not static; as environments and objectives change, so too does a model need to change. Otherwise, the model will fall behind and become less performant over time.
There are two types of drift: data drift and concept drift. Data drift refers to a change in the environment that causes a deviation between the data on which inference is run and the data on which a model was trained. Concept drift refers to a change in objective for a model.
In this guide, we discussed how to use Roboflow Collect to monitor for data drift in the background, allowing you to keep on top of data drift as it happens and thus proactively address any potential drift issues with your model.
For more information on using Roboflow Collect, check out our introductory guide that shows how to set up Roboflow Collect with various configuration options. We also have reference documentation for Roboflow Collect that may come in handy as you set up your data collection pipeline.
Cite this Post
Use the following entry to cite this post in your research:
James Gallagher. (May 24, 2023). How to Fix Computer Vision Data Drift. Roboflow Blog: https://blog.roboflow.com/monitor-data-drift-computer-vision/