
Computer vision can turn ordinary security cameras into a tool for understanding how shoppers move through a store: tracking how many people are in each section and how long they stay there. This tutorial walks through dividing a store into labeled regions, training an object detection model with images annotated in Roboflow, and writing a Python script that counts occupancy per zone in a live video feed. The resulting system can surface actionable signals like congestion in high-traffic aisles or checkout queues that need extra staff.
There are many situations in a retail where you may want to monitor movement. For example, knowing when and how long customers spend their time at checkouts can help stores prepare for busier times by having more checkout staff on hand. Being able to deploy more staff checkouts at busier times will improve customer satisfaction as a result of the reduced time waiting to check out and purchase goods.
Monitoring movement in retail stores has other use cases. A retail store could track how much time people spend in each region of the store – electronics, food, clothing – to understand what departments may need more or less space in a store redesign or when building new stores.
Example of the final output of this blog post
With computer vision, retail businesses can use cameras to track movement and better understand how shoppers interact with the store. In this guide, we’re going to talk about how to track movement in different regions of a retail store with computer vision. We’ll talk through an example where we monitor how many people are shopping in a few different areas visible in a camera feed.
Monitor Movement with Computer Vision in Retail
Let's begin with the problem: detecting people and dividing a store into sections. Suppose a shop wants to understand how long people spend in different areas of the store. Each area sells a different product, such as snacks, larger food items (i.e. multi-pack goods), and drinks. To gather these insights, a store needs to:
- Divide a store into different labeled sections.
- Be able to detect people in each labeled section.
This is a problem that can be solved using computer vision.
The Computer Vision Solution in Retail: Object Detection
Object detection is a computer technology related to computer vision and image processing that detects instances of objects of a particular class (such as humans, buildings, numbers, or cars) in digital images and videos.
In our example, we will use computer vision to identify people walking around a store. To implement our solution, we will need to:
- Gather, upload, and annotate images.
- Train a model using our images.
- Draw different areas on the video that we’ll be analyzing.
- Write code that tracks when people move between different areas.
We will use some basic equations to draw lines between each store section that we want to monitor, detect people, and determine which section they are located in. After this, we will count how much time each person spends in their current section.
By the end of this blog post, we will have a result that looks like this:

Step 1: Upload and Annotate Images
For this tutorial, we’re going to use pre-existing videos to train our model to recognise people. This will eliminate the need for us to set up a live camera. With that said, the code we write could easily be deployed on a live camera such as a Luxonis OAK.
First, we will upload a video to Roboflow. We will use Roboflow to divide the video into frames – individual pictures – which we can annotate. The annotations we create will be used later to train our model to identify various features in an image.
We need to train our model to identify people. We shall use a video of a retail store to train a model to detect people. Images and videos from any source can be uploaded directly to Roboflow for annotating, training, and deploying.
To upload our image, we will use the Roboflow drag-and-drop web UI. After uploading your image, you will be asked after how many seconds a frame (photo) should be taken from your video. For this project, select one frame every two seconds.
The more diverse images or videos uploaded and annotated, the higher accuracy of the model becomes after training. To improve your model further down the line, you may want to annotate images taken from the retail store in which your model is going to be deployed.
After uploading is complete, it is time to annotate each frame. In the Roboflow Dashboard, select the first image to annotate. Then, draw boxes around each person. The boxes you draw should be as close around people in the image as possible. This will ensure the model learns how to detect people without becoming dependent on specific surroundings. Check out our ultimate guide to image annotation for more information on how to annotate your images.
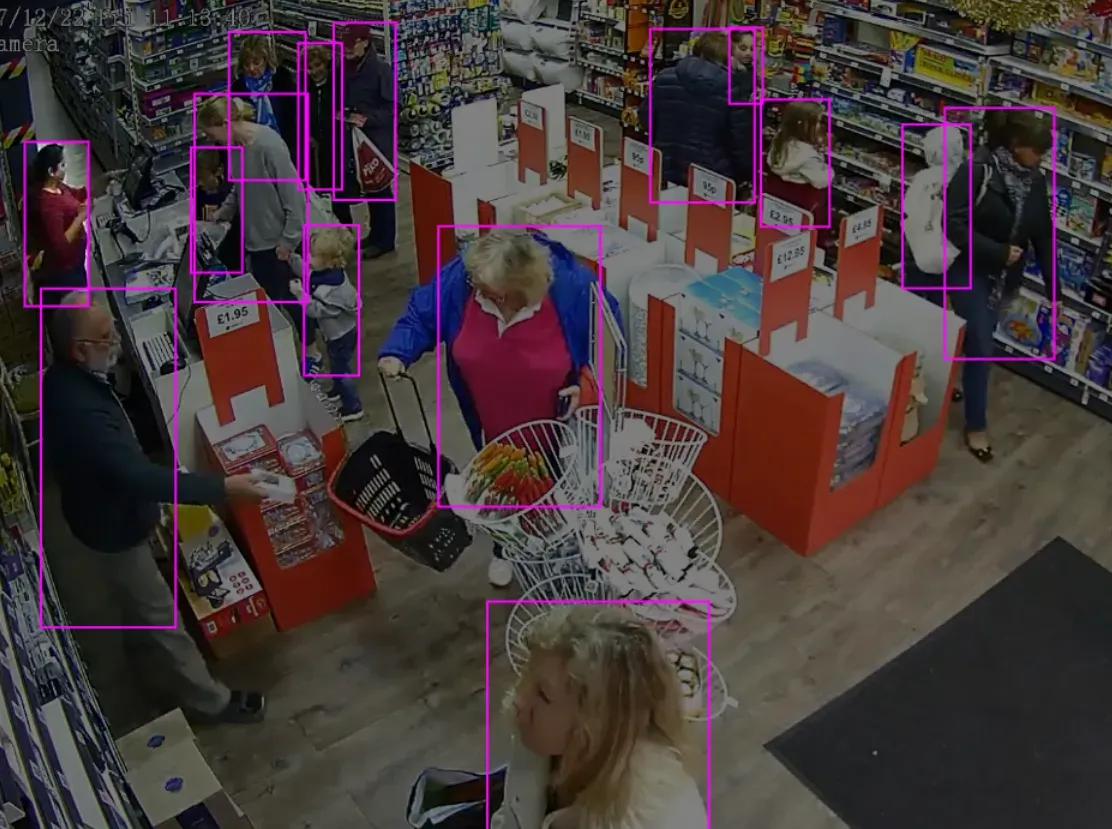
In the image above, we have annotated around everyone present. But, arms and below the knees are not captured in all of our bounding boxes. Arms and legs may be obstructed in the store so the model needs to learn how to generalize and detect people when there may be obstructions (i.e. boxes, product stands, shelves) in the way.
After annotating each frame, click the back button to go back to the Roboflow Dashboard. Here’s what the button looks like:
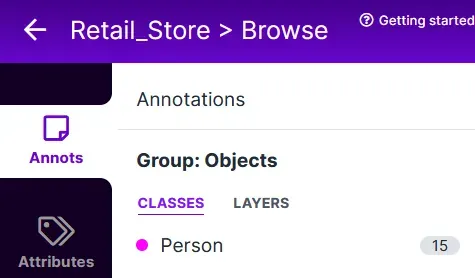
Click the “Add [number of images] image to Dataset” button to move on to the next steps. Roboflow will then ask you what train, valid, and test split you want. We recommend using the default values.
Step 2: Train the Model
Now that we have annotated our images, we are ready to train our model. To train our model, select the “Generate” in the Roboflow Dashboard. This is the page where we will specify the augmentation steps to prepare our data for our model.
Click on the “Pre-processing” button. Keep “Auto-Orient” as it strips your images of their EXIF data so that you see images displayed the same way they are stored on disk. After this, click on “Augmentations”.
Image augmentations are a way to generate more images using existing data in your dataset. Using image augmentation lets you train a model with fewer images than you would otherwise need. The Roboflow augmentation tool creates a diverse set of artificial images from the original that helps the model understand what specific features to look out for without bias, regardless of lighting, orientation, location, hue, contrast, etc.
In our project, we should set the following augmentations:
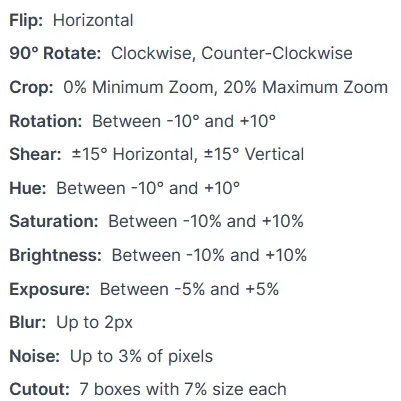
Now select how many images you want to generate for each set of augmentation values. We recommend 3x. Then, click “Generate.”
Now it is time to train the model. Click “Start Training.” Click “Fast” so that we’re able to get a model set up quickly. In production, however, you may opt for “Accurate” to achieve maximum performance. Then, sit back and relax while Roboflow trains your model. This process can take between 10 minutes and 24 hours depending on how many images you annotated.
Once your model has been trained, you can start using it! But, the model will not immediately detect how many people are in a specific region in a store. We need to write a script that uses predictions from the model to calculate movement based on the people our model has identified. We’ll discuss this in the next section.
To see your model work on a demo video, click “Deploy” on the bottom left of the Training page and drag and drop your content to the “Try this model on…” section.
Step 3: Writing the Script
Now that the model can detect each person, it is time to write the code to identify the areas of a shop people are in with new videos. Download the “Retail_Store.mp4” video and save it in a new folder called “project”. Then, go into this folder.
Set up the script
Now that we have the video on which we want our model to run, we can begin writing the script that will track movement in the video. First, let’s install the required dependencies for this project and set up some global variables that we’ll use later in our script:
import os
import sys
import cv2
import time
import shutil
from PIL import Image
import io
import requests
from requests_toolbelt.multipart.encoder import MultipartEncoder


# User parameters
TO_PREDICT_PATH         = "./Images/Prediction_Images/To_Predict/"
PREDICTED_PATH          = "./Images/Prediction_Images/Predicted_Images/"
MIN_SCORE               = 0.5
ROBOFLOW_MODEL          = "MODEL_NAME/MODEL_VERSION"
ROBOFLOW_API_KEY        = "API_KEY"
Create different areas in the store
Next, we want to separate the store into five areas:
- Entrance
- Area 1
- Area 2
- Area 3
- Register
We are going to create lines between each section that are drawn on our videos so we can see how many people are in different areas of the store. Create a new Python script called "app.py". We'll be working in this file for the duration of this tutorial. Copy the code below into the app.py file:
import cv2


def draw_line(image, xf1, yf1, xf2, yf2):
	w = image.shape[1]
	h = image.shape[0]

	start_point = (int(w*xf1), int(h*yf1) )
	end_point = (int(w*xf2), int(h*yf2) )

	# Gets intercept
	slope = (yf2-yf1)/(xf2-xf1)
	b = yf1 - slope*xf1
	print("yf = " + str(round(slope, 3)) + "*xf + " + str(round(b,3)) )

	cv2.line(image, start_point, end_point, (255,0,0), 4)

image = cv2.imread("image.jpg")

w = image.shape[1]
h = image.shape[0]

draw_line(image, 0.00, 0.20, 0.10, 0.20) # Top-left line
draw_line(image, 0.10, 0.25, 0.55, 0.05) # Top-middle line
draw_line(image, 0.10, 0.25, 0.30, 0.80) # Left line
draw_line(image, 0.35, 0.15, 0.65, 0.45) # Middle Line
draw_line(image, 0.30, 0.80, 0.85, 0.25) # Bottom line
draw_line(image, 0.55, 0.05, 0.85, 0.25) # Right line

# X sections: 0.10, 0.30, 0.35, 0.55, 0.65, 0.85


cv2.imwrite("image-drawn.jpg", image)
This code will create six lines that divide the store into different areas. Five of the lines are used to create two boxes in the middle of the store. Each line corresponds to the position of the line we want to draw. You’ll need to copy the “image.jpg” file from the project Dropbox to run the code above.
The numbers used in the draw_line() function calls above are hard-coded. To draw these lines, the author of this project manually experimented with different values until the lines were drawn on the video. If you are trying this script on your own, you can open up the “image-drawn.jpg” file to see the results and tinker with the values until the lines are drawn in the right place.
The values above will work for the video accompanying this tutorial, but to draw lines on a different video you’ll need to experiment with the numbers above. You can increase or decrease the number of lines you draw based on your project, too. If you only had two sections, you may only need one line, for example.
The terminal output will show the points at which our lines are drawn:
yf = 0.0*xf + 0.2
yf = -0.444*xf + 0.294
yf = 2.75*xf + -0.025
yf = 1.0*xf + -0.2
yf = -1.0*xf + 1.1
yf = 0.667*xf + -0.317
The lines our program produces look like this:
Create labels for each section in the store
You may be wondering: where are the labels on the areas in the image? That’s a great question. Next, let’s draw labels inside both of the boxes we created. We can do so using the following code:
def writes_area_text(image, text, xf1, yf1):
	w = image.shape[1]
	h = image.shape[0]

	start_point = (int(w*xf1), int(h*yf1) )
	font = cv2.FONT_HERSHEY_SIMPLEX
	fontScale = 0.8
	color = (255,100,100)
	thickness = 2

	# Draws background text
	cv2.putText(image, text,
            	start_point, font, fontScale, (0,0,0), thickness+3)

	# Draws foreground text
	cv2.putText(image, text,
            	start_point, font, fontScale, color, thickness)

# X sections: 0.10, 0.30, 0.35, 0.55, 0.65, 0.85

# Writes text of each area
writes_area_text(image, "Register", 0.01, 0.25)
writes_area_text(image, "Area 2 (A2)", 0.20, 0.05)
writes_area_text(image, "Area 3 (A3)", 0.30, 0.40)
writes_area_text(image, "Entrance", 0.70, 0.80)
writes_area_text(image, "Area 1 (A1)", 0.60, 0.20)

cv2.imwrite("image-drawn.jpg", image)
Add the code above to your app.py file. This code creates five labels that are added to our image:
- Register: The location of the cash register.
- Area 1: The area to the right of the entrance.
- Area 2: The area at the back of the shop.
- Area 3: The area near the register, inclusive of some boxes where goods are sold.
- Entrance: The door where people enter.
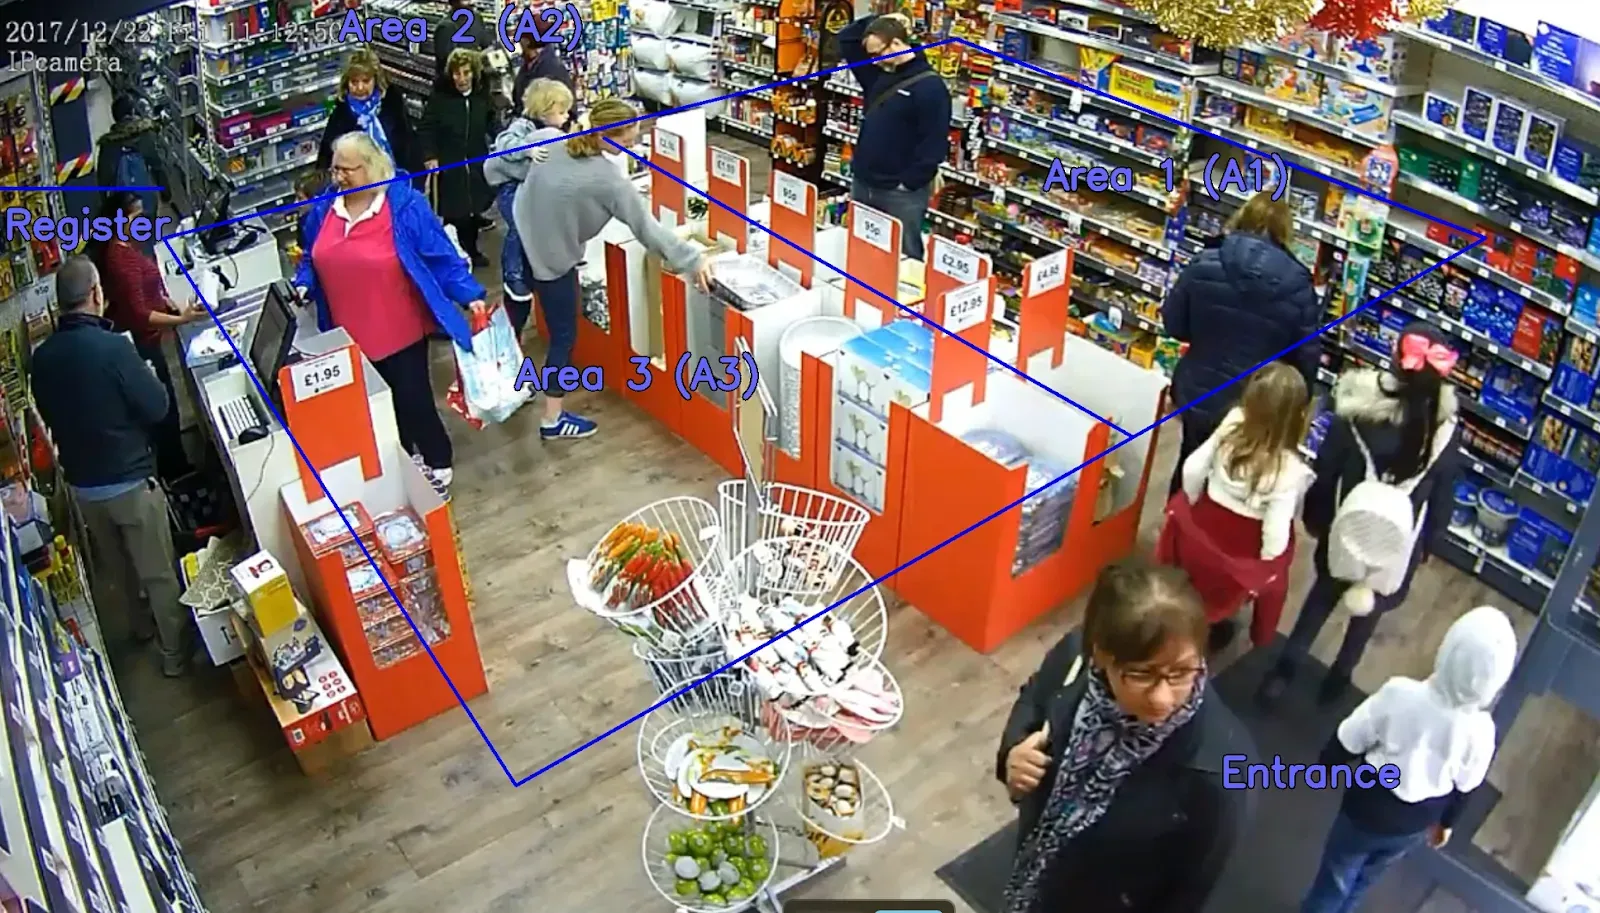
Our labels are in blue text to match the blue lines we created in the last section. Here are the labels added to an image:
Determine in what area a person is in an image
Using the equation we created earlier to create the two areas in the middle of the store (yf = m*xf+b), we can start to build logic that, given x and y positions of an object, calculates the area in the store where a person is situated.
Add the following function to the app.py script that we have been working on:
def which_area(image, midx, midy):

	w = image.shape[1]
	h = image.shape[0]
	xf = midx/w
	yf = midy/h

	# x sections
	x1, x2, x3, x4, x5, x6 = 0.10, 0.30, 0.35, 0.55, 0.65, 0.85

	# y (mx+b) equations that separate each section
	y1 = 0.0*xf + 0.2 # Top-left line
	y2 = -0.444*xf + 0.294 # Top-middle line
	y3 = 2.75*xf + -0.025 # Left line
	y4 = -1.0*xf + 1.1 # Bottom line
	y5 = 1.0*xf + -0.2 # Middle Line

	if xf <= x1:
    		if yf <= y1: # Top-left line
        		area = "A2"
    		else:
        		area = "Register"
	elif xf > x1 and xf <= x2:
    		if yf <= y2: # Top-middle line
        		area = "A2"
    		elif yf <= y3: # Left line
        		area = "A3"
    		else:
        		area = "Register"
	elif xf > x2 and xf <= x3:
    		if yf <= y2: # Top-middle line
        		area = "A2"
    		elif yf <= y4: # Bottom line
        		area = "Area 3"
    		else:
        		area = "Entrance"
	elif xf > x3 and xf <= x4:
    		if yf <= y2: # Top-middle line
        		area = "A2"
    		elif yf <= y5: # Middle Line
        		area = "A1"
    		elif yf <= y4: # Bottom line
        		area = "A3"
    		else:
        		area = "Entrance"
	elif xf > x4 and xf <= x5:
    		if yf <= y5: # Middle Line
        		area = "A1"
    		elif yf <= y4: # Bottom line
        		area = "A3"
    		else:
        		area = "Entrance"
	elif xf > x5 and xf <= x6:
    		if yf <= y4: # Bottom line
        		area = "A1"
    		else:
        		area = "Entrance"
		else:
    		area = "Entrance"

	return area
This code tells us in what area a person is given the coordinate fractions (xf1 = x_coordinate / width_image and yf1 = y_coordinate / width_image). If you were to use this project on videos taken in different locations, you would need to update the logic above to use the right area labels. The example above is convenient to illustrate this project and works for our video feed.
In the next section, we’ll look at how to retrieve information about where people are in an image or video using the Roboflow API. We will calculate how many people are in the different areas of the retail store we have created.
Infer the position of people in a video
Let’s suppose we have a folder of videos that contain archived surveillance footage that we want to use with our model. The code we have written so far only works on a single image, not a video. Thus, we will need to write code that:
- Loops through all of the videos on which we want to infer.
- Captures images of each frame in every video.
Once we have images of the frames in each video, we can send those images to the Roboflow Inference API. This API will return a JSON object with information about the location of people in our image. First, let’s write code that loops through each video and captures frames:
prev_coordinates = []
prev_prev_coordinates = []
prev_prev_prev_coordinates = []
ii = 0
# Goes through each video in TO_PREDICT_PATH
for video_name in os.listdir(TO_PREDICT_PATH):
	video_path = os.path.join(TO_PREDICT_PATH, video_name)

	video_capture = cv2.VideoCapture(video_path)

	# Video frame count and fps needed for VideoWriter settings
	frame_count = int(video_capture.get(cv2.CAP_PROP_FRAME_COUNT))
	video_fps = round( video_capture.get(cv2.CAP_PROP_FPS) )
	video_fps = int(video_fps)

	# If successful and image of frame
    success, image_b4_color = video_capture.read()

	fourcc = cv2.VideoWriter_fourcc(*'MP4V')
	video_out = cv2.VideoWriter(PREDICTED_PATH + video_name, fourcc, video_fps, (int(image_b4_color.shape[1]), int(image_b4_color.shape[0])))
Next, we need to write code that loads each image and infers the position of people in an image with the Roboflow API. In the code below, we’re going to create a loop that runs through each image we have captured and:
- Loads the image into a PIL object.
- Creates a JPEG version of the image.
- Sends a HTTP POST request to the Roboflow API to return predictions.
workers_in_frame_list = []
	count = 1
	while success:
    	success, image_b4_color = video_capture.read()
    	if not success:
        	break

    	# Inference through Roboflow section
    	# -----------------------------------------------------------------------------
    	# Load Image with PIL
    	image = cv2.cvtColor(image_b4_color, cv2.COLOR_BGR2RGB)
    	pilImage = Image.fromarray(image)

    	# Convert to JPEG Buffer
    	buffered = io.BytesIO()
    	pilImage.save(buffered, quality=100, format="JPEG")

    	# Construct the URL
    	upload_url = "".join([
        	"https://detect.roboflow.com/",
        	ROBOFLOW_MODEL,
        	"?api_key=",
        	ROBOFLOW_API_KEY,
        	"&confidence=",
        	str(MIN_SCORE)
        	# "&format=image",
        	# "&stroke=5"
    	])

    	# Build multipart form and post request
    	m = MultipartEncoder(fields={'file': ("imageToUpload", buffered.getvalue(), "image/jpeg")})

    	response = requests.post(upload_url,
                             	data=m,
                             	headers={'Content-Type': m.content_type},
                             	)

    	predictions = response.json()['predictions']
Draw lines on each frame
The frames that we have captured from our archived videos will not have the lines we drew earlier that show the different areas in the store. This is because we added the lines to a test image, rather than to all of our videos. We’ll need to add the lines at this stage.
For each image in every video, we need to create lines on the image to show the sections of the output video. You can do so using the following code:
    	# Creates lines on image
    	draw_line(image_b4_color, 0.00, 0.20, 0.10, 0.20) # Top-left line
    	draw_line(image_b4_color, 0.10, 0.25, 0.55, 0.05) # Top-middle line
    	draw_line(image_b4_color, 0.10, 0.25, 0.30, 0.80) # Left line
    	draw_line(image_b4_color, 0.35, 0.15, 0.65, 0.45) # Middle Line
    	draw_line(image_b4_color, 0.30, 0.80, 0.85, 0.25) # Bottom line
    	draw_line(image_b4_color, 0.55, 0.05, 0.85, 0.25) # Right line
Now we can use the inference data to create lists that include the coordinates of each prediction in our image:
    	# Creates lists from inferenced frames
    	coordinates = []
    	labels_found = []
    	for prediction in predictions:
        	x1 = int( prediction['x'] - prediction['width']/2 )
        	y1 = int( prediction['y'] - prediction['height']/2 )
        	x2 = int( prediction['x'] + prediction['width']/2 )
        	y2 = int( prediction['y'] + prediction['height']/2 )

        	coordinates.append([x1, y1, x2, y2, "section", 0])

        	midx = int(prediction['x'])
        	midy = int(prediction['y'])
The item labeled “section” is the area in which a person is located. The 0 value is the timer for how long that person has been in the video feed. 0 is the default value, but we’ll increment this over time as we start to run predictions on more images.
We’re going to copy the coordinates into new variables for later use:
    	# Saves current coordinates to previous for next frame
    	prev_prev_prev_coordinates = prev_prev_coordinates.copy()
    	prev_prev_coordinates = prev_coordinates.copy()
    	prev_coordinates = coordinates.copy()
Track the duration of time a person has spent in an area of the store
After each frame and after using the current coordinates as intended, we will store coordinates to be used to compare with the next video frame’s coordinates. These two frames’ coordinates will be compared to determine which bounding box belongs to which person.
If the current frame’s bounding box matches a previous frame’s bounding box and is in the same previous section, then we will add to the timer how long they have been there. A “match” occurs if the previous bounding box's x1 and y1 coordinates are within (frame_pixel_limiter = 40) pixels within each other. If not, then that bounding box’s timer resets.
Next, we are going to create the timer that tracks for how long someone has been in a specific area in the store. First, we will create a function that lets us check if a user is in a given range:
def object_match(coordinates, prev_coordinates):
	for prev_coordinate in prev_coordinates:
    	if coordinates[-1][4] == prev_coordinate[4]:
        	prev_x1 = prev_coordinate[0]
        	prev_y1 = prev_coordinate[1]
        	if (abs(x1-prev_x1) < frame_pixel_limiter
            	and abs(y1-prev_y1) < frame_pixel_limiter
            	):
            	coordinates[-1][5] = prev_coordinate[5] + 1/video_fps
      return coordinates[-1][5]
Now, we can use the following code to create a timer that tracks for how long a person has been in a given region:
        	# Finds which area the coordinates belong to
        	area = which_area(image_b4_color, midx, midy)
        	coordinates[-1][4] = area

        	# Checks to see if previous bounding boxes match with current ones
        	#  If so, then adds to timer
        	frame_pixel_limiter = 40
        	coordinates[-1][5] = object_match(coordinates, prev_coordinates)

        	# If didn't catch any matching, then checks 2 frames ago
        	if coordinates[-1][5] == 0:
            	coordinates[-1][5] = object_match(coordinates, prev_prev_coordinates)

        	# If didn't catch any matching, then checks 3 frames ago
        	if coordinates[-1][5] == 0:
            	coordinates[-1][5] = object_match(coordinates, prev_prev_prev_coordinates)


        	# Draws text above person of what area they are in
        	text = area + ": {} sec".format(round(coordinates[-1][5],1))
        	start_point = ( x1, max(y1-5, 20) )
        	color = (125, 0, 255)
        	font = cv2.FONT_HERSHEY_SIMPLEX
        	fontScale = 0.60
        	thickness = 2
        	cv2.putText(image_b4_color, text, start_point,
                    	font, fontScale, (0,0,0), thickness+1)
        	cv2.putText(image_b4_color, text, start_point,
                    	font, fontScale, color, thickness)

        	# Draws bounding box
        	cv2.rectangle(image_b4_color, (x1, y1), (x2, y2), color, 1)
We now have a working timer that tracks how long people are in each section in a store. But, we haven’t yet added the labels for each area to the images in our videos. Let’s do that now:
    	# Writes text of each area
    	writes_area_text(image_b4_color, "Register", 0.01, 0.25)
    	writes_area_text(image_b4_color, "Area 2 (A2)", 0.20, 0.05)
    	writes_area_text(image_b4_color, "Area 3 (A3)", 0.30, 0.40)
    	writes_area_text(image_b4_color, "Entrance", 0.70, 0.80)
    	writes_area_text(image_b4_color, "Area 1 (A1)", 0.60, 0.20)


    	# Saves current coordinates to previous for next frame
    	prev_prev_prev_coordinates = prev_prev_coordinates.copy()
    	prev_prev_coordinates = prev_coordinates.copy()
    	prev_coordinates = coordinates.copy()
Writes section area to video output and saves coordinates for next frame
Save each image to the video output
We’ll wrap up our script by writing the image in the video output. We’ll also display the FPS and the expected time remaining so that we have a visual indicator as to how long it will take to finish on our videos:
    	# Saves video with bounding boxes
    	video_out.write(image_b4_color)


    	# Prints out how fast video is inferencing and how much time left
    	# ---------------------------------------------------------------------
    	tenScale = 10
    	ii += 1
    	if ii % tenScale == 0:
        	fps_end_time = time.time()
        	fps_time_lapsed = fps_end_time - fps_start_time
        	fps = round(tenScale/fps_time_lapsed, 2)
        	time_left = round( (frame_count-ii)/fps )

        	mins = time_left // 60
        	sec = time_left % 60
        	hours = mins // 60
        	mins = mins % 60

        	sys.stdout.write('\033[2K\033[1G')
        	print("  " + str(ii) + " of "
              	+ str(frame_count),
              	"-", fps, "FPS",
              	"-", "{}m:{}s".format(int(mins), round(sec) ),
              	end="\r", flush=True
              	)
        	fps_start_time = time.time()

    	count += 1
    	# If you want to stop after so many frames to debug, uncomment below
    	if count == 100:
        	break

	video_out.release()


print("\nDone!")
That was a lot of coding, but now we’re done and ready to test our script. Run the following command in your terminal:
python3 app.pyFor each video in the TO_PREDICT_PATH folder that we specified at the beginning of this tutorial, the script will:
- Split up the video into frames.
- Call the Roboflow API to find the location of people in each frame.
- Draw lines and labels to represent different sections of the store.
- Keep track of how long each person has been in a section of the store.
- Adds a timer of how long each person has been in a section to the frame.
- Create a new video that merges all of these frames together.
When you run the script, you should see a video that shows the following annotations:
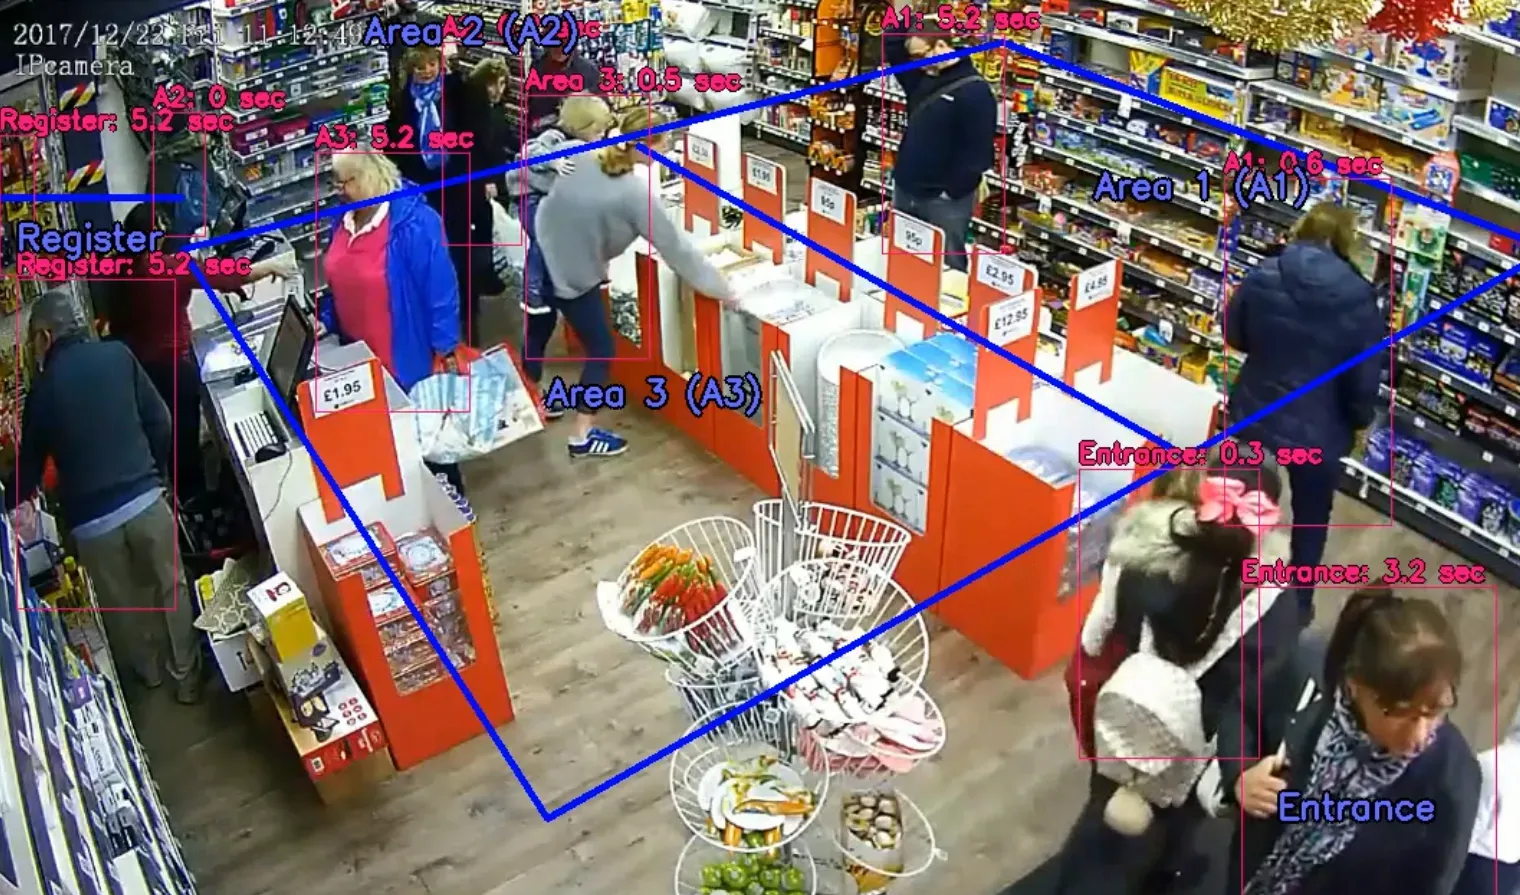
In the above image, the duration of each person’s stay in various sections of the store are now annotated above the bounding boxes that show where people are in the video.
Monitor Movement with Computer Vision in Retail Stores
In this tutorial, we have successfully created a tool that monitors movement in retail stores and tracks for how long people stay in different areas of a store.
There are many practical applications of this technology. If a supermarket finds that people spend a lot of time in the fruit part of a store and the area regularly becomes congested, they could consider allocating more space in their store to that area. If a supermarket notices that someone has been waiting at a checkout for more than five minutes, another person could be called to open a checkout to reduce waiting times.
Our model could be deployed across many different cameras in a store, each pointed at different areas. For example, there could be a camera in an electronics department that has a games region and a televisions region. This information could be aggregated with different cameras to present a complete picture about how much time people spend in different areas of s tore.
Now you have the skills you need to track movement between different regions in a retail store using computer vision. Ready to understand shopper behavior in your store? Upload your retail footage to Roboflow and start building a custom people-tracking model today. Try it for free.
This article was contributed to the Roboflow blog by Troy Pena.
Cite this Post
Use the following entry to cite this post in your research:
James Gallagher. (Dec 22, 2022). Monitor Movement in Retail Stores with Computer Vision. Roboflow Blog: https://blog.roboflow.com/monitor-movement-in-retail-stores/