
Early detection and diagnosis of diseases affecting plant leaves can significantly reduce crop losses and improve productivity in agricultural environments. In this project, we use computer vision to predict tomato leaf diseases.
In this blog post I will guide you through how to build a robust object detection model using Roboflow, which is trained to identify and classify various diseases affecting tomato leaves.
The user interface for our application is designed using the Panel Python library, providing an intuitive and interactive experience for users to upload images of tomato leaves and receive immediate diagnostic results with the help of LLM (i.e. GPT-3.5/GPT-4/GPT-4o). The application that we will develop, aims to assist farmers and agricultural professionals in monitoring and managing the health of their tomato crops efficiently.
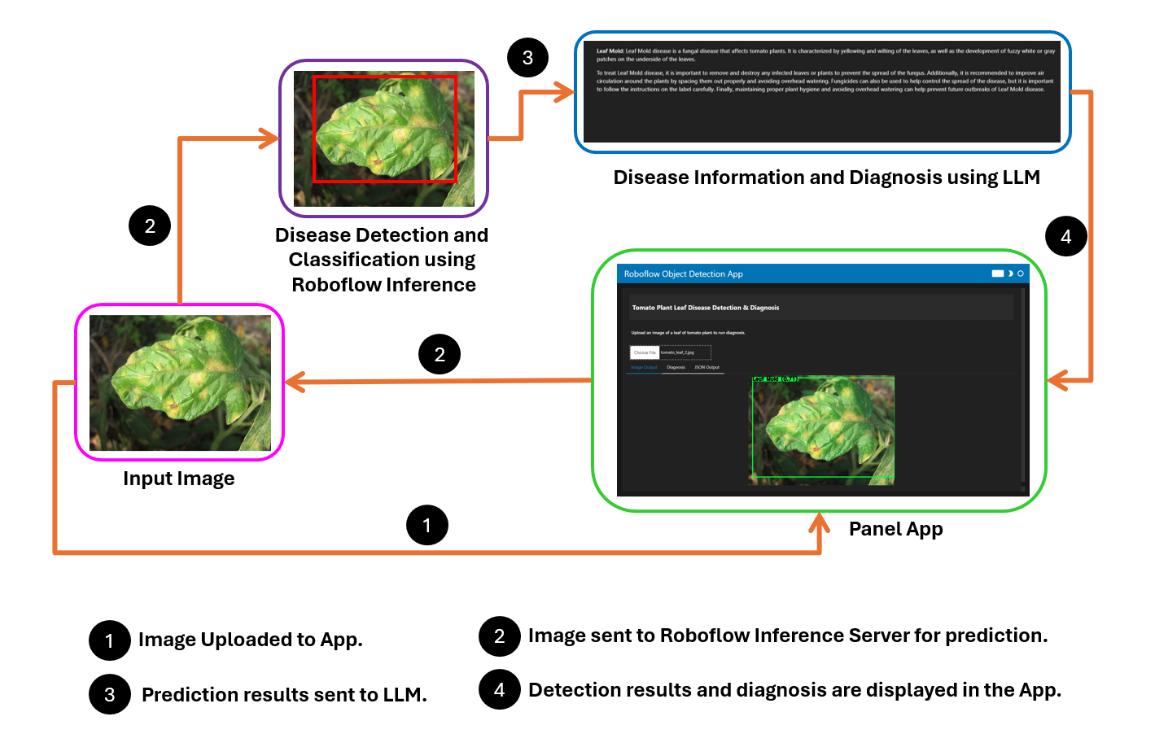
How the System Works
The project works by capturing an image of a tomato leaf using a webcam. This image is then sent to a computer vision model deployed on the Roboflow inference server for analysis.
Once the model processes the image, it returns the prediction results to the application. These results are subsequently sent to a large language model (LLM) to provide a detailed diagnosis. Finally, the diagnosis is displayed to the farmer, who can use this information to take appropriate actions for crop management.
Steps for building the project
Here are the steps I followed to build the Tomato Leaf Disease Prediction project:
- Collect dataset and train a Computer Vision Model
- Create the Inference Script
- Draw Bounding Box and Display Prediction
- Send Data to LLM for Diagnosis and Display Diagnosis
- Create the UI of the App
Step #1: Collect dataset and train a computer vision model
In this step we will build the object detection model using Roboflow. You can create and host a computer vision model using Roboflow by following the getting started guide.
For our example in this blog post, we'll use the pretrained Tomato Leaf Disease Computer Vision model API from the Roboflow universe. The dataset for this project comprises over 20,000 images, which are divided into training, validation, and test sets as illustrated in the image below.
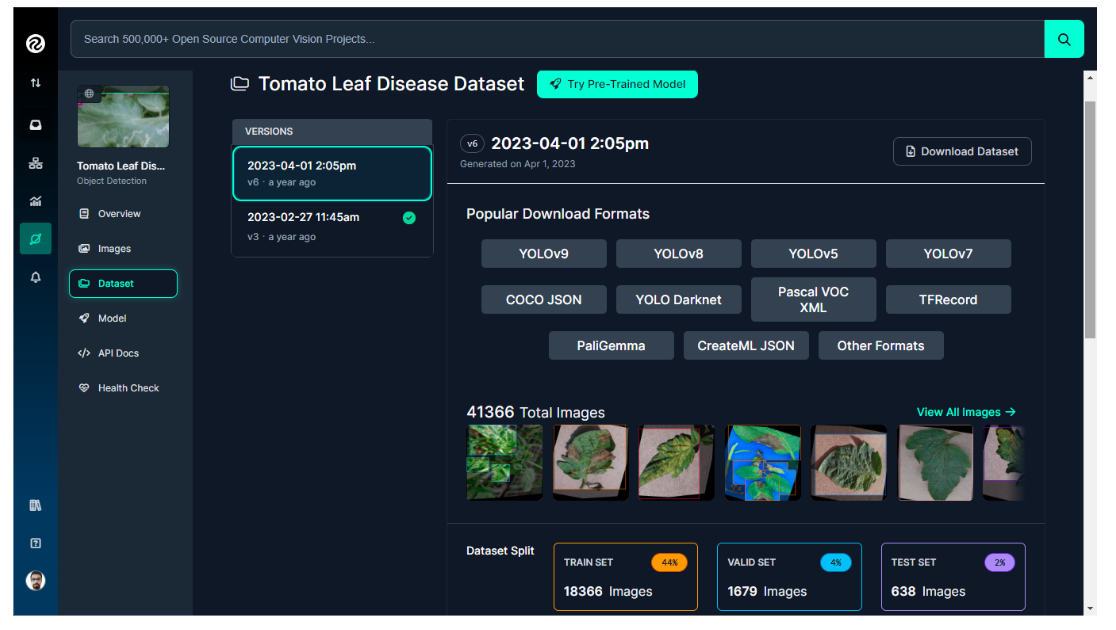
The dataset contains images of plant leaves, including both healthy leaves and various types of leaf diseases that can affect tomato plants, as listed below.
- Bacterial Spot
- Early Blight
- Healthy
- Iron Deficiency
- Late Blight
- Leaf Mold
- Leaf Miner
- Mosaic Virus
- Septoria
- Spider Mites
- Yellow Leaf Curl Virus
All of these classes are labeled using the Roboflow annotation tool for object detection, as illustrated in the image below.

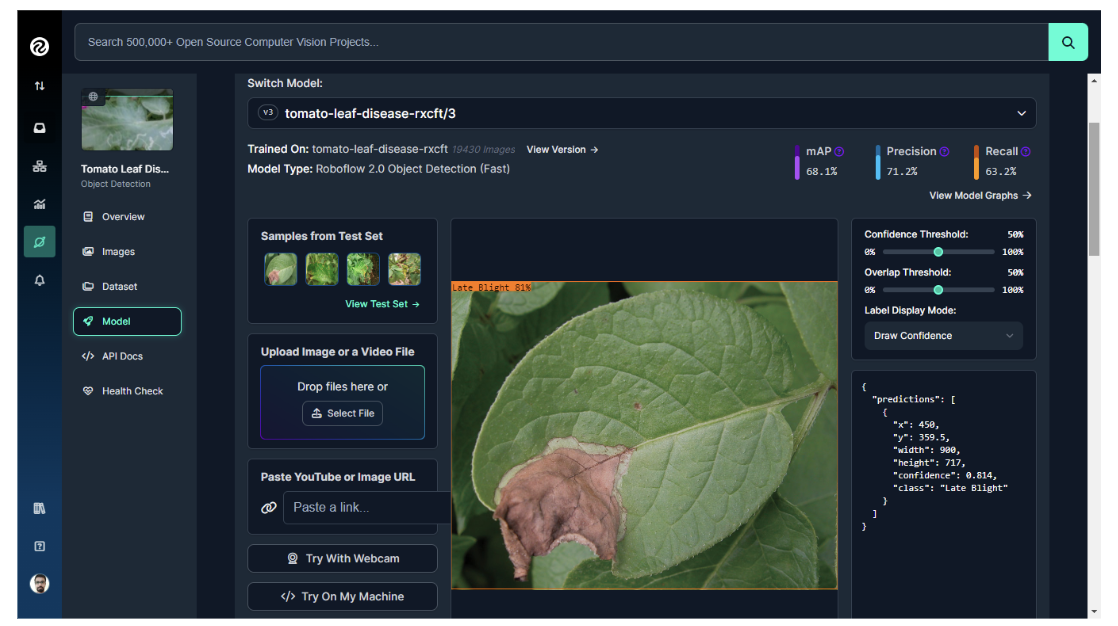
The model for this project was trained using Roboflow, achieving a mean Average Precision (mAP) of 68.1%, a Precision of 71.2%, and a Recall of 63.2%.
Step #2: Create the Inference Script
In this step we will write an inference script which uses Roboflow inference-sdk. To write the inference script for our project we will first include the library
from inference_sdk import InferenceHTTPClient
then initialize the client
# Initialize the InferenceHTTPClient
CLIENT = InferenceHTTPClient(
    api_url="https://detect.roboflow.com",
    api_key="YOUR_ROBOFLOW_API_KEY"
)
You will require the Roboflow API key for this step.
Then define the get_predictions() function to infer on the image:
def get_predictions(image_path):
    result = CLIENT.infer(image_path, model_id=MODEL_ID)
    return result
Step #3: Draw bounding boxes and display predictions
In this step, we will define the draw_bounding_boxes() function, which will draw bounding boxes on the resulting image along with the detected class labels and confidence scores.
def draw_bounding_boxes(image_path, predictions):
    image = cv2.imread(image_path)
    if image is None:
        print(f"Error: Unable to load image at {image_path}")
        return None

    for prediction in predictions['predictions']:
        x, y, w, h = (
            int(prediction['x']),
            int(prediction['y']),
            int(prediction['width']),
            int(prediction['height']),
        )
        start_point = (x - w // 2, y - h // 2)
        end_point = (x + w // 2, y + h // 2)
        color = (0, 255, 0)
        thickness = 2
        cv2.rectangle(image, start_point, end_point, color, thickness)

        # Add label and confidence
        label = f"{prediction['class']} ({prediction['confidence']:.2f})"
        label_size, _ = cv2.getTextSize(label, cv2.FONT_HERSHEY_SIMPLEX, 0.5, 2)
        label_start_point = (start_point[0], start_point[1] - 10 if start_point[1] - 10 > 10 else start_point[1] + 10)
        cv2.rectangle(image, (label_start_point[0], label_start_point[1] - label_size[1]),
                      (label_start_point[0] + label_size[0], label_start_point[1]), color, cv2.FILLED)
        cv2.putText(image, label, (label_start_point[0], label_start_point[1] - 2),
                    cv2.FONT_HERSHEY_SIMPLEX, 0.5, (0, 0, 0), 2)

    return image
Next, define the infer_and_display() function. This function obtains predictions for the given image using the get_predictions() function and prints these predictions. It then draws bounding boxes on the image based on the predictions using the draw_bounding_boxes() function. Finally, it encodes the resulting image to PNG format, converts it to a PIL image, and returns the predictions along with a Panel PNG pane for displaying the image with the bounding boxes.
Step #4: Send data to LLM for diagnosis
Now, we will send the prediction data to an LLM to obtain the diagnostic action points. Since LLMs are already trained on such data, we can utilize them without fine-tuning. In this example, we will use the GPT-3.5 engine from OpenAI, which is freely available. However, you can opt for any other LLM. To use GPT-3.5, first include the required library.
from openai import OpenAI

then create GPT client
clientgpt = OpenAI(
    # This is the default and can be omitted
    api_key=os.environ.get("OPENAI_API_KEY", "YOUR_OpenAI_KEY"),
)

And then define the function to get the results.
def get_diagnosis(disease):
    try:
        response = clientgpt.chat.completions.create(
            model="gpt-3.5-turbo",
            messages=[
                {"role": "user", "content": f"Tomato leaf has detected {disease} disease. What is it? What treatment should be given?"}
            ],
            temperature=0,
        )
        return response.choices[0].message.content
    except Exception as e:
        return f"Error: {str(e)}"
In the above code, I used the following prompt, which you can customize as needed.
messages=[
  {"role": "user", "content": f"Tomato leaf has detected {disease} disease. What is it? What treatment should be given?"}
]
Step #5: Create the application interface
Finally, we will design the user interface for our app using the Panel library, a powerful Python framework for data exploration and web applications. Panel offers various UI components that we can use to create a robust app for our computer vision applications.
To use Panel, first install it:
pip install panel
Then, import the library with following statement in your code.
import panel as pn
Now we write the code to create a user interface for our App. The UI includes the following components:
- Header: A styled HTML pane displaying the app's title.
- Upload Label: A Markdown pane prompting users to upload an image of a tomato plant leaf.
- File Input: A widget allowing users to upload image files with .jpg, .jpeg, or .png extensions.
- Panel Image: A column pane for displaying the processed image and results.
The main app layout combines these components into a column and sets up the Panel extension and template for displaying the app with a dark theme.
Components Used:
- pn.pane.HTML for the header.
- pn.pane.Markdown for the upload instruction.
- pn.widgets.FileInput for file upload.
- pn.Column for organizing the layout.
- pn.template.FastListTemplate for the overall app template.
Following is the code.
header = pn.pane.HTML(
    "<div style='color: #f7f7f7; background-color: #2b2b2b; padding: 10px; border-radius: 5px;'>"
    "<h2>Tomato Plant Leaf Disease Detection & Diagnosis</h2>"
    "</div>",
    sizing_mode='stretch_width'
)

upload_label = pn.pane.Markdown("**Upload an image of a leaf of tomato plant to run diagnosis.**", sizing_mode='stretch_width')

file_input = pn.widgets.FileInput(accept=".jpg,.jpeg,.png")
file_input.param.watch(upload_and_infer, 'value')

panel_image = pn.Column(sizing_mode='stretch_both')

app = pn.Column(
    header,
    upload_label,
    file_input,
    panel_image,
    css_classes=['app-container'],
    sizing_mode='stretch_both'
)

pn.extension(sizing_mode='stretch_both')

pn.template.FastListTemplate(
    title="Roboflow Object Detection App",
    main=[app],
    theme="dark"
).servable()
Additionally, the code below updates the panel_image pane by clearing its contents and then adding a tabbed interface. The tabs include:
- Image Output: Displays the processed image (image_pane).
- Diagnosis: Shows the diagnostic text (diagnosis_text).
- JSON Output: Provides the prediction data in JSON format (prediction_text).
- Each tab is set to stretch both horizontally and vertically to fit the available space.
The component pn.Tabs used for designing the tabbed interface which contains:
- image_pane for the processed image.
- diagnosis_text for the diagnostic information.
- prediction_text for the JSON output.
panel_image.clear()
panel_image.append(pn.Tabs(
    ("Image Output", image_pane),
    ("Diagnosis", diagnosis_text),
    ("JSON Output", prediction_text),
    sizing_mode='stretch_both'
))
Putting it all together, the complete code for this App is as follows.
from openai import OpenAI
import cv2
import numpy as np
import panel as pn
from PIL import Image
import io
from inference_sdk import InferenceHTTPClient
import json
import os

# Initialize the InferenceHTTPClient
CLIENT = InferenceHTTPClient(
    api_url="https://detect.roboflow.com",
    api_key="YOUR_ROBOFLOW_API_KEY"
)

MODEL_ID = "tomato-leaf-disease-rxcft/3"  # Replace with your actual model ID

# Initialize OpenAI API client
clientgpt = OpenAI(
    # This is the default and can be omitted
    api_key=os.environ.get("OPENAI_API_KEY", "YOUR_OpenAI_API_KEY"),
)

def get_predictions(image_path):
    result = CLIENT.infer(image_path, model_id=MODEL_ID)
    return result

def draw_bounding_boxes(image_path, predictions):
    image = cv2.imread(image_path)
    if image is None:
        print(f"Error: Unable to load image at {image_path}")
        return None

    for prediction in predictions['predictions']:
        x, y, w, h = (
            int(prediction['x']),
            int(prediction['y']),
            int(prediction['width']),
            int(prediction['height']),
        )
        start_point = (x - w // 2, y - h // 2)
        end_point = (x + w // 2, y + h // 2)
        color = (0, 255, 0)
        thickness = 2
        cv2.rectangle(image, start_point, end_point, color, thickness)

        # Add label and confidence
        label = f"{prediction['class']} ({prediction['confidence']:.2f})"
        label_size, _ = cv2.getTextSize(label, cv2.FONT_HERSHEY_SIMPLEX, 0.5, 2)
        label_start_point = (start_point[0], start_point[1] - 10 if start_point[1] - 10 > 10 else start_point[1] + 10)
        cv2.rectangle(image, (label_start_point[0], label_start_point[1] - label_size[1]),
                      (label_start_point[0] + label_size[0], label_start_point[1]), color, cv2.FILLED)
        cv2.putText(image, label, (label_start_point[0], label_start_point[1] - 2),
                    cv2.FONT_HERSHEY_SIMPLEX, 0.5, (0, 0, 0), 2)

    return image

def infer_and_display(image_path):
    predictions = get_predictions(image_path)

    # Print the predictions
    print("Predictions:", predictions)

    result_image = draw_bounding_boxes(image_path, predictions)
    if result_image is None:
        print("Error: Result image is None after drawing bounding boxes.")
        return predictions, None

    _, buffer = cv2.imencode('.png', result_image)
    image_pil = Image.open(io.BytesIO(buffer.tobytes()))
    return predictions, pn.pane.PNG(image_pil, sizing_mode='stretch_both')


def get_diagnosis(disease):
    try:
        response = clientgpt.chat.completions.create(
            model="gpt-3.5-turbo",
            messages=[
                {"role": "user", "content": f"Tomato leaf has detected {disease} disease. What is it? What treatment should be given?"}
            ],
            temperature=0,
        )
        return response.choices[0].message.content
    except Exception as e:
        return f"Error: {str(e)}"


def upload_and_infer(event):
    uploaded_image_path = file_input.filename
    with open(uploaded_image_path, 'wb') as f:
        f.write(file_input.value)
    predictions, image_pane = infer_and_display(uploaded_image_path)
    if image_pane is None:
        prediction_text = pn.pane.Markdown("**Error:** Unable to display result image.")
    else:
        # Format JSON result with colors and add scrollbars
        formatted_predictions = json.dumps(predictions, indent=2)
        colorful_predictions = f'<pre style="color: #f7f7f7; background-color: #272822; padding: 10px; border-radius: 5px; overflow: auto; max-height: 400px;">{formatted_predictions}</pre>'
        prediction_text = pn.pane.HTML(colorful_predictions, sizing_mode='stretch_both')

        # Extract disease names for diagnosis suggestions
        diseases = {pred['class'] for pred in predictions['predictions']}
        diagnosis_suggestions = []
        for disease in diseases:
            diagnosis = get_diagnosis(disease)
            diagnosis_suggestions.append(f"**{disease}:** {diagnosis}")

        diagnosis_text = pn.pane.Markdown("\n\n".join(diagnosis_suggestions), sizing_mode='stretch_both')

    panel_image.clear()
    panel_image.append(pn.Tabs(
        ("Image Output", image_pane),
        ("Diagnosis", diagnosis_text),
        ("JSON Output", prediction_text),
        sizing_mode='stretch_both'
    ))


header = pn.pane.HTML(
    "<div style='color: #f7f7f7; background-color: #2b2b2b; padding: 10px; border-radius: 5px;'>"
    "<h2>Tomato Plant Leaf Disease Detection & Diagnosis</h2>"
    "</div>",
    sizing_mode='stretch_width'
)

upload_label = pn.pane.Markdown("**Upload an image of a leaf of tomato plant to run diagnosis.**", sizing_mode='stretch_width')

file_input = pn.widgets.FileInput(accept=".jpg,.jpeg,.png")
file_input.param.watch(upload_and_infer, 'value')

panel_image = pn.Column(sizing_mode='stretch_both')

app = pn.Column(
    header,
    upload_label,
    file_input,
    panel_image,
    css_classes=['app-container'],
    sizing_mode='stretch_both'
)

pn.extension(sizing_mode='stretch_both')

pn.template.FastListTemplate(
    title="Roboflow Object Detection App",
    main=[app],
    theme="dark"
).servable()
To run the application, save the script as panel_app.py and run it using Python.
python panel_app.py
We can serve the app with the following command:
panel serve panel_app.py
You can access the app by opening your web browser and go to the address provided by the Panel server (usually http://localhost:5006/panel_app).
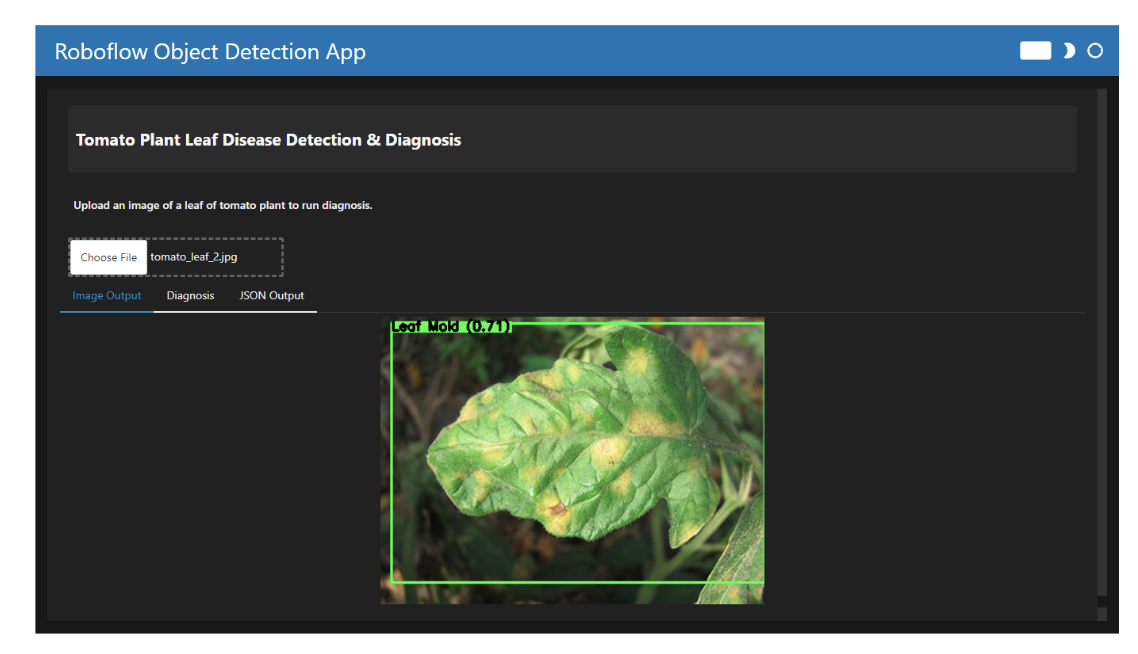
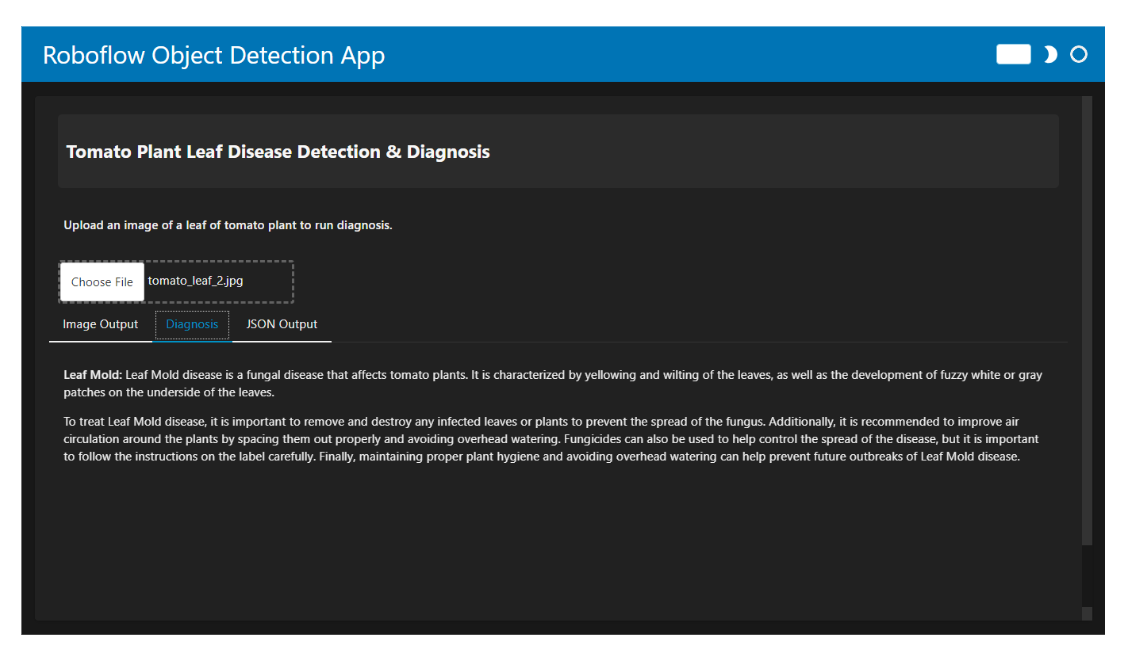
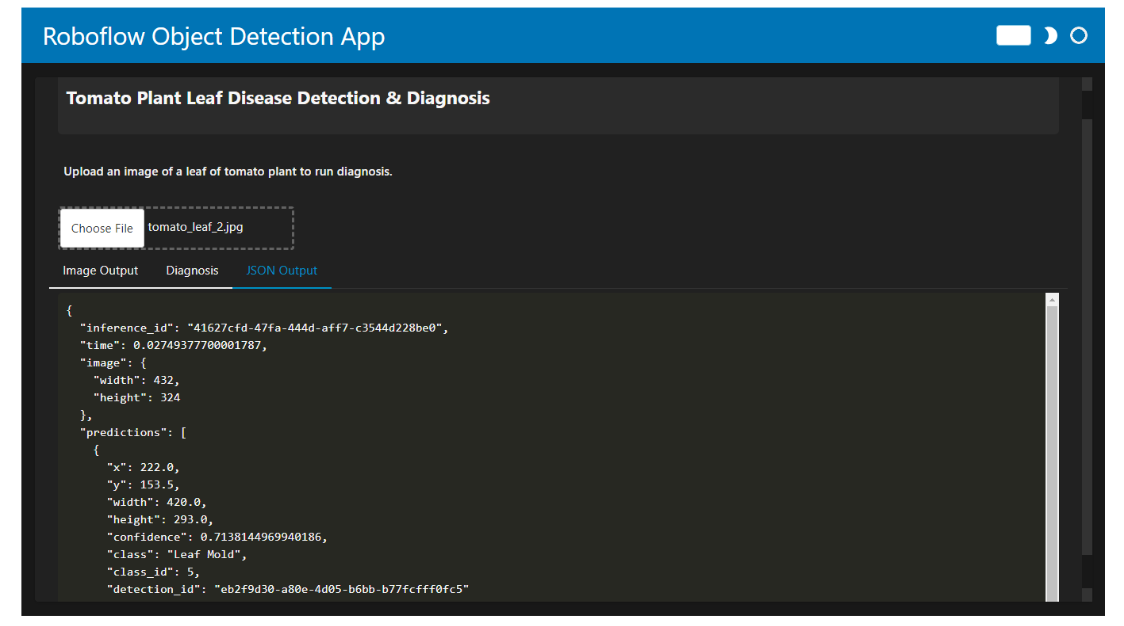
When you run the code, the app allows you to upload an image of a tomato plant leaf. The output is displayed in three different tabs:
- Image Output: Displays the predicted disease with a bounding box around the affected area.
- Diagnosis: Provides information for the detected disease and suggested treatments.
- JSON Output: Shows the predictive data in JSON format.
Conclusion
In this project, we have learnt how to build a web application using the Panel library for python for our computer vision model trained using Roboflow. The application helps in the detection and diagnosis of tomato leaf diseases using the Roboflow inference API and OpenAI's GPT-3.5 API.
We integrated a user-friendly interface to upload images, display detected diseases with bounding boxes, and provide actionable insights. Through this project, we learned how to combine computer vision, AI-powered diagnostics, and interactive web interfaces to create a robust plant health monitoring tool. The advantages include real-time plant leaf disease detection, comprehensive treatment advice, and accessibility across devices to enhance agricultural productivity and plant disease management.
Cite this Post
Use the following entry to cite this post in your research:
Timothy M. (Jul 19, 2024). Tomato Leaf Disease Detection and Diagnosis using Computer Vision. Roboflow Blog: https://blog.roboflow.com/tomato-leaf-disease-diagnosis/