At Roboflow, we see everyday that well-annotated datasets are at the heart of an effective computer vision model. For larger scale projects that involve annotating thousands of images across multiple teammates, understanding how the annotation process is progressing helps manage large scale labeling efforts.
Part of coordinating a robust annotation process involves reviewing images and providing feedback, for which we have commenting and review functionality to assist. Now, we have features to show you statistics about your annotation process and see a history of changes to images.
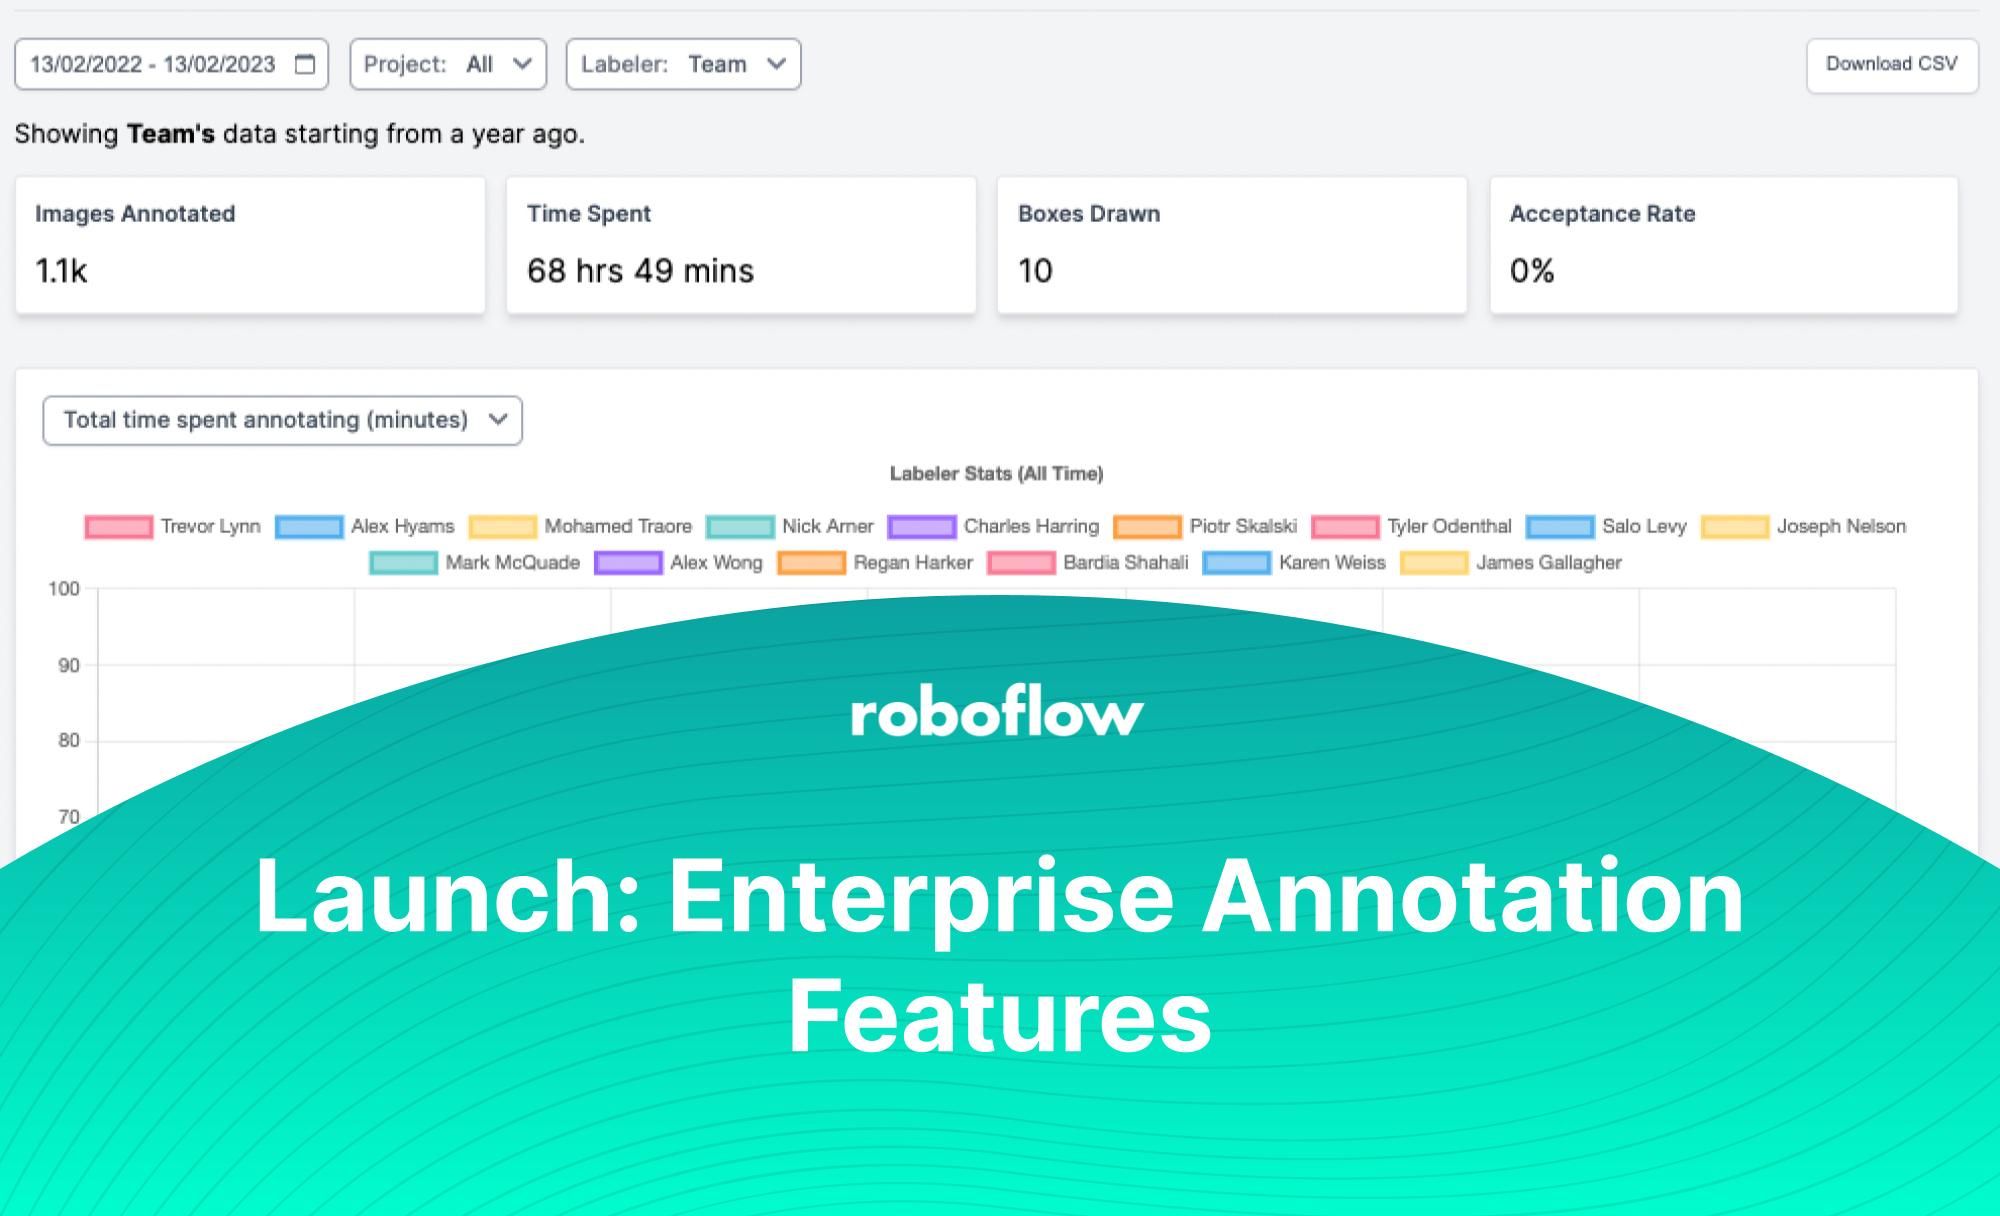
Today we are announcing the launch of our new Annotation Insights tab on the Roboflow dashboard and History within in the image annotation view.
In this guide, we’re going to show how to use the new Annotation Insights tab and access annotation History for images. Let’s get started.
Annotation Insights
The Annotation Insights page enables new understanding of how an annotation team is working toward building a dataset. This page shows:
- How many images have been annotated;
- The time spent labeling;
- How many bounding boxes have been drawn and;
- The rate at which annotations are accepted.
These statistics are plotted over time. You can review each of these numbers for specific periods of time.
Access the Annotation Insights Tab
To access the annotation insights tab, navigate to your workspace homepage on the Roboflow dashboard. Click “Settings”. Then, click “Annotation Insights” in the dropdown menu.
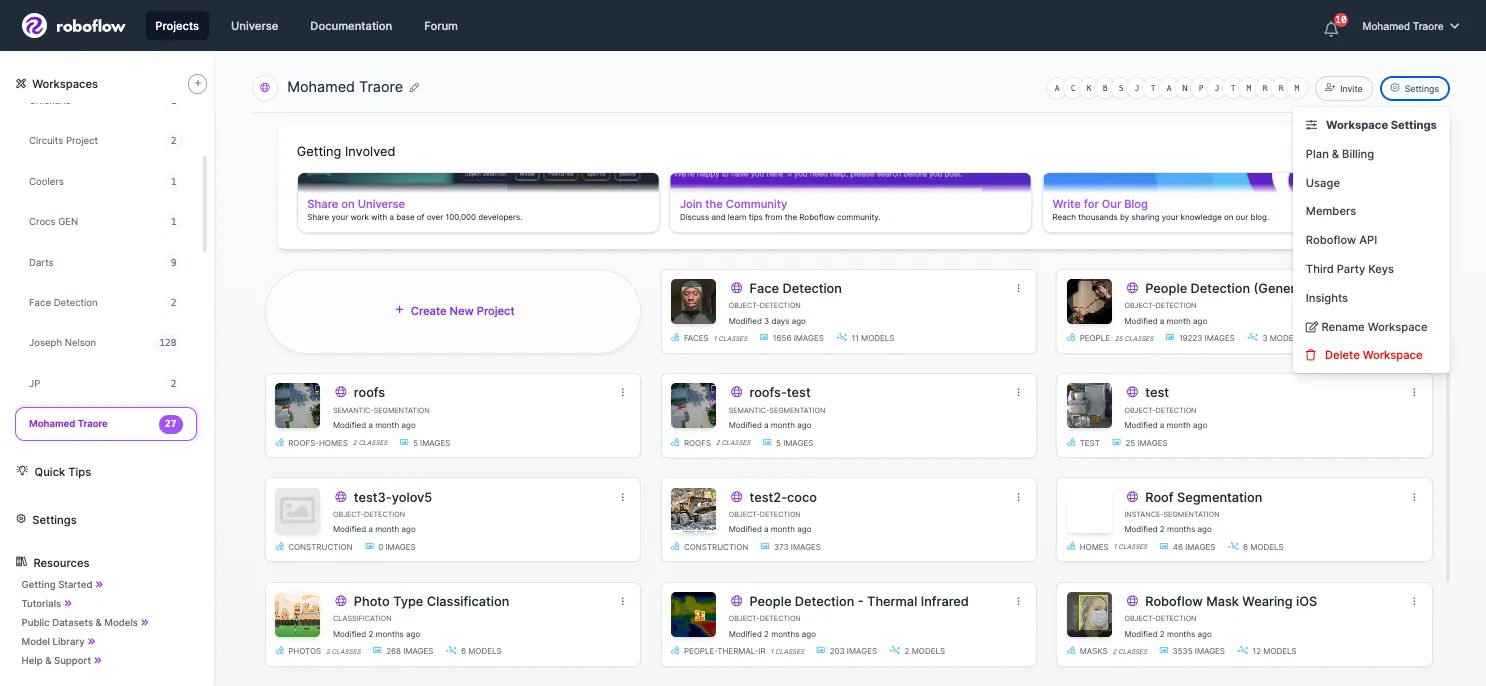
You can also access the tab from the Settings page. Click the name of your workspace in the sidebar and then the “Annotation Insights” link:

Reviewing Annotation Statistics
By default, the Annotation Insights tab shows the total time spent annotating images (in minutes) for each team member over the last year. You can also view images labeled, how many bounding boxes have been created, and the rate at which image annotations are accepted into your project dataset by a manager.
The following chart shows how many minutes were spent annotating by each team member in a workspace:
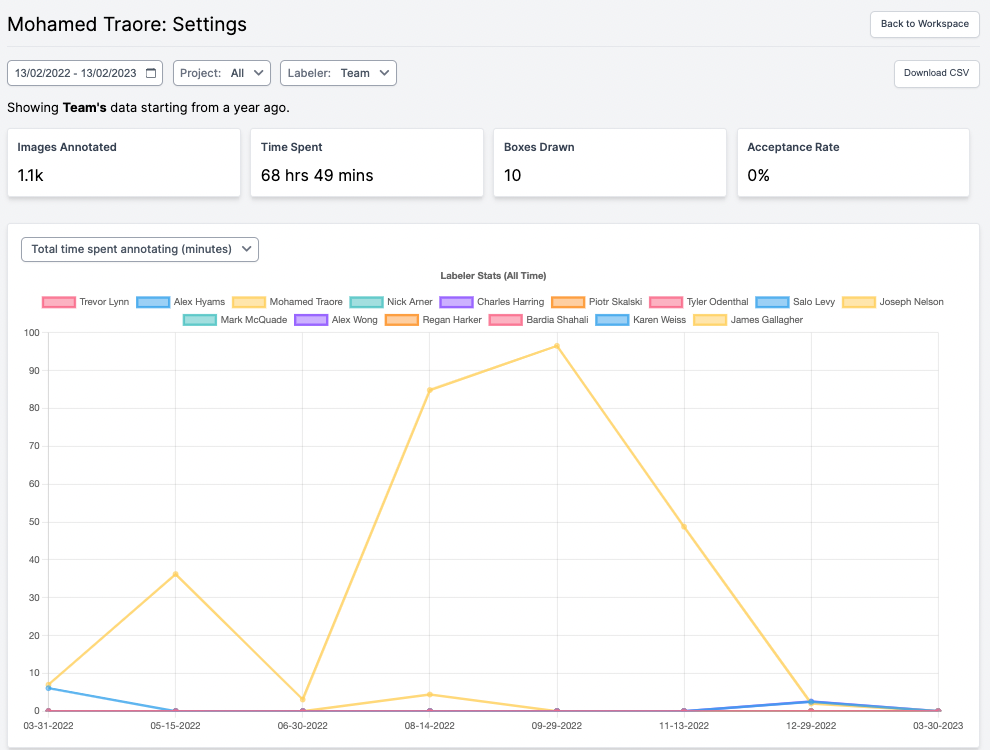
This page is showing annotation statistics for all projects and annotators over the last year.
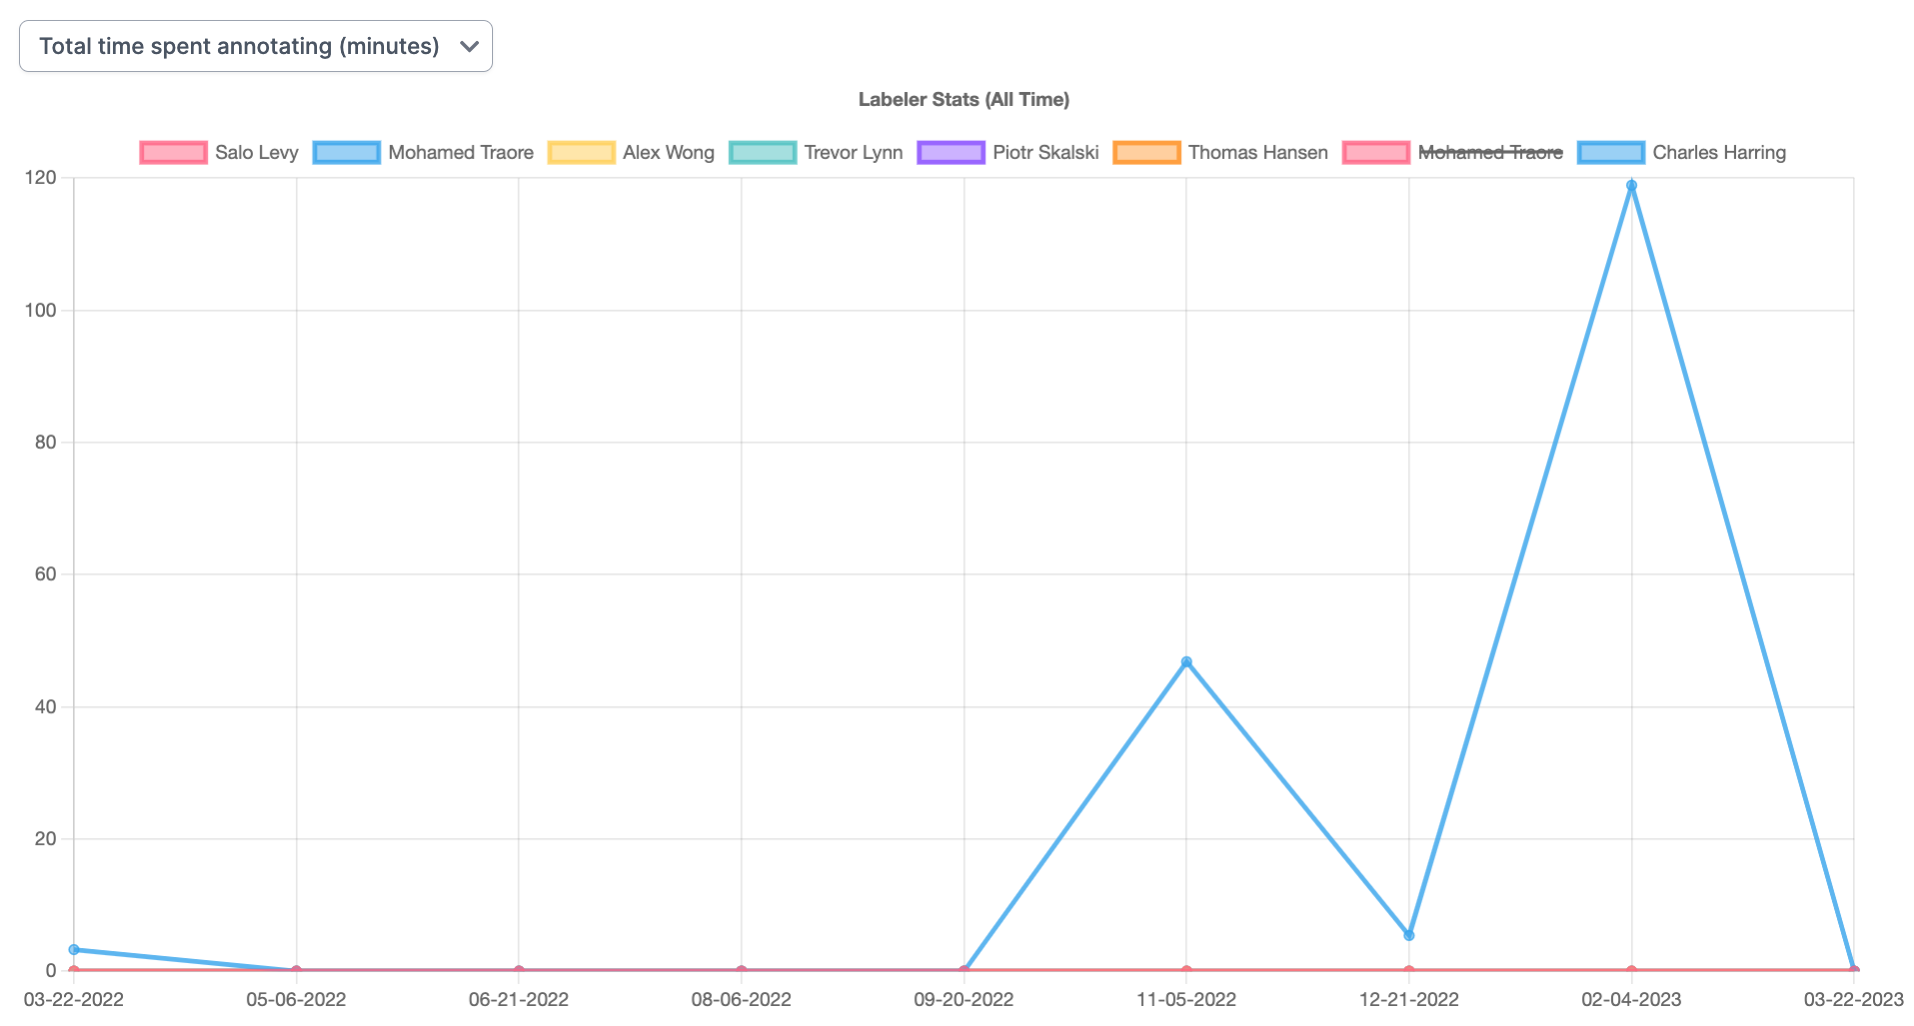
You can exclude people from your analysis by clicking on a team member’s name. For example, clicking on “Mohamed” in this chart removes his annotation contributions from the chart:
You can also narrow down your focus with three filters:
- Date: Select the time range for which you want to view insights.
- Project: View annotation statistics for a specific project in your Workspace.
- Labeler: Review annotation statistics for an individual team member.
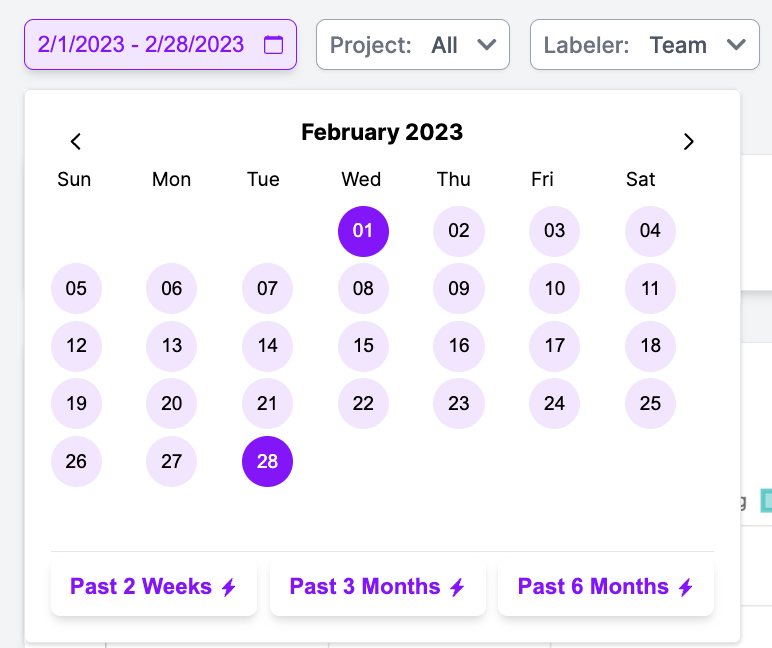
Let's see we show how many bounding boxes were drawn by Mohamed in the period between February 1st and February 28th 2023. First, we need to click on the Date form field to set the date:
With the insights available on this page, you can:
- Monitor how annotation time changes when you set new requirements for annotation;
- Find out how image acceptance rate changes before and after providing feedback to an annotator;
- Learn who on your team is the most efficient at annotating;
- And more.
The information you learn from Insights can help inform changes to your annotation process.
For example, if you see annotation time goes up when you set a new project requirement, you can consider adding a new member to the team to help you meet your deadlines. If you see that the number of boxes drawn have gone down after adding a new source of data to your project, you may want to dig deeper to understand whether the data collected meets your requirements.
View Annotation History
Roboflow Annotate now maintains a history of all the changes made to an image. With this feature, you can see when changes were made to an image and review how an image looked at different points in time in your dataset.
To access the annotation history associated with an image, click on the “History” tab in the left sidebar in our annotation tool:
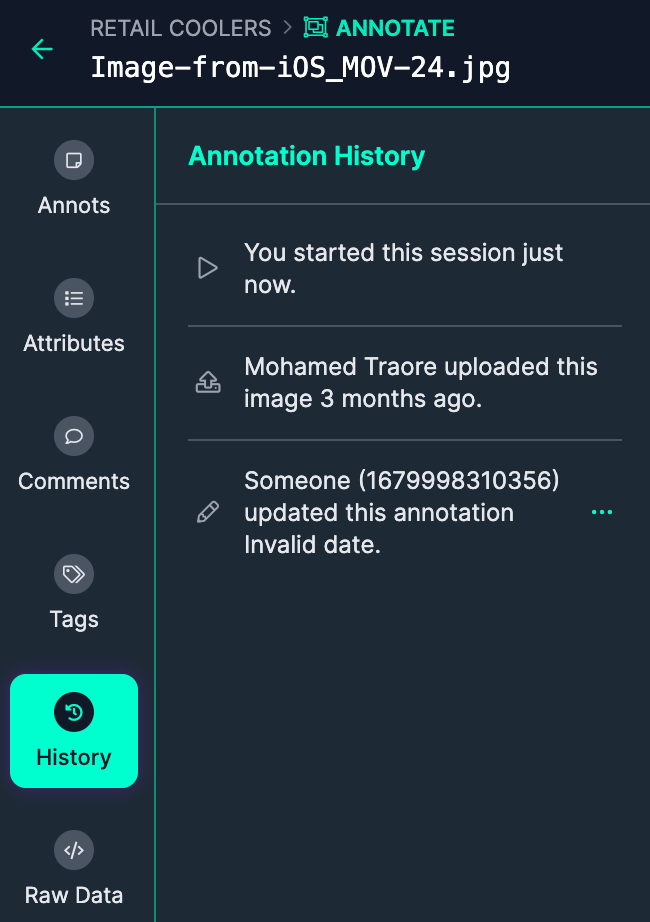
This will show the history associated with the image.
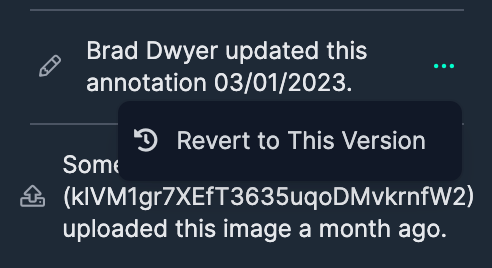
To review how an image looked at a certain point in time, hover over a change in the list:
You can revert an annotated image to a previous state by clicking the three dots next to a change. Next, click “Revert to This Version”. This feature makes it easy to revert accidental changes made to an annotation.
Conclusion
Using the Roboflow Annotation Insights tab and annotation History, you can understand in greater detail how members of your annotation team are contributing to the creation of high quality datasets.
You can review images labeled, bounding boxes drawn, annotation acceptance rate, and time spent labeling for each project and team member. You can focus on data for a specified time period and understand the changelog of a given set of annotations, enabling more granular understanding of your data labeling operation.