
Retail planograms can help with ensuring every precise detail in a store's layout according to business requirements.
By leveraging the use of planograms, retailers can ensure compliance with vendor agreements, measure the effectiveness of price changes, product offers, and more.
By leveraging computer vision technologies, retailers and vendors can automate the creation of dynamic and scalable planograms that can be used to ensure products are stacked properly on retail shelves.
In this guide, we will walk you through how to implement a working retail planogram using drink vending machines as example images.
We will teach how to build a computer vision model, as well as a simple workflow on Roboflow. These will help you get essential data for your planogram such as prices of drinks, the amount of drinks in each row, as well as the deals that appear in the image.
By the end of this guide, you will be able to create a dynamic planogram that will help maximise sales and enhance customer experience.
Before we begin, these are the steps in order to build a successful planogram.
We will walk through the following steps:
- Train a model to detect SKUs
- Create a workflow that detects SKUs
- Write a script to upload all SKU positions to Google Sheets.
Step #1: Build a Model
First, sign up for Roboflow and create an account.
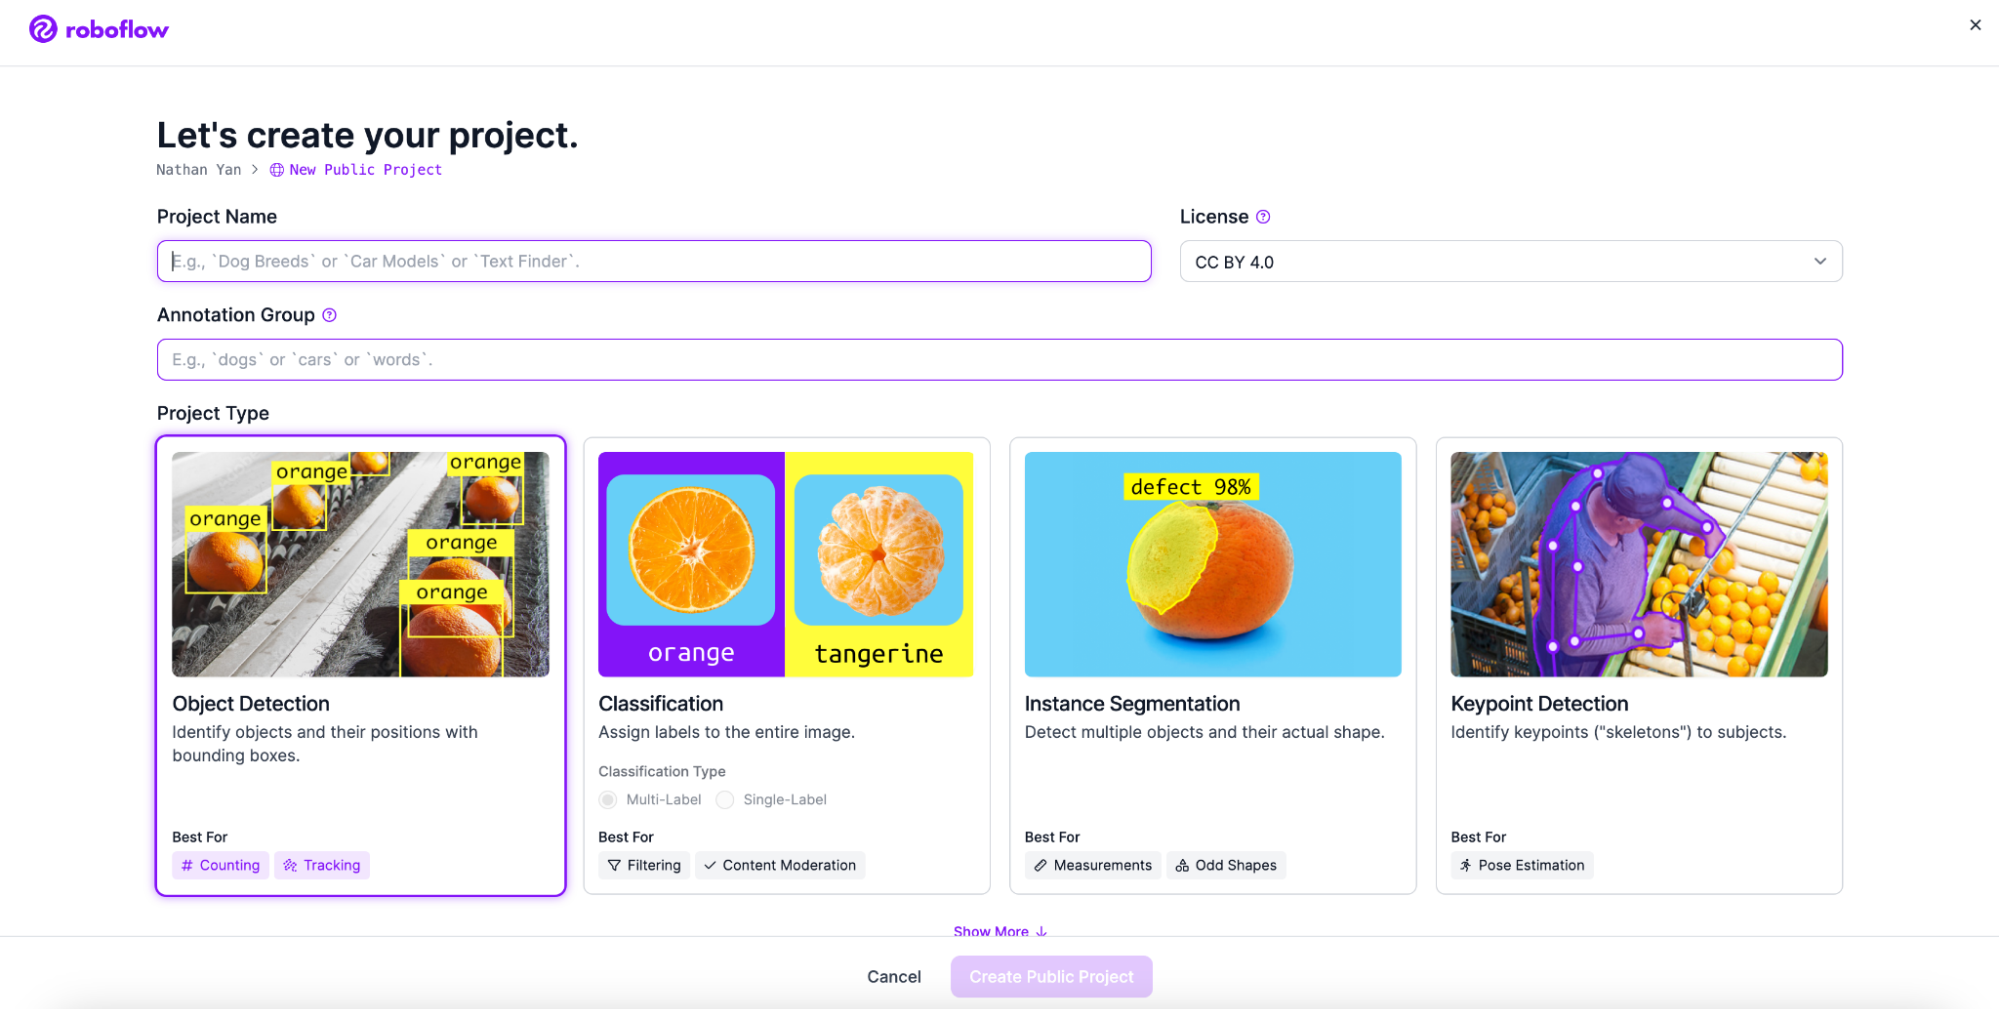
Next, go to workspaces and create a project. Customise the project name and annotation group to your choice. Create an object detection project.
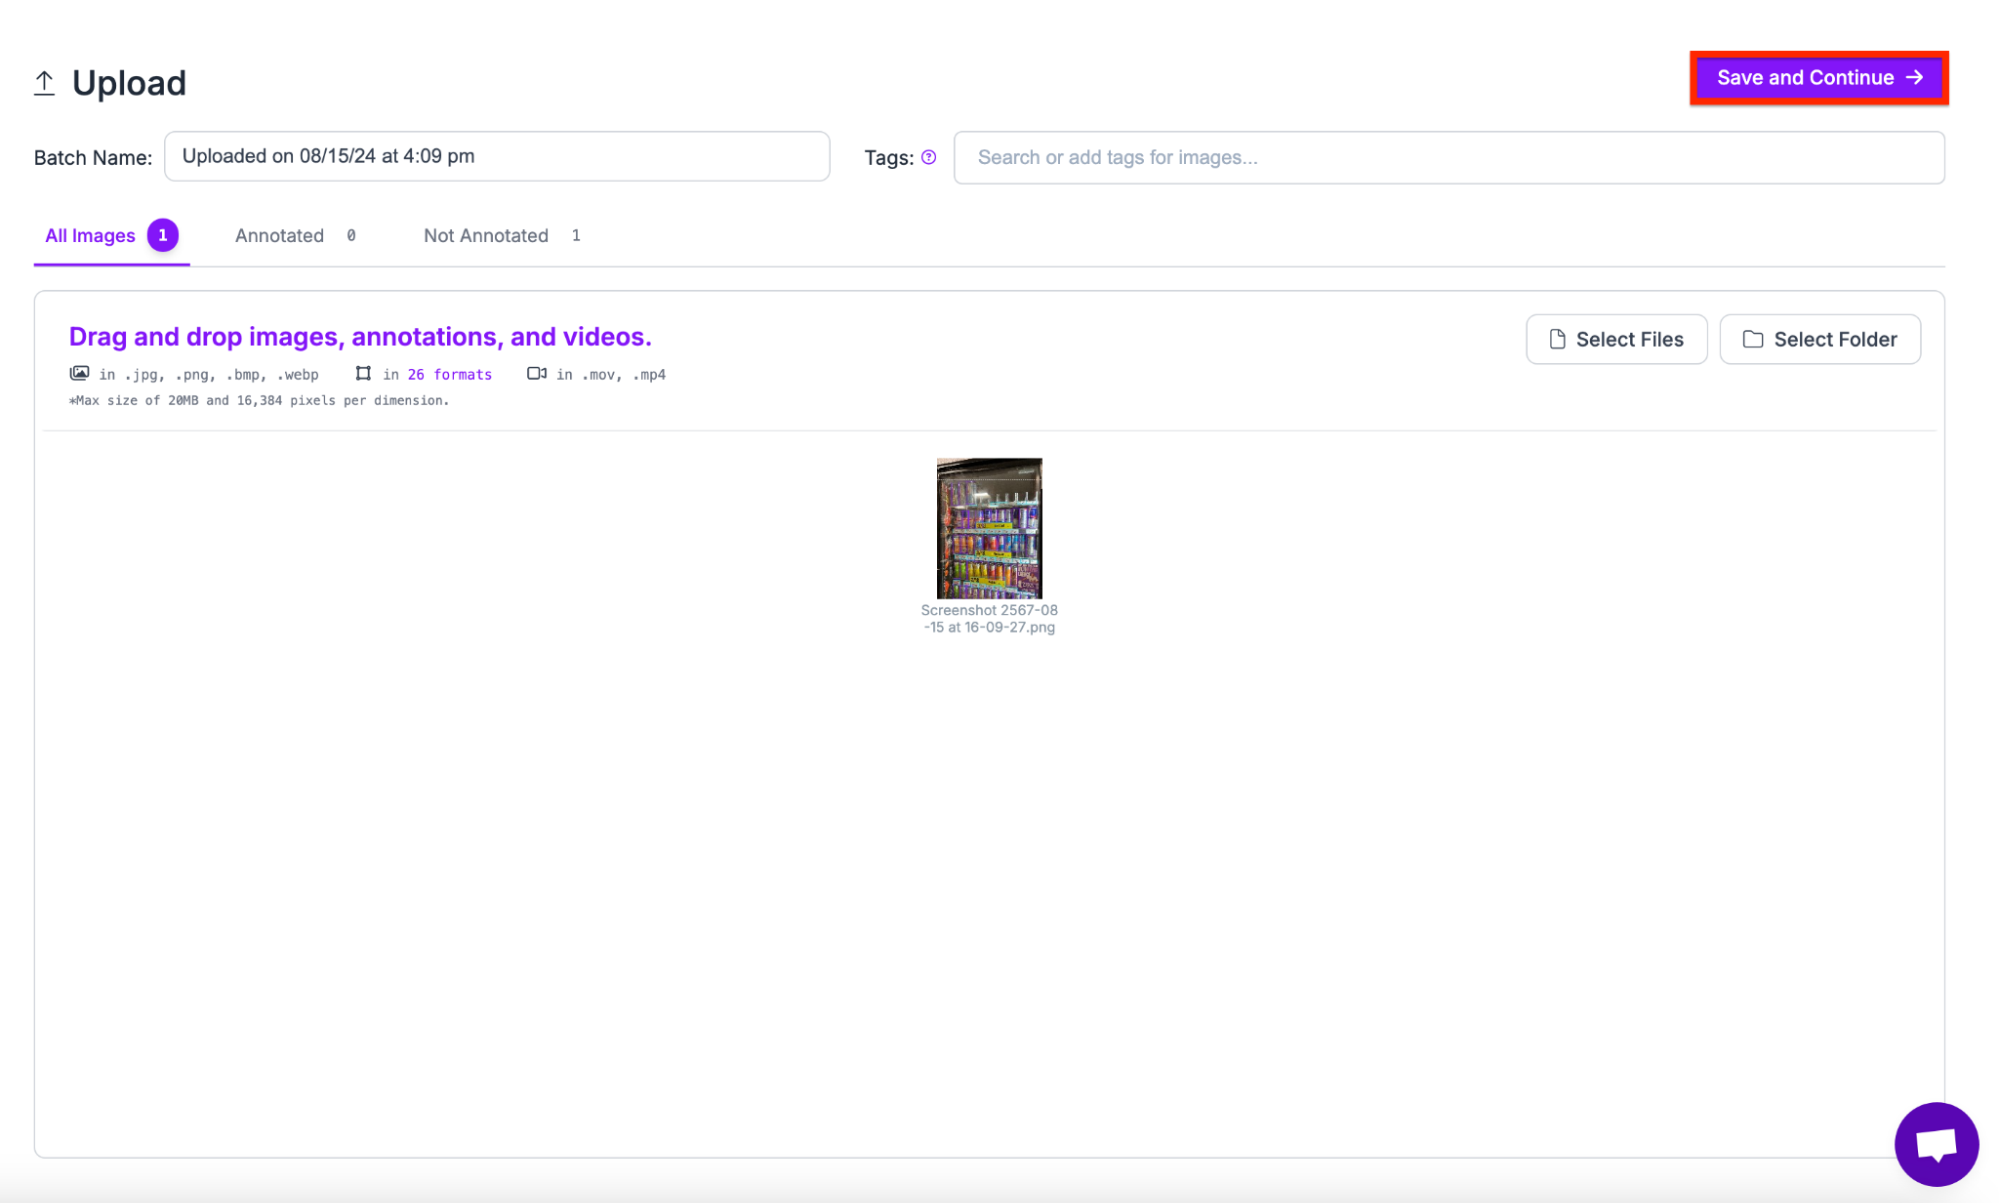
Next, add your images. In order to create a retail planogram, make sure to create a model that can detect the objects you need. This can be drinks, offers, prices, etc. In our project, we will detect a variety of different classes.
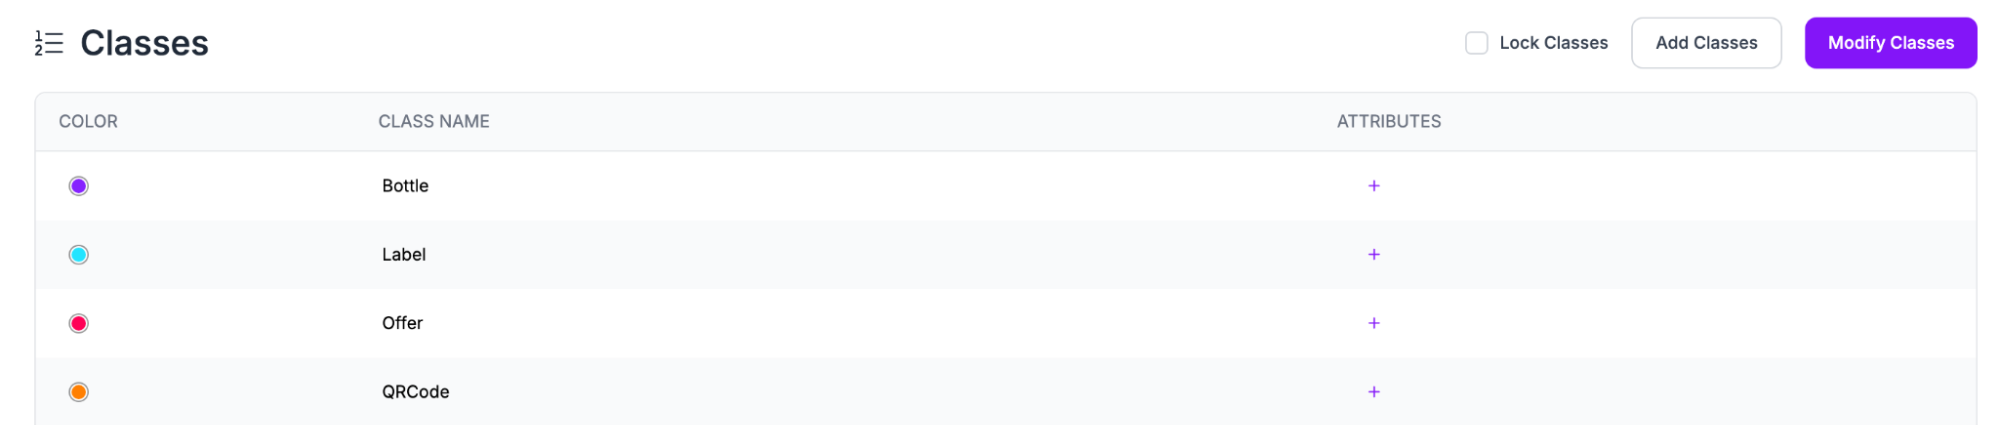
Add the classes you want your model to detect. In our case, we can detect a variety of objects such as bottles, labels, and offers.
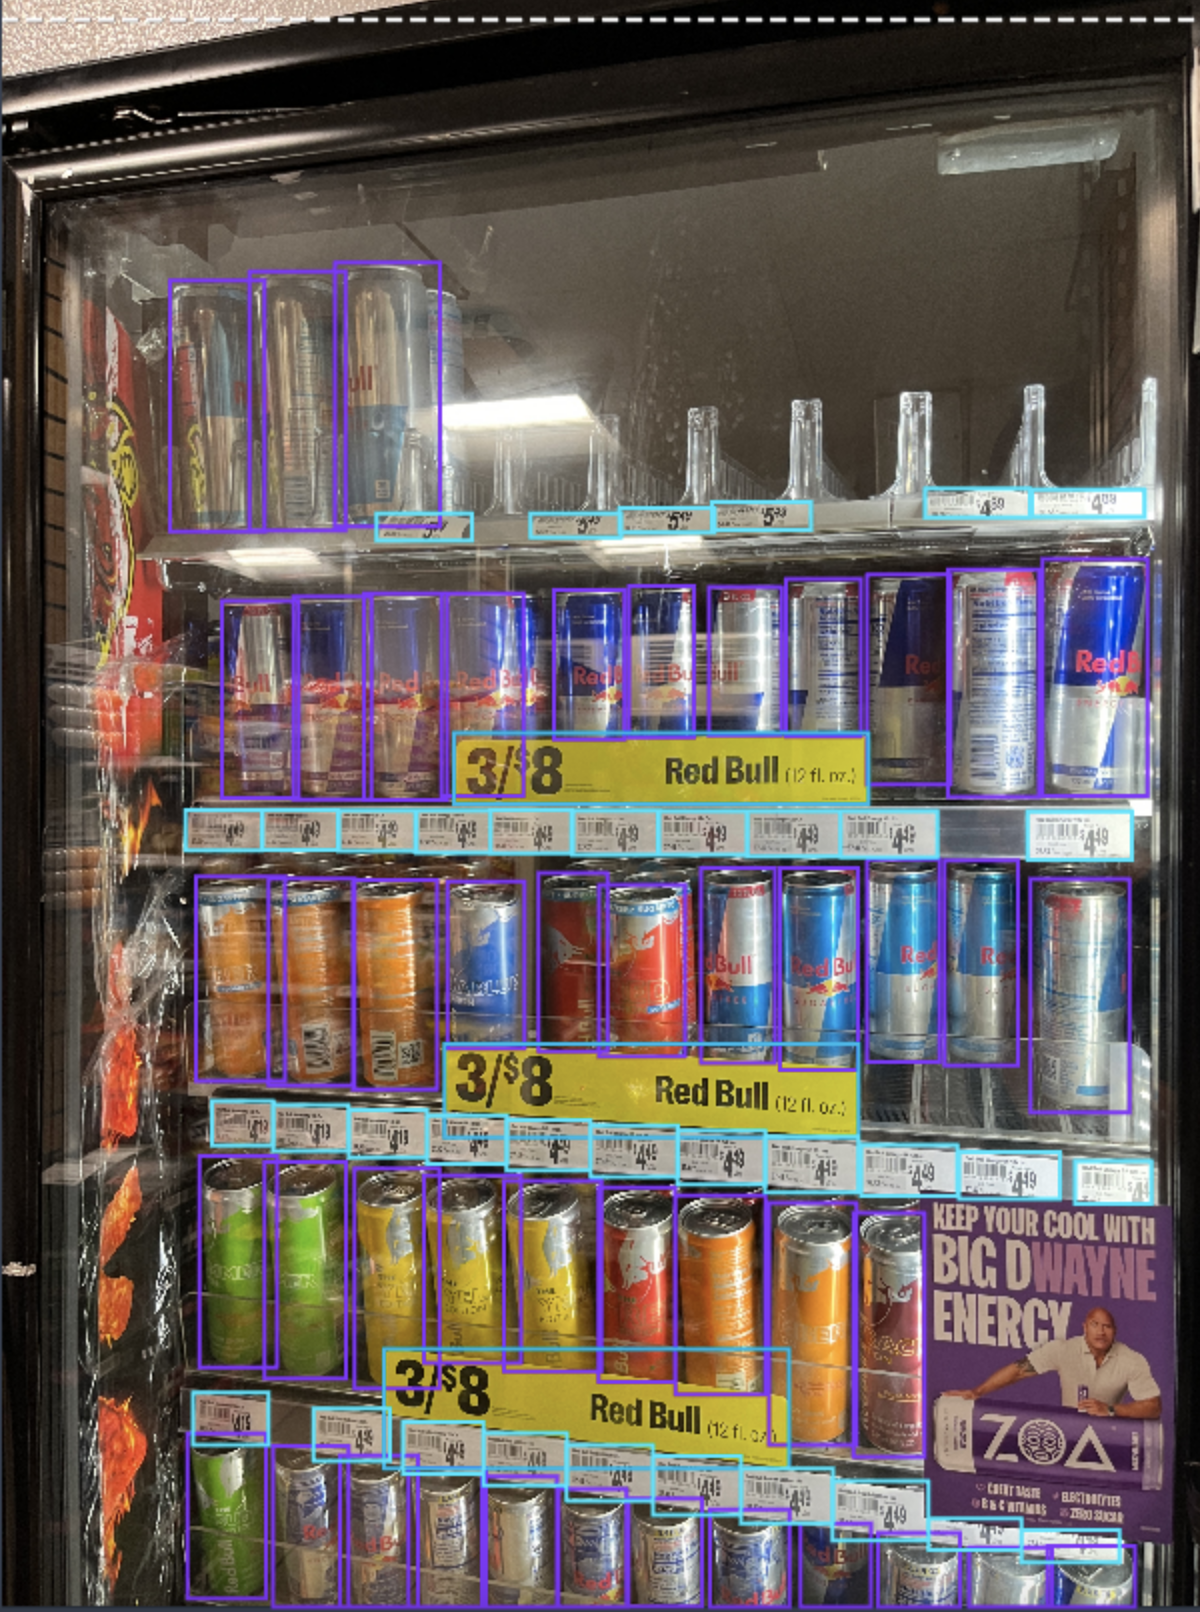
Next, annotate the dataset and draw your bounding boxes around the SKU items you want to track (i.e. drink) and price and offer tags:
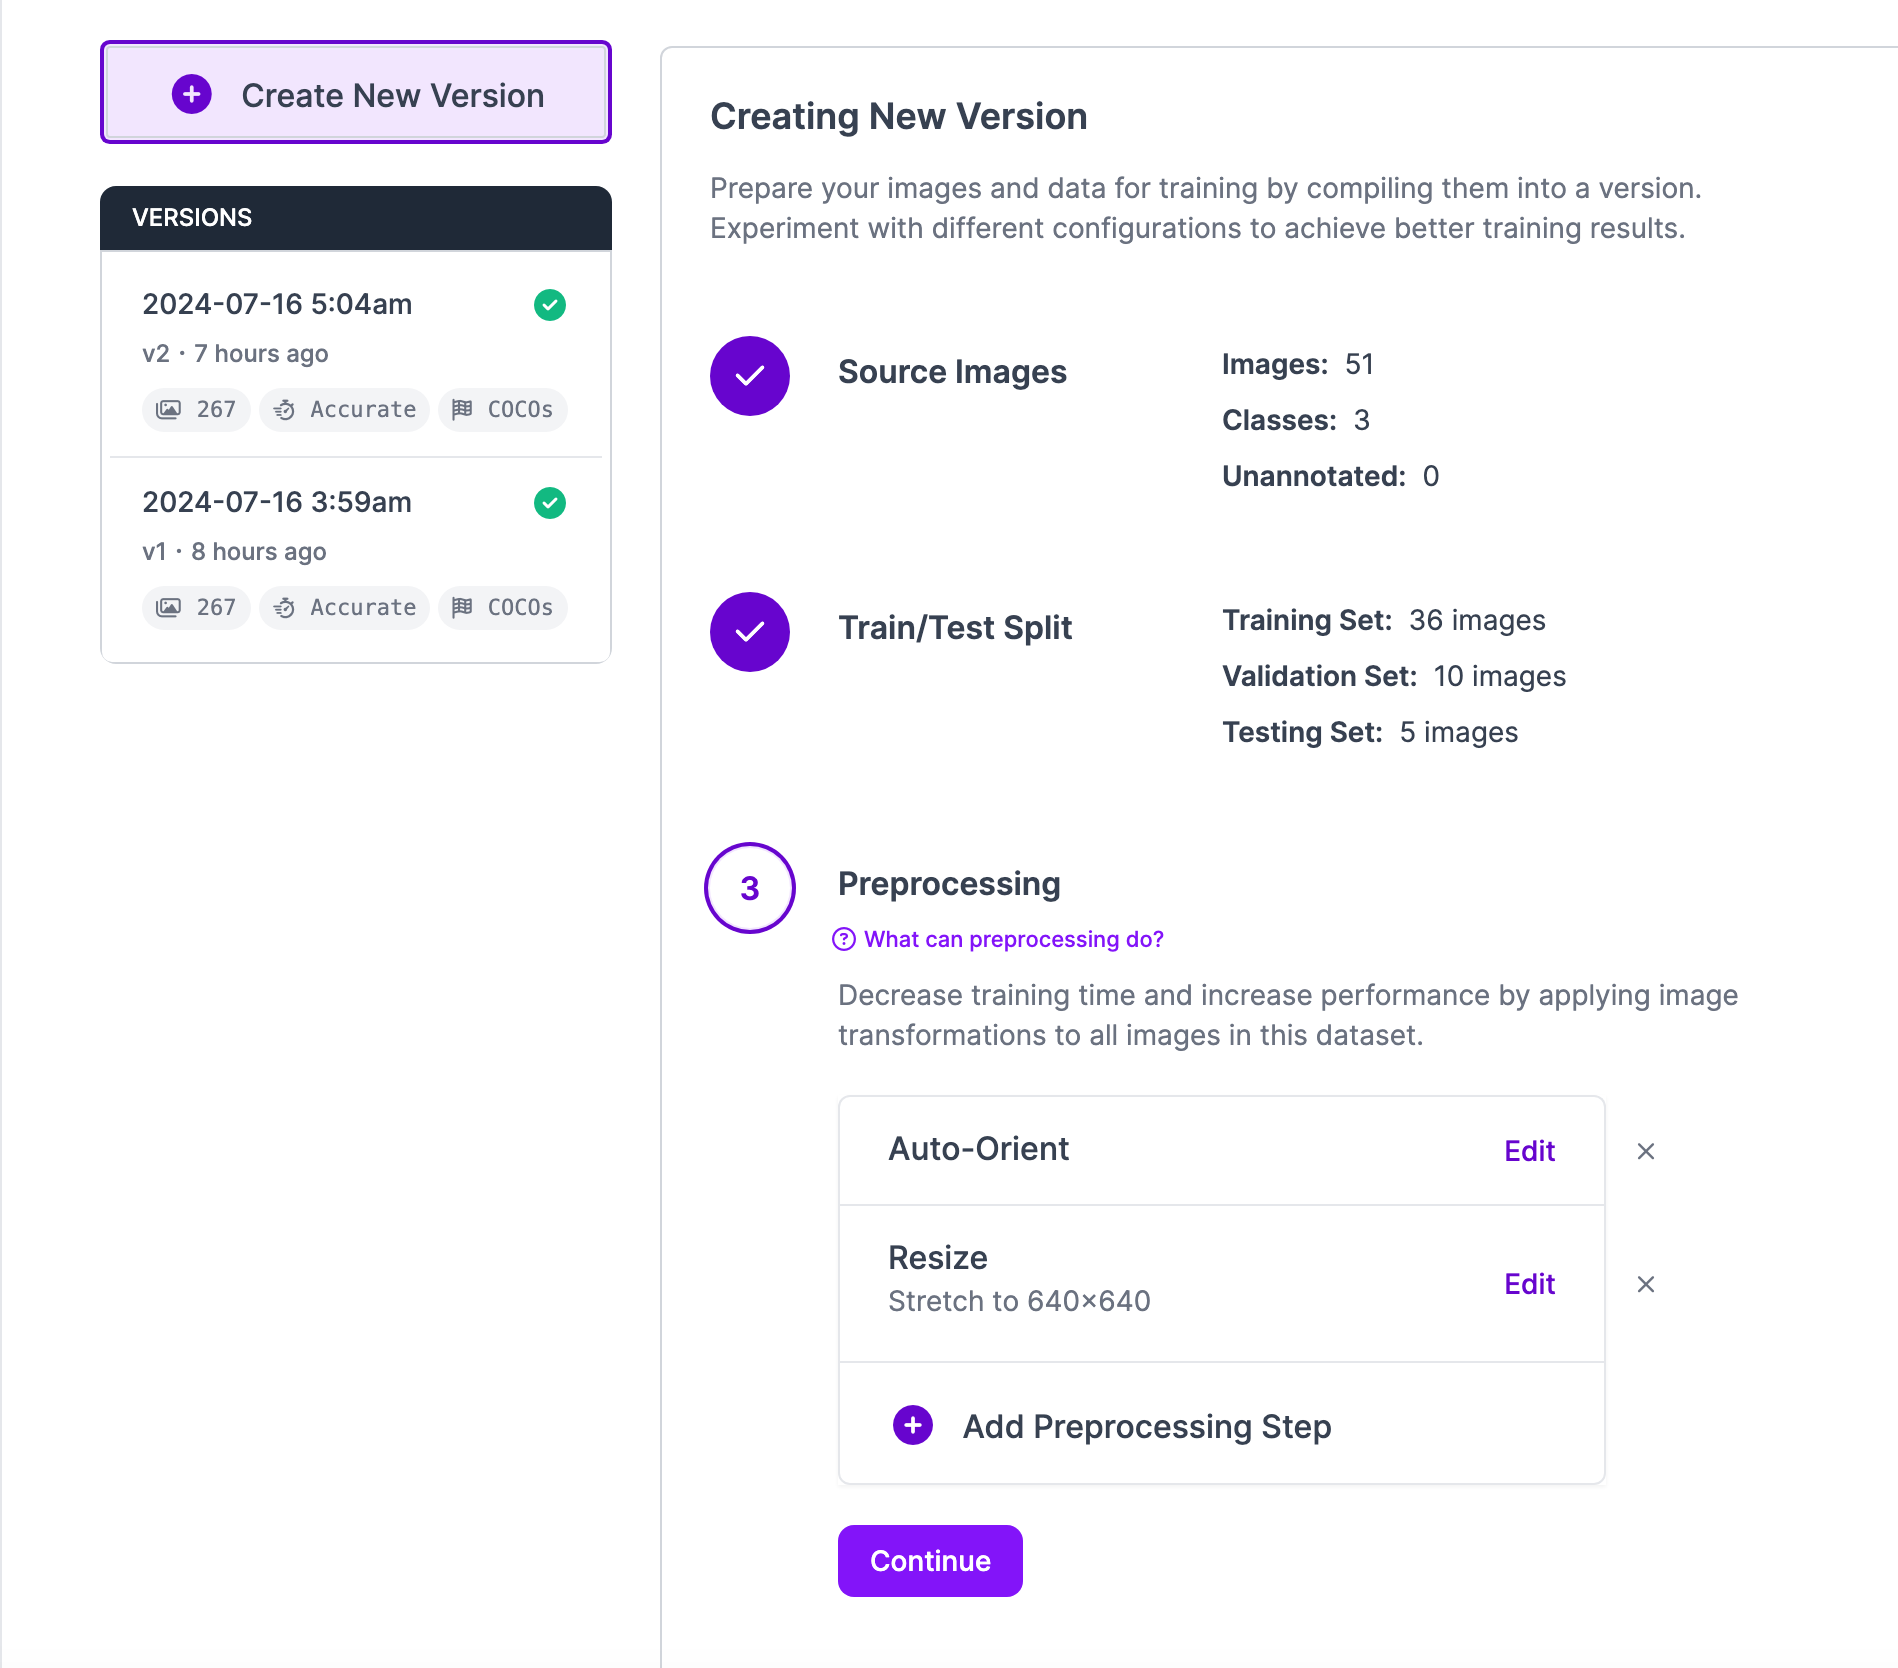
Now that we have our annotations and images, we can generate a dataset version of your labelled images. Each version is unique and associated with a trained model so you can iterate on augmentation and data experiments.
Step #2: Create a Workflow
Roboflow Workflows is a web-based, interactive computer vision application builder. You can use Workflows to define multi-stage computer vision applications that can be run in the cloud or on your own hardware.
Workflows can also call external vision-capable APIs such as GPT-4o, a feature we will leverage in our application.
At the end of the tutorial, our workflow will be able to:
- Detect the drinks row by row
- Detect the prices of each different drink
- Detect the offers on the page
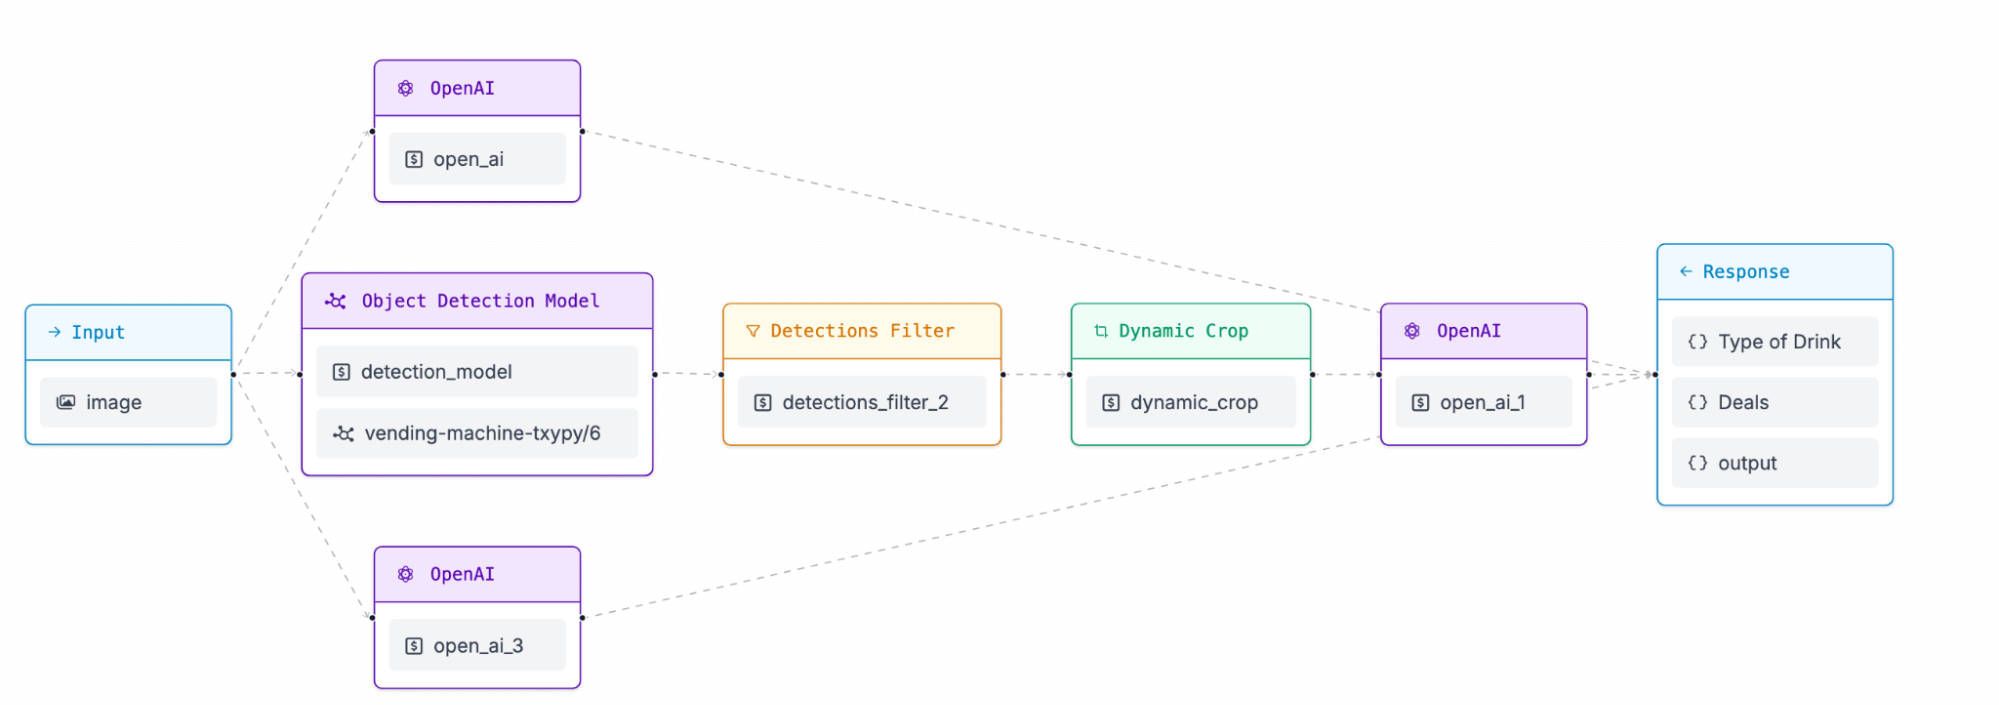
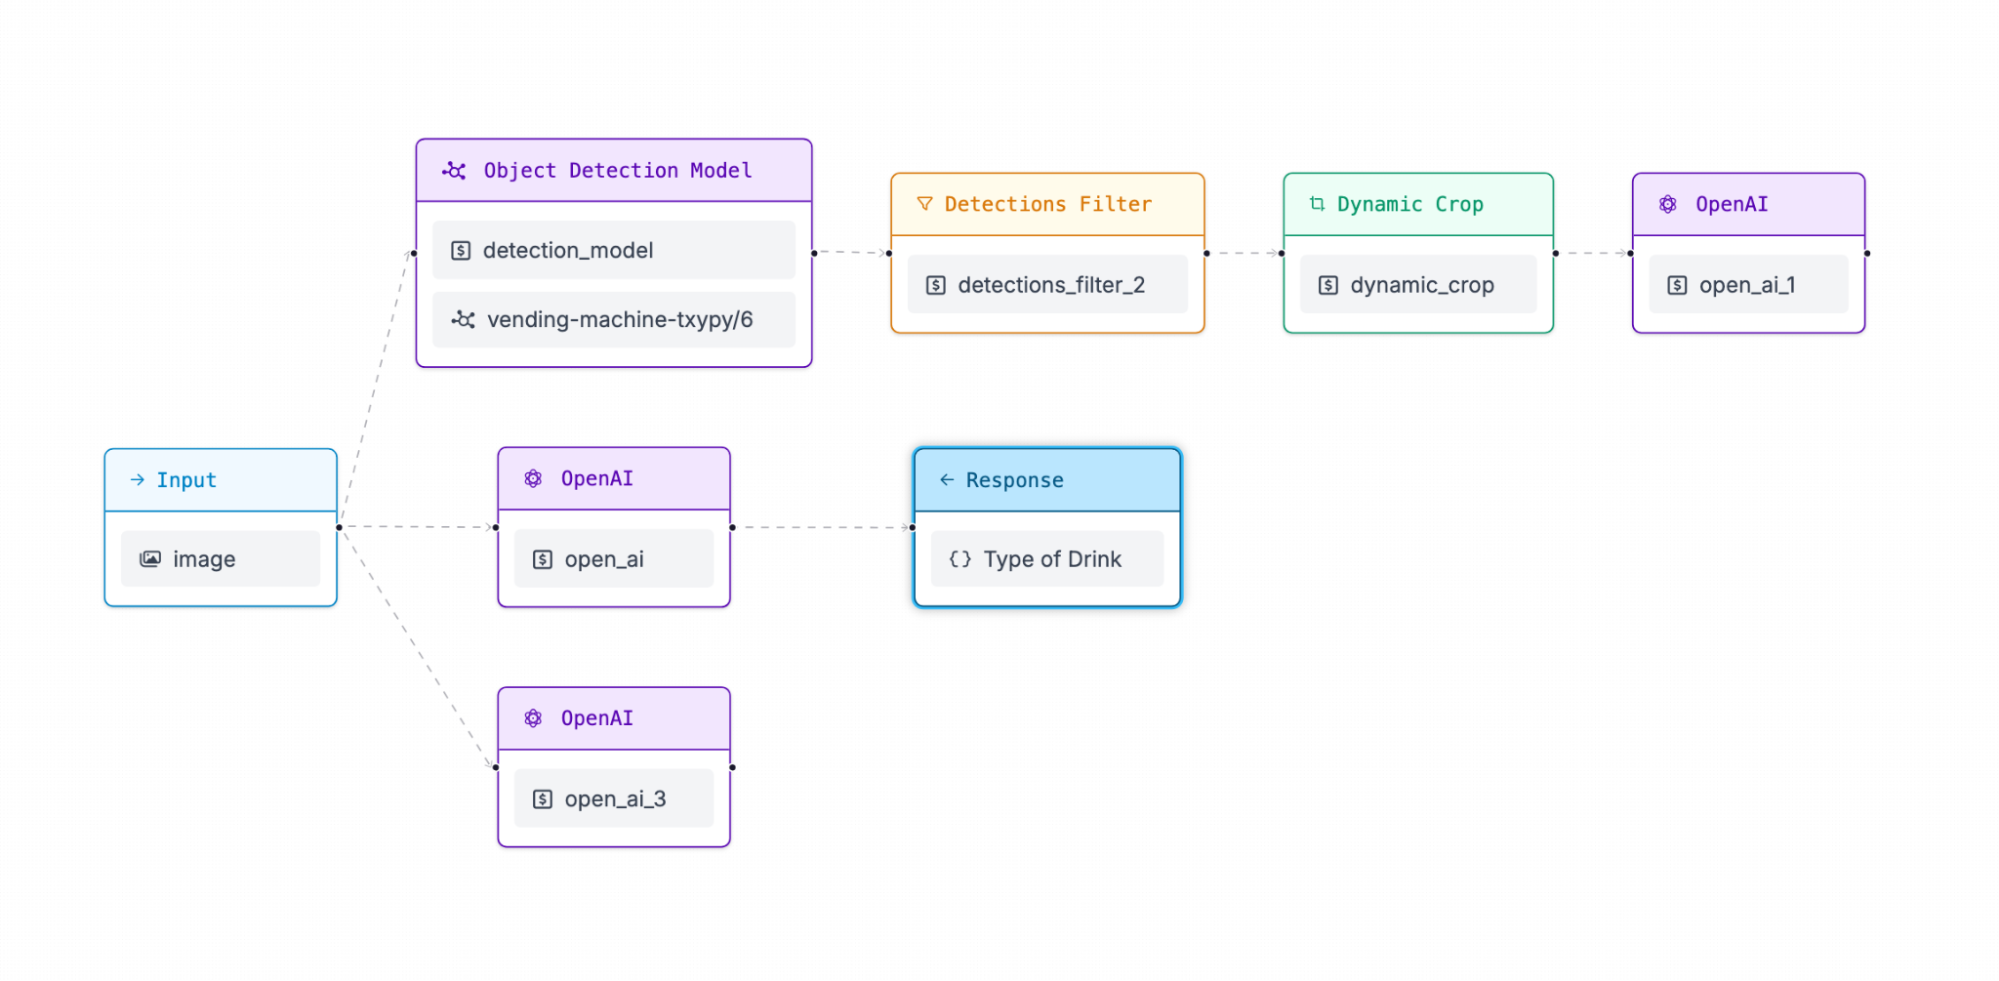
The overall Workflow will look similar to this:
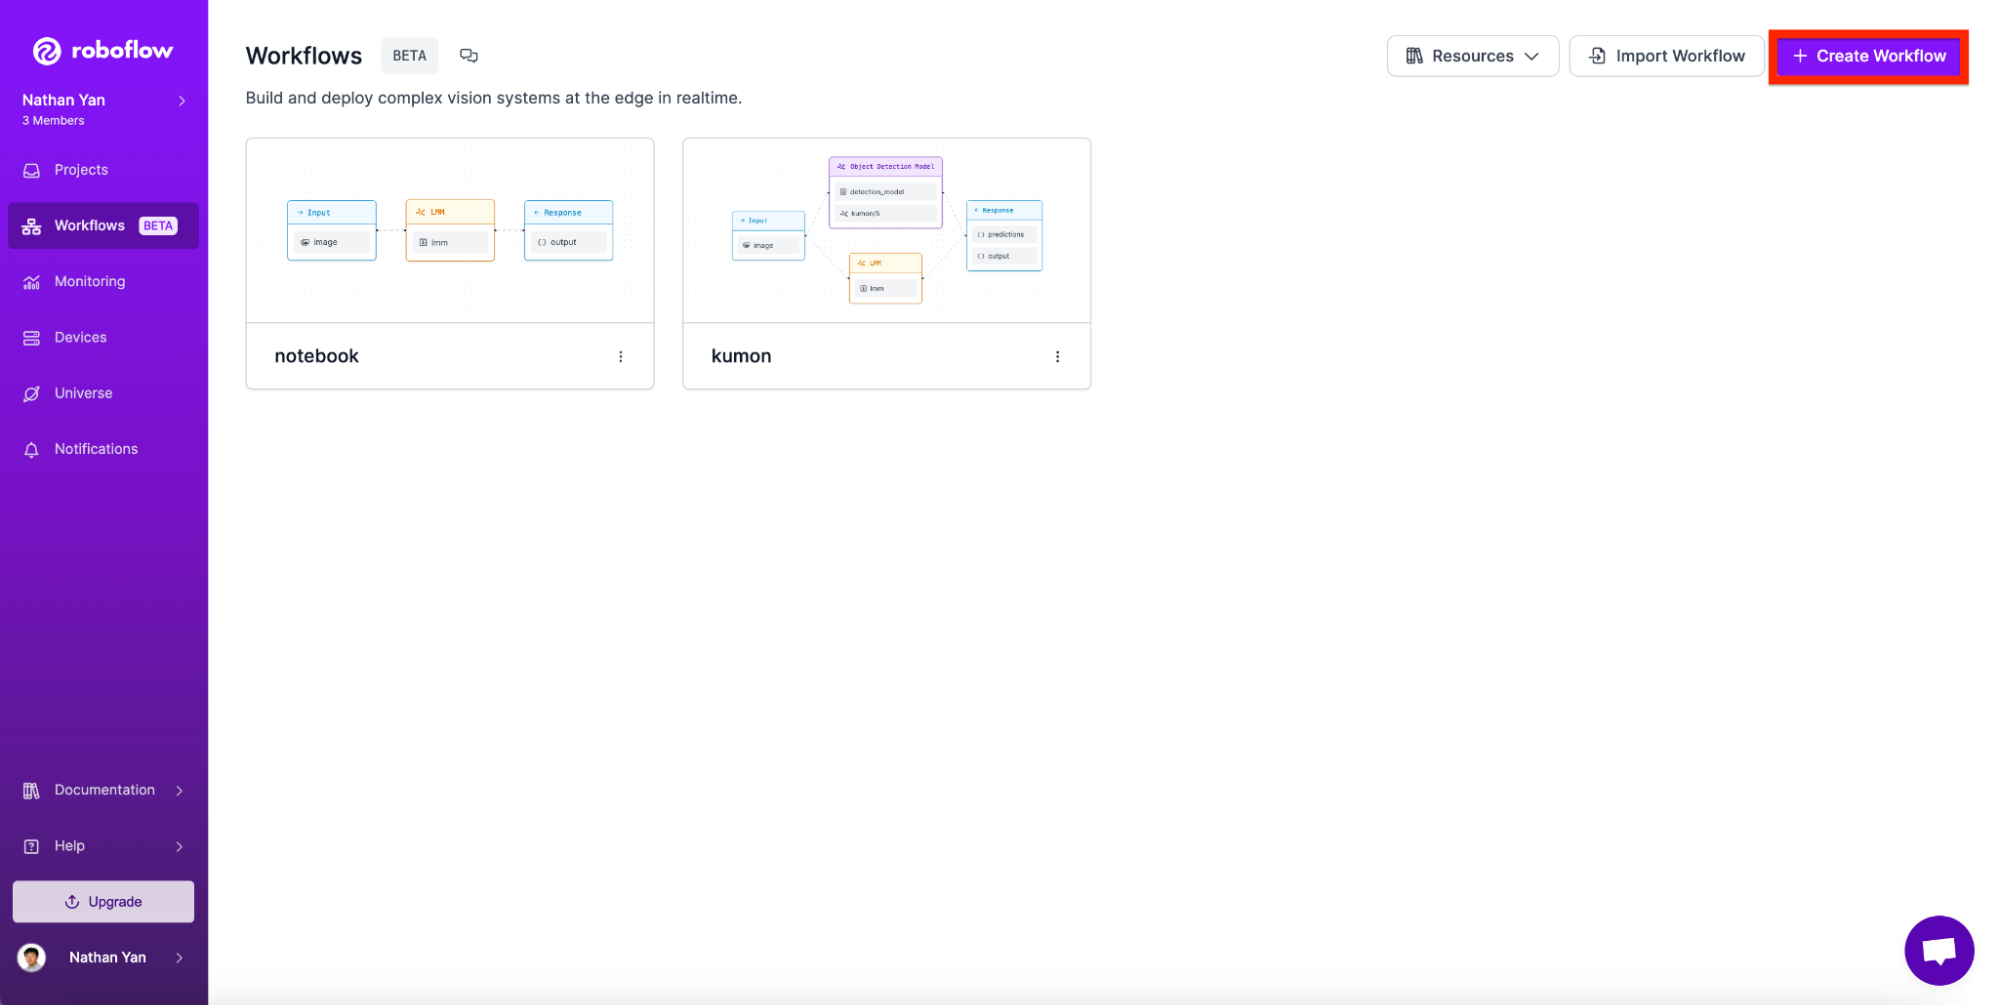
To get started, go to Workflows in the Roboflow application:
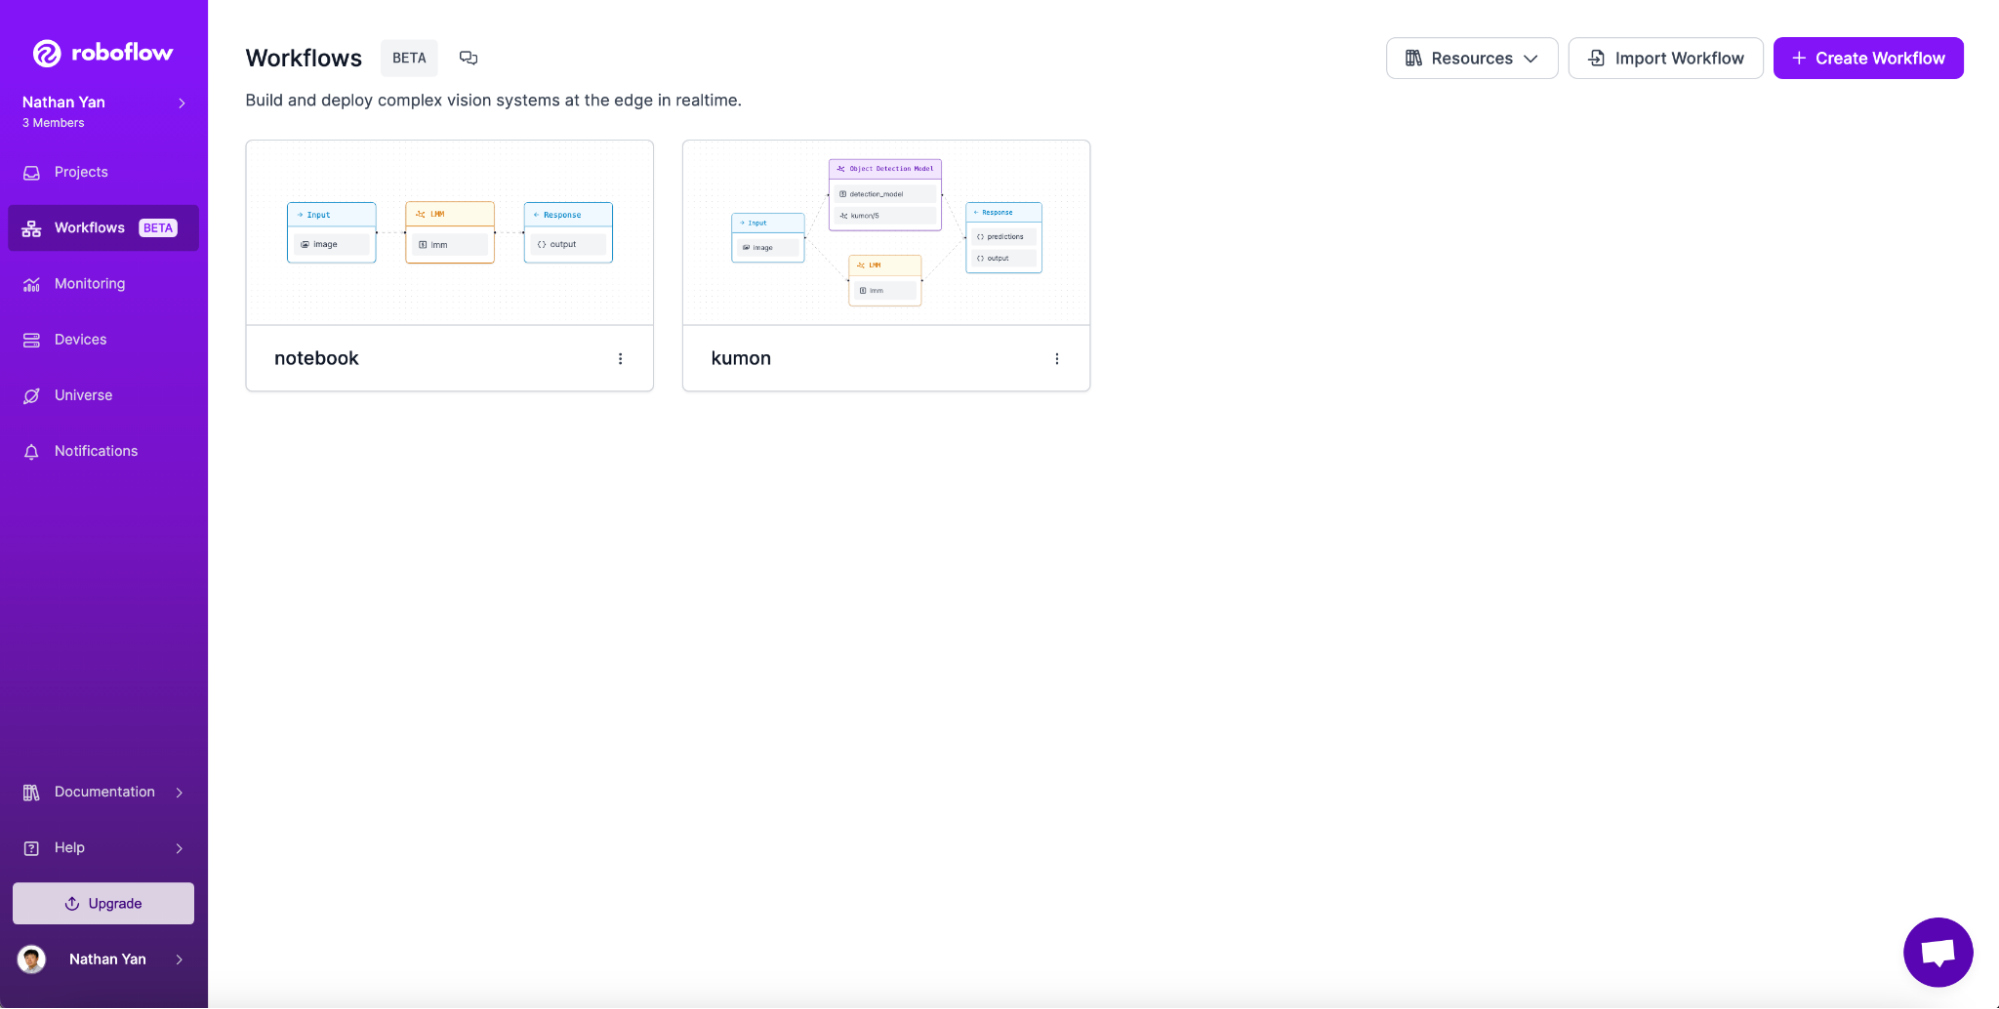
Then, click on “Create Workflow”.
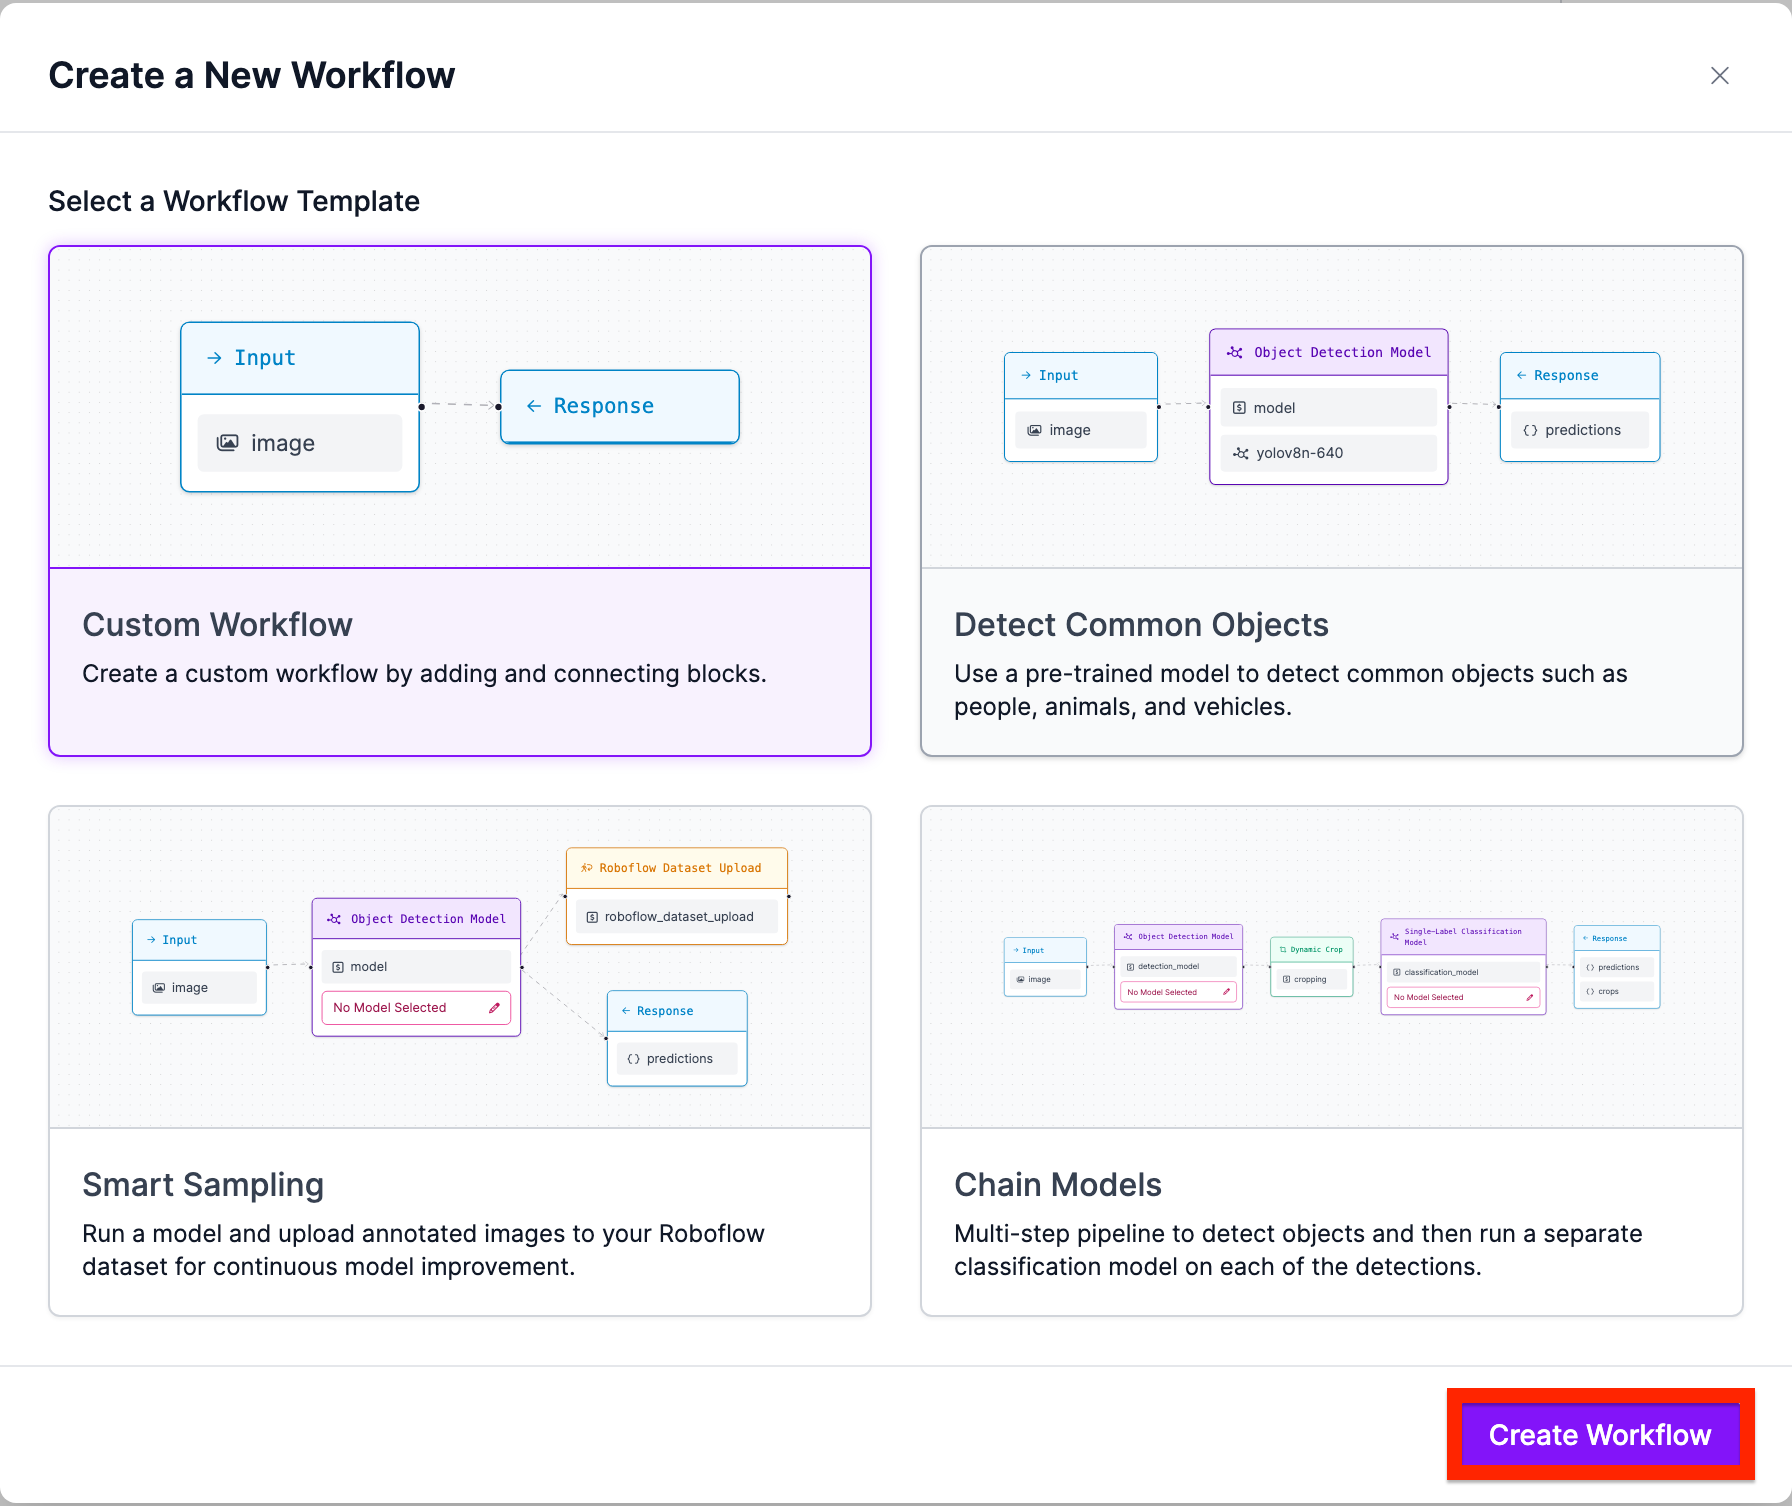
Next, click “Custom Workflow” and click “Create”:
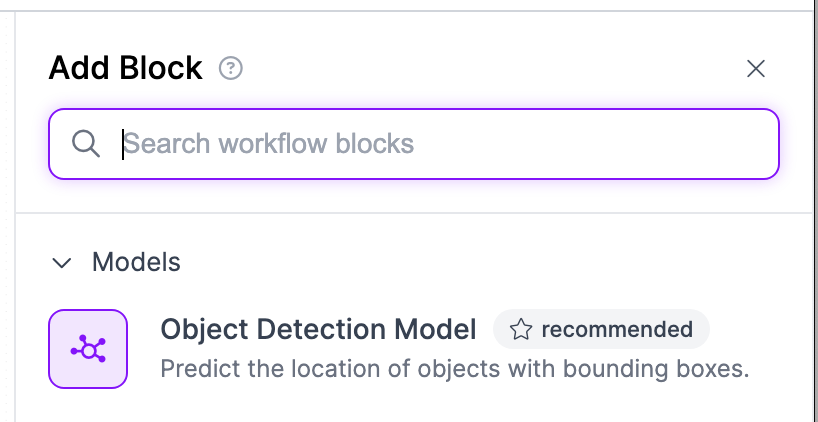
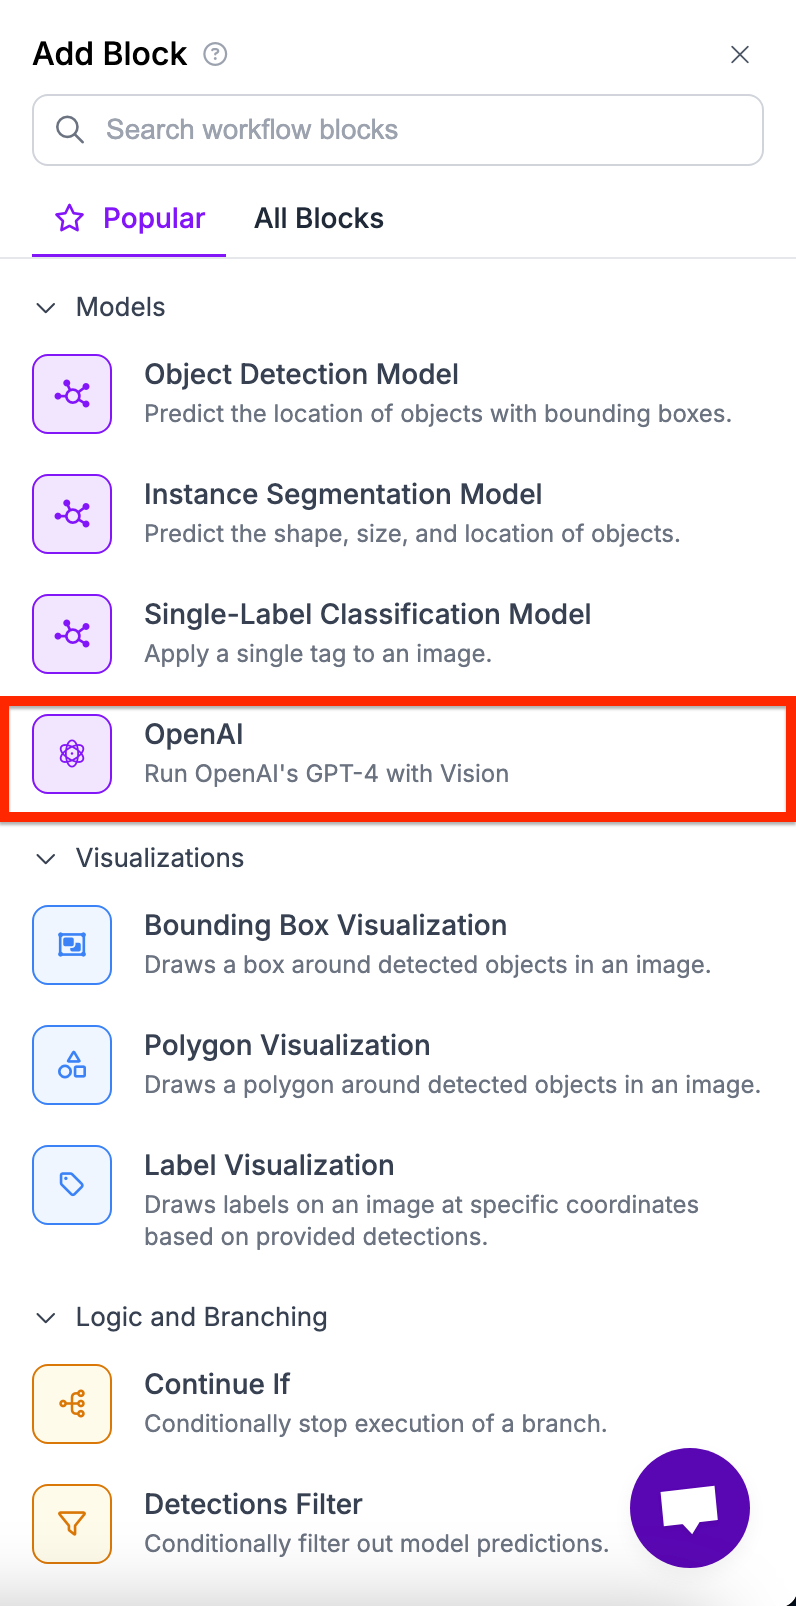
Next, navigate to add block and search for “Object Detection”:
Add the Object detection block.
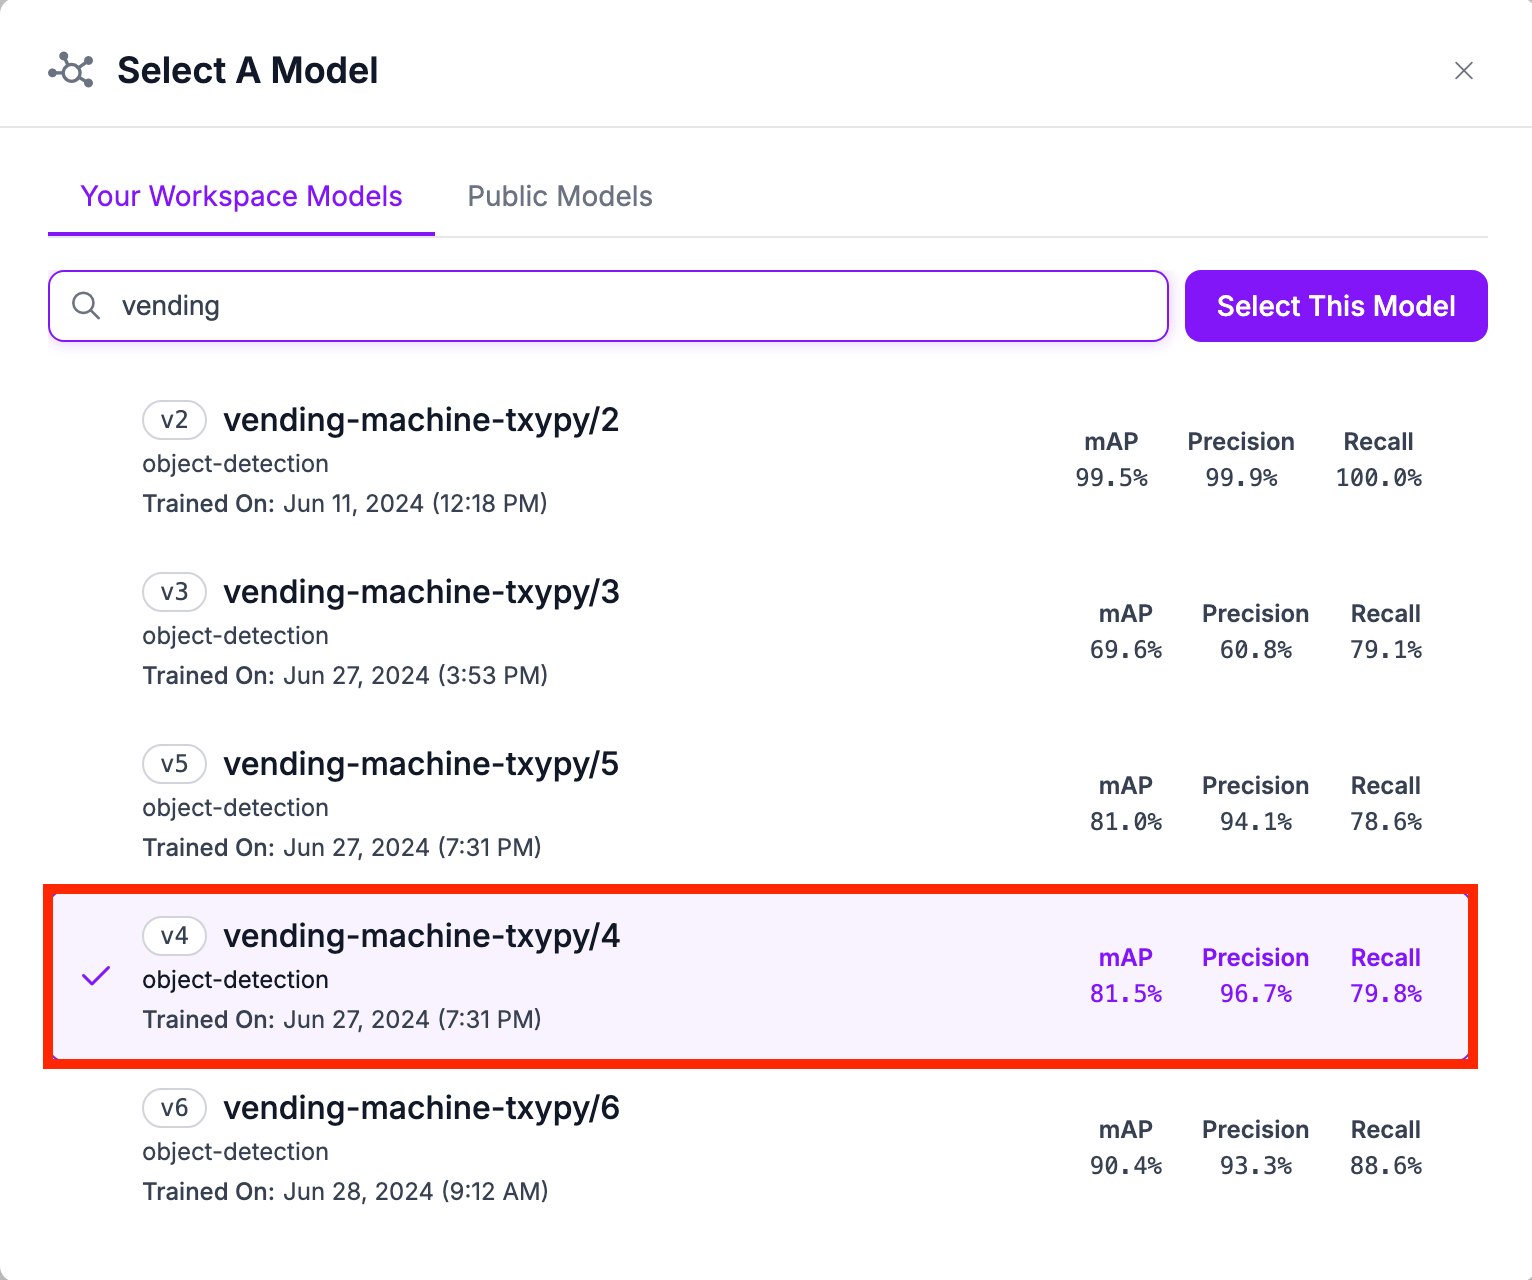
Now we have to pick which specific object detection model we want to use. To do this, click on the Model button.
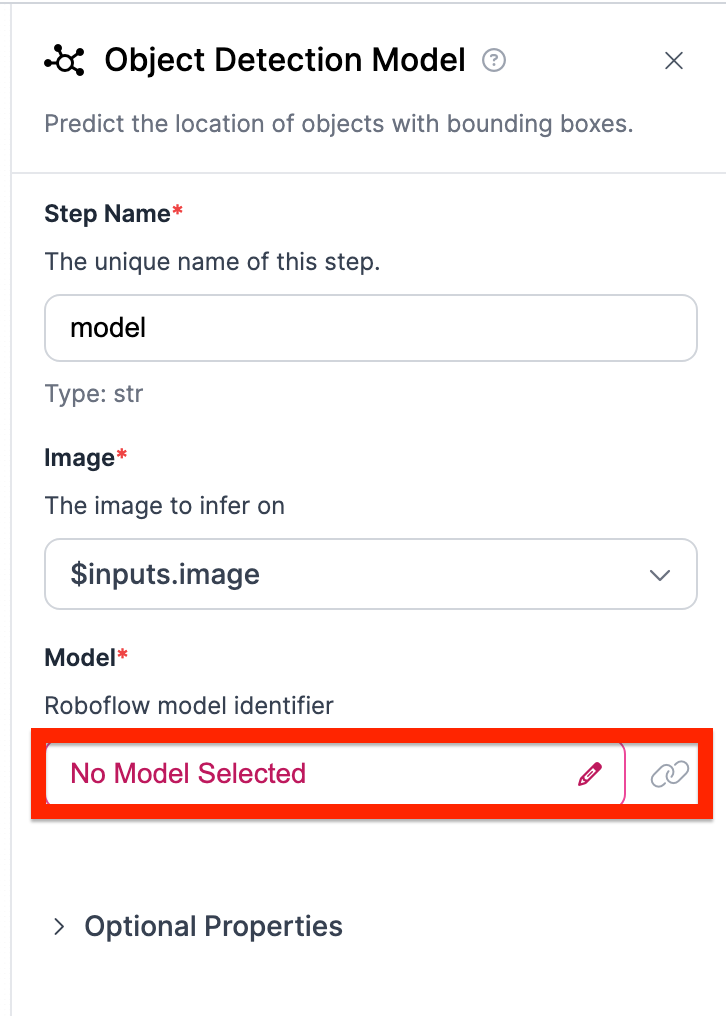
Select the specific object detection model as the one you need.
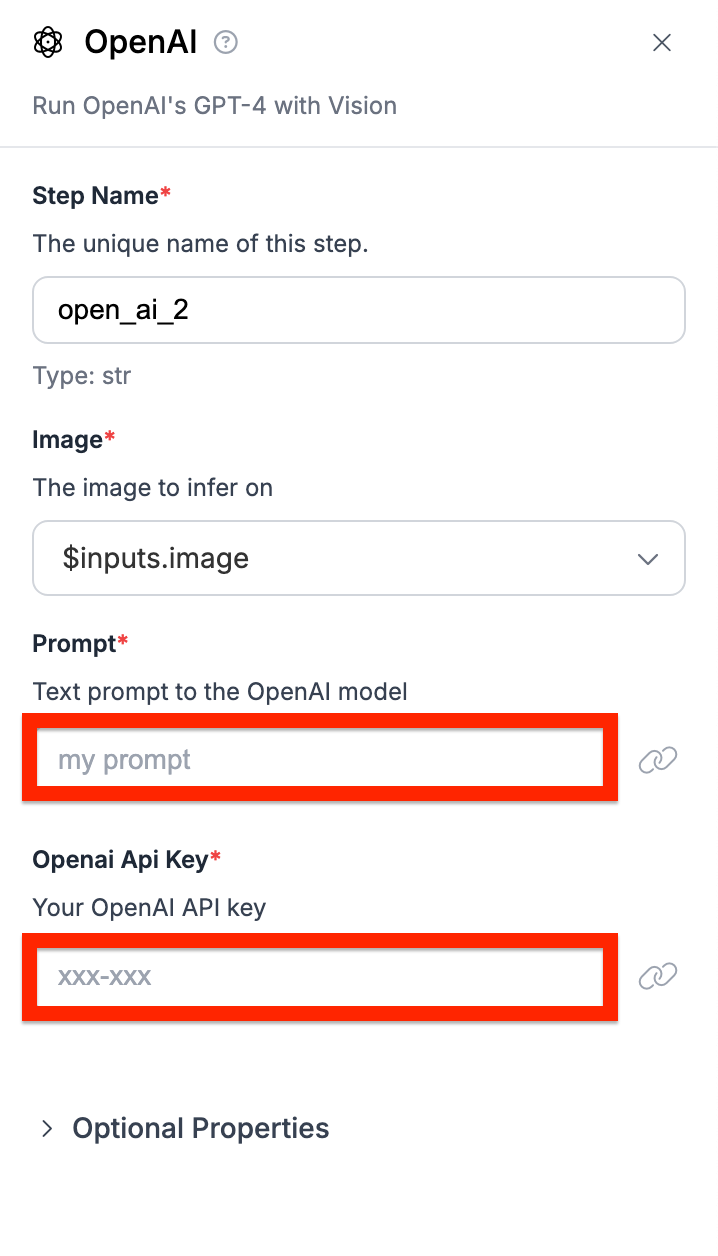
Next add the OpenAI block. Using this block and prompt engineering, we can detect the bottles.
After adding the block, add your api_key as well as your prompt. The prompt I used to get row by row detections was:
understand that you need to output only a dictionary. In the photo there will be Sprite, A&W, Diet Coke, Coke or any other drink. You must output all of the drinks in the photo. But also output them in order as lists from left to right for each row. For example if row one had Coke, Sprite, and Pepsi, you would output row_1=['Coke', 'sprite', 'pepsi']. However, if there are empty drinks in a row, make sure to put 'None' in that space. Add every single row list into a dictionary. Overall, the output should be a dictionary full of rows. in these rows, there are lists that contain the drinks in the row from left to right.”
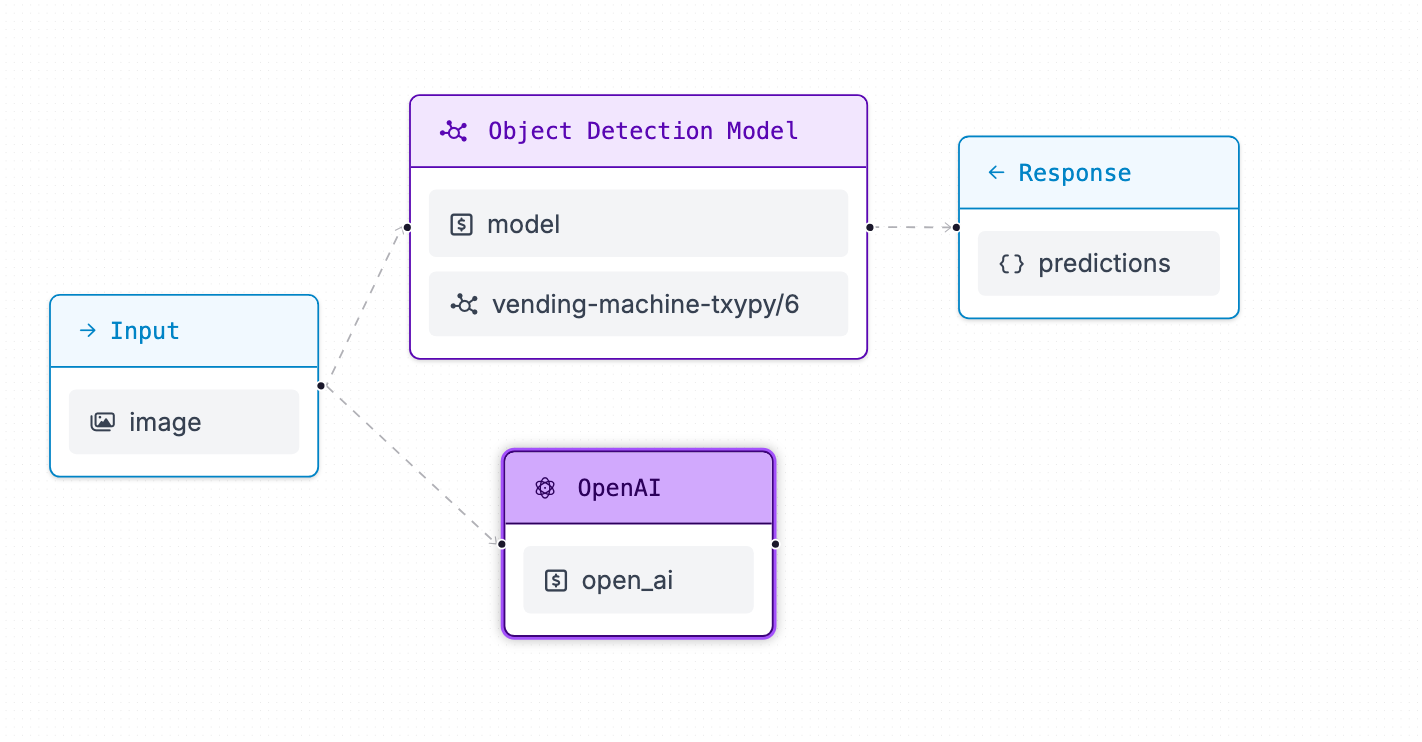
Your workflow should now look something like this:
Add another OpenAI block and set another prompt for the prices of the drinks. This way, we can get accurate answers from our model. The drinks prompt I used was:
For each row and column get the price of the item. The questions you should be asking are: What is the price of the item? What item does this correlate to? Give me an output similar to ['Redbull', $4.49]. do not output any other text than the item and price. Make sure to output it in the list format. Do NOT include the deal prices. We assume we are buying one drink at a time. Also make sure to not repeat the same brand of drink. Thanks!
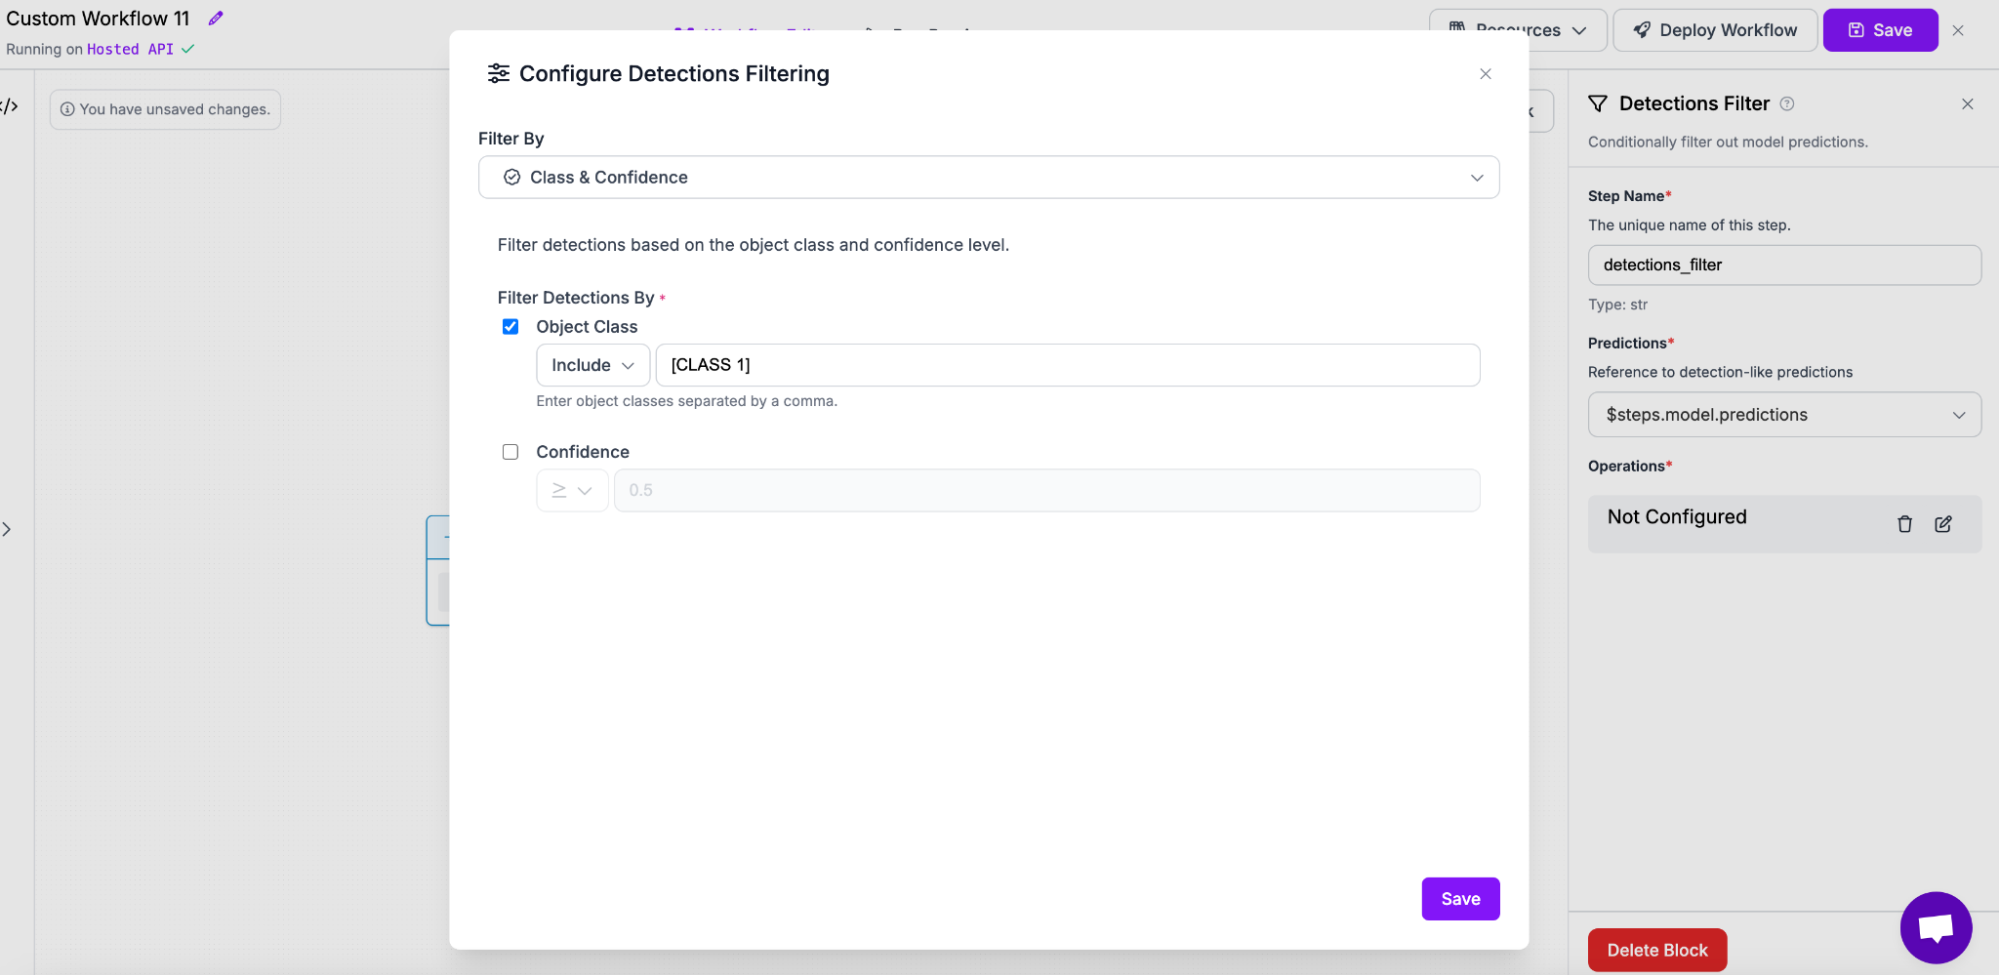
Next, add filter blocks for the model. Make sure to filter the block to be your class. In my case, I am filtering for deals.
Next, use dynamic crop to fully filter out the crop by attaching its path onto the filter and add another OpenAI block in order to get a sustainable output from the model.
After linking the blocks properly, your model should look like this.
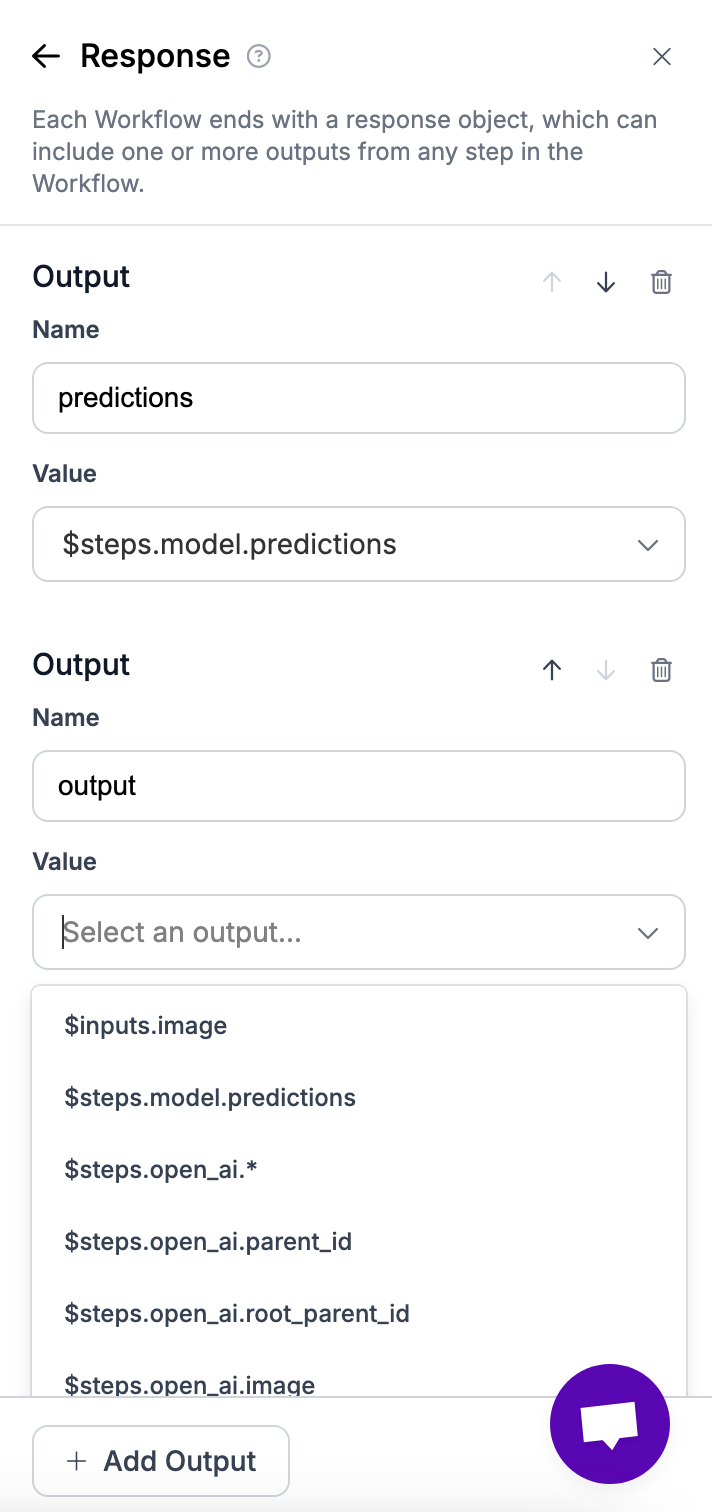
However, we still need to link the output steps. Select the blocks that you want an output from and you should be finished.
Your model should now look similar to the following image:

Step #3: Download and Import the Libraries
Before we start programming, we need to install some libraries beforehand:
pip install inference supervision google-auth-oauthlib google-authNext, import the necessary libraries in a new Python script:
import from inference_sdk import InferenceHTTPClient
import json
import supervision as sv
import cv2
import re
from google.oauth2 import service_account
from googleapiclient.discovery import build
import os
Step 4. Get Model Values
In this step, we will create a function that will get the needed output model values. Using the deploy code and a bit of logic, we will be able to get the drinks in each row, the prices of each drink, as well as the deals found in the image.
First let's get the deploy code from the previous workflow and copy and paste it into your code editor.
client = InferenceHTTPClient(
    api_url="https://detect.roboflow.com",
    api_key=""
)
result = client.run_workflow(
    workspace_name="",
    workflow_id="",
    images={
        "image": image_path
    }
)
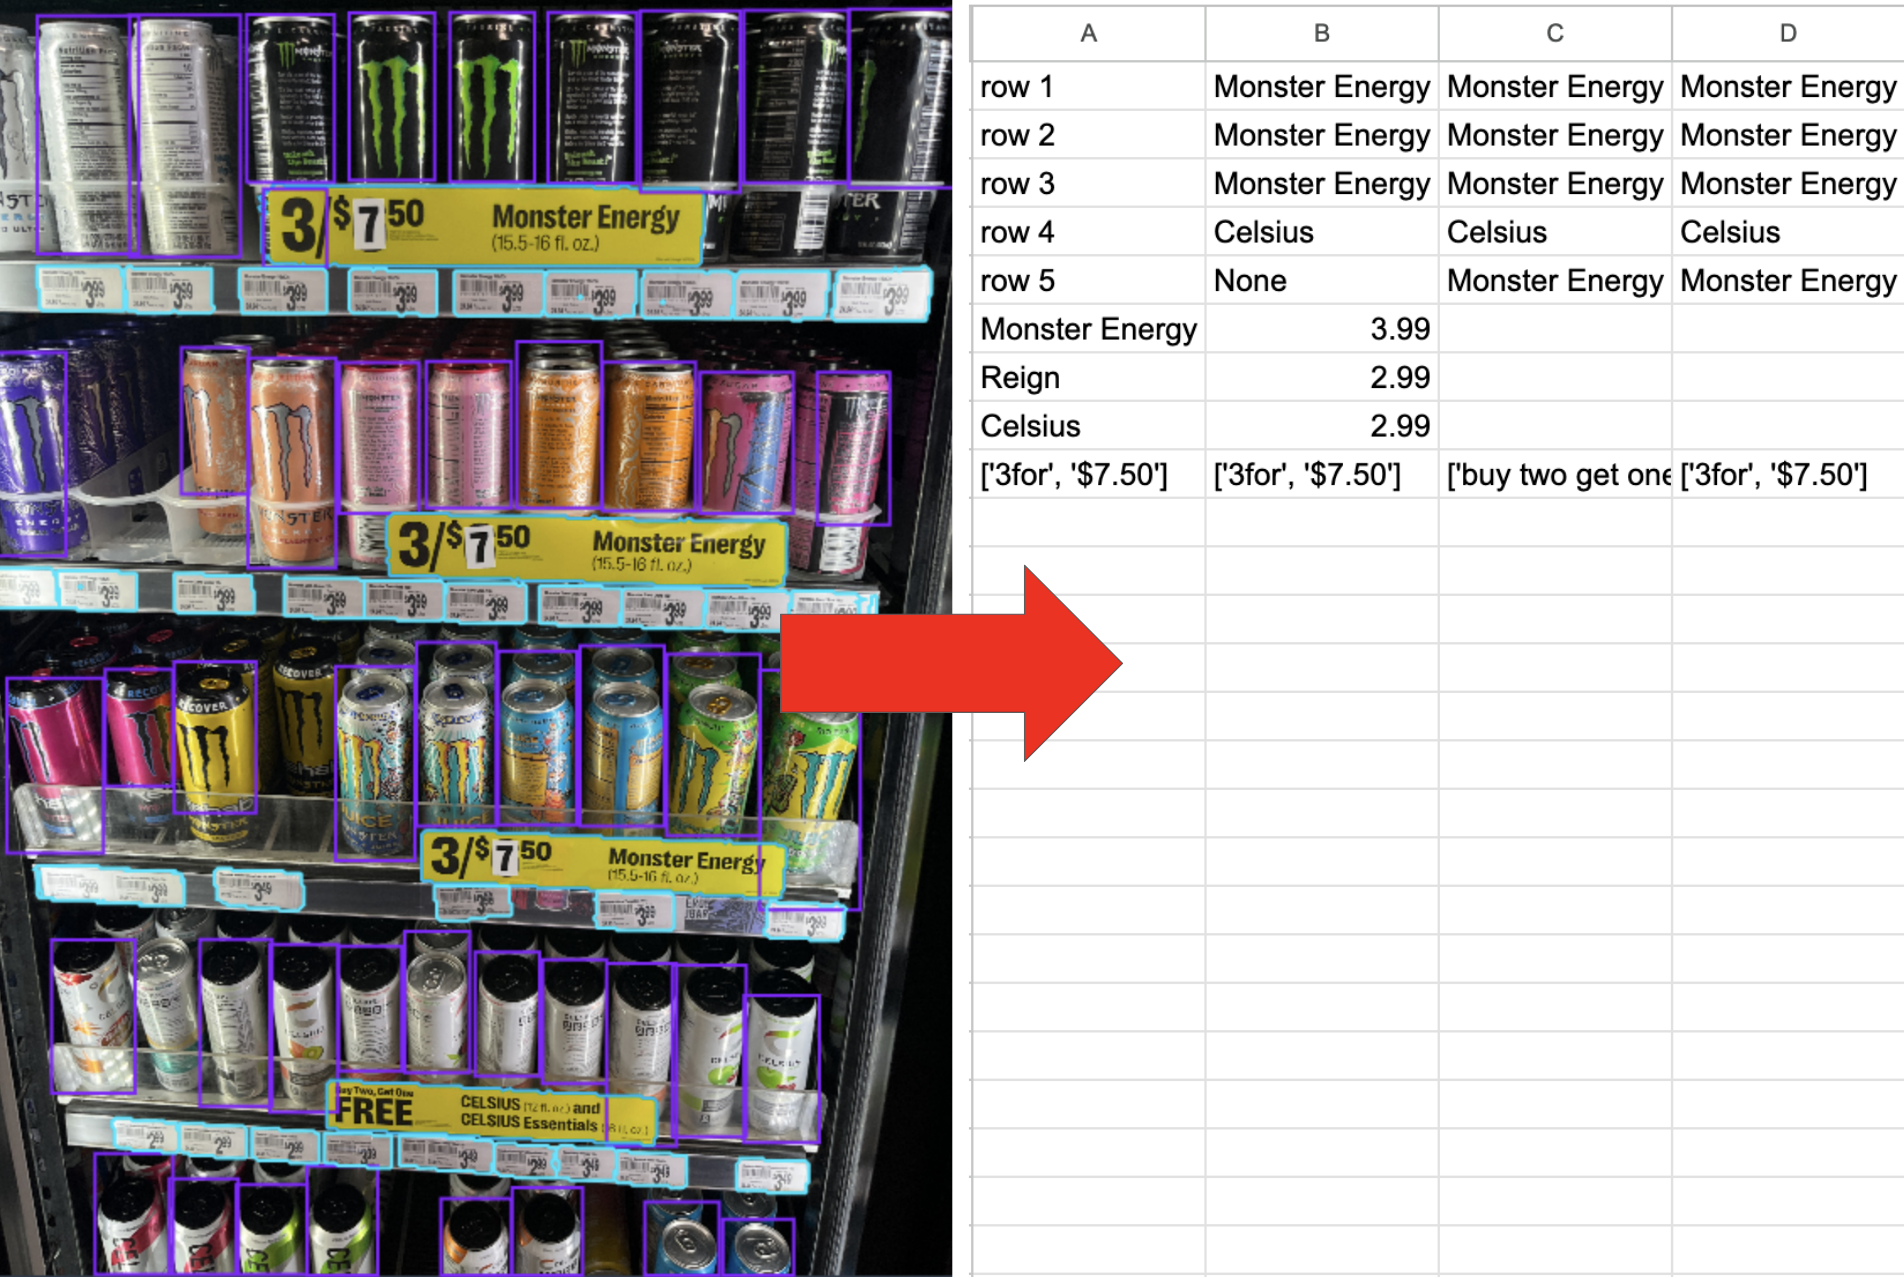
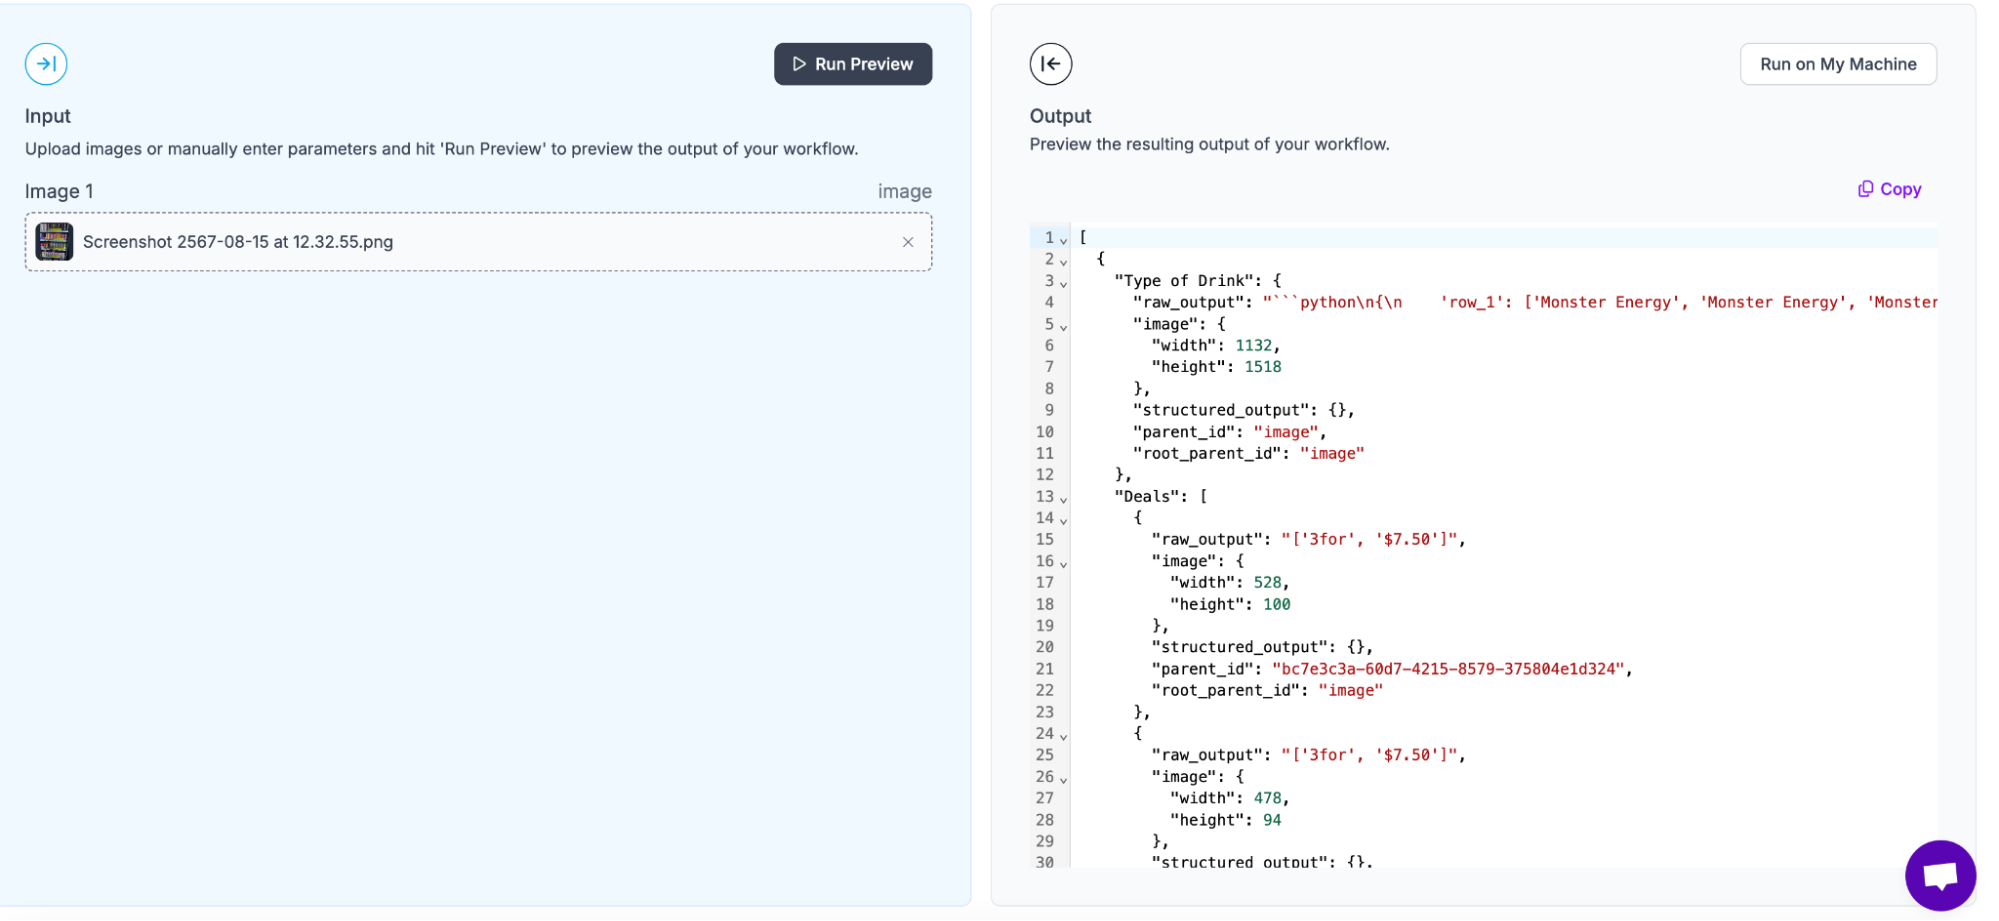
Next, we need to extract the useful information out of the function. If I preview an input image using my current model, an output would look something like this:
We can use the following code to process the results from our workflow to extract the information we want:
def get_vals():

    client = InferenceHTTPClient(
        api_url="",
        api_key=""
    )
    result = client.run_workflow(
        workspace_name="",
        workflow_id="",
        images={
            "image": image_path
        }
    )

    deals = result[0]['Deals']
    total_deals = []
    for deal in deals:
        total_deals.append(deal['raw_output'])


    dict_string = result[0]['Type of Drink']['raw_output']

    actual_dict = json.loads(dict_string)

    data = result[0]['output']
    matches = re.findall(r"\[\s*'([^']+)'\s*,\s*\$(\d+\.\d{2})\s*\]", data)

    result = [[match[0], float(match[1])] for match in matches]


    return actual_dict, result, total_deals
a, b, c = get_vals()

print(a, b, c)
The first info we need is located at the raw output of the type of drink. The output looks to be a dictionary so we can easily decode it with the following code:
Our Deals dictionary contains multiple predicted outputs. Therefore, in order to get the raw output of each, we need to loop through a list and add the important information to another list.
Lastly, the cost output also requires the raw output. However, since it isn’t stored as a dictionary and instead a list, we need to clean the data up a bit using the following three lines of code. These lines first remove unnecessary data from the price and also correlate each price with an item.
Step 5. Upload Data to Google Sheets (Optional)
This step will guide us through how to upload the outputted information onto a google sheet, which can help us break down the project into understandable tables.
In order to upload to google sheets, we will first need to set up the credentials. Create a project on Google Console. Here’s a brief video tutorial demonstrating how to accomplish this (make sure to replace the google docs api step with searching up google sheets).
After setting up our console, create a Google Sheet to link to our model. Additionally, get the id of the document. We find this by grabbing the section in between “/d/” and “/edit”.

Make sure to share the document with your service account. Find your service account by navigating to IAM. Add them to be an editor on your Sheets.
Next, add the following code. The following code will:
- Get the rows, prices, and deals
- Get the scope of your service account the account that will output the values onto your sheet)
- Find the spreadsheet using the spreadsheet id
- Get the values it should output through the given values list
- Output the values onto a Google Sheet
Replace the service account file with your credentials you got during the creation of your project in the google console. Also replace your spreadsheet ID with the currently empty spreadsheet ID.
rows, prices, deals = get_vals()
SCOPES = ['https://www.googleapis.com/auth/spreadsheets']
SERVICE_ACCOUNT_FILE = 'YOUR_CREDENTIALS_JSON'

credentials = service_account.Credentials.from_service_account_file(
    SERVICE_ACCOUNT_FILE, scopes=SCOPES)

service = build('sheets', 'v4', credentials=credentials)

SPREADSHEET_ID = 'YOUR_SPREADSHEET_ID’
RANGE_NAME = 'Sheet1!A1:Z40'


values = []

for i, (key, value) in enumerate(rows.items()):
    value.insert(0, f'row {i+1}')
    values.append(value)

for price in prices:
    values.append(price)

values.append(deals)

body = {
    'values': values
}

result = service.spreadsheets().values().update(
    spreadsheetId=SPREADSHEET_ID, range=RANGE_NAME,
    valueInputOption='RAW', body=body).execute()

print(f"{result.get('updatedCells')} cells updated.")


values = []

for i, (key, value) in enumerate(rows.items()):
    value.insert(0, f'row {i+1}')
    values.append(value)

for price in prices:
    values.append(price)

values.append(deals)

body = {
    'values': values
}
The values list are the ones outputted onto the Google Sheet. In the following code, we make sure to output the row and its corresponding drinks. We also output the prices of the drinks as well as the deals found in the image.
Conclusion
In the tutorial, you have learned how to create a working Roboflow model, a Workflow as well as implement Google Sheets with Roboflow. For more blogs and tutorials, feel free to visit our Blog page.
Cite this Post
Use the following entry to cite this post in your research:
Nathan Y.. (Aug 23, 2024). How to Create a Retail Planogram using Computer Vision. Roboflow Blog: https://blog.roboflow.com/how-to-create-a-retail-planogram-using-computer-vision/