
Ship and forget is a myth. The reality is that your model is at its best the moment you finish training; from there, the real world starts trying to break it.
In production, lighting shifts, cameras get bumped, and new looks different every day. If you aren't monitoring your inference health, you’re flying blind. You should be watching for the subtle slide in confidence, the creep in latency, and the data drift that turns a high-performing model into a liability.
Inference health is the pulse of your vision system. This guide dives into how to track latency, uptime, and confidence trends so you can spot the production gap before it impacts your bottom line.
Inference monitoring in Roboflow
What Is Inference In Computer Vision?
Inference is the step where a trained model is used to make predictions on new images or video frames. In computer vision, this means giving an image to the model, and getting results such as detected objects, class labels, or segmentation masks.
Inference in computer vision
The inference process includes capturing an image, preparing it for the model, running the model, and using the results in the application. Problems at any of these steps can impact speed or accuracy, which is why inference needs to be monitored in production.
Why Monitor Inference Health?
In the real world, entropy is the baseline. Lenses get dusty, factory lighting shifts with the seasons, and "Product A" eventually gets a packaging redesign that your training set never saw. This is data drift in action, and it’s a silent killer.
Modern vision engineering treats models as living systems. We track latency, uptime, and confidence trends because they are the early warning signs of a system in trouble. Monitoring allows you to:
- Catch the "Silent Slide": Identify drops in confidence before they turn into false negatives.
- Kill Bottlenecks: Spot exactly where in the pipeline, from image capture to post-processing, your frames are getting hung up.
- Close the Active Learning Loop: Automatically flag the edge cases your model is struggling with so you can label them and retrain.
Model monitoring is the difference between a project that looks good in a slide deck and a system that actually delivers value on the factory floor.
Core Metrics for Inference Health Monitoring
Inference health boils down to a few measurable signals that tell you if your system is thriving.
Inference Latency
Latency is the time elapsed from the moment a photon hits your sensor to the moment your system makes a decision. If your model is too slow, it doesn't matter how accurate it is: the defect has already passed the sorter, the robot has already missed the grasp, or the safety hazard has already occurred.
Latency-sensitive scenarios include:
- Defect detection on conveyor belts: If detection is slow, faulty items may pass before they can be removed.
- Automated assembly lines: Robots need fast visual feedback to pick and place parts correctly. Delays cause timing problems and slow production.
- Industrial safety monitoring: Safety cameras must react quickly when someone enters a restricted area. Delays reduce safety.
- Autonomous systems: Perception systems must detect obstacles very fast to make safe decisions.
Monitoring latency against your historical baseline is the only way to spot a degrading system before it stalls your line.
Uptime
Uptime monitoring measures whether the inference infrastructure remains operational and responsive over time. If your inference service is running but returning 404s or empty tensors, your system is effectively down. You need to track the telemetry that actually impacts your bottom line:
- Request Success Rate: If your error rate climbs, your model is failing its mission. Track every failed request as a potential production escape.
- Resource Saturation: Watch your CPU and GPU utilization. High usage doesn't just slow things down; it’s a leading indicator of an impending thermal throttle or memory leak.
- Memory Leaks: If your RAM usage is a staircase going up, your system is likely becoming unstable.
Set aggressive alerts for availability drops, rising error rates, and resource saturation, so you can intervene before your line stops.
Data drift
Data drift is the gap between the "perfect" world of your training set and the messy reality of production. It’s what happens when the sun hits the factory floor at a new angle in July, or when a supplier changes the shade of plastic on a sub-component. The model doesn't crash - it just starts guessing.
Common signals that indicate data drift include:
- The Confidence Slide: If your average confidence scores are trending down, your model is seeing things it doesn't recognize. That’s your cue to start sampling and labeling.
- Class Frequency Shifting: If your "Defect" count suddenly spikes or vanishes, the world has changed, not just the parts.
- Metadata Correlation: Use tags like
camera_idorlocationto isolate drift. Is the model failing everywhere, or just on the line where a technician bumped the camera lens?
Confidence trends
Prediction confidence shows how sure the model is about its results. In production, this is your best leading indicator of trouble. Accuracy is a lagging metric - by the time you realize your accuracy is down, you’ve already shipped bad parts. Confidence drops happen first. If your scores are sliding, your model is essentially telling you, "I’m guessing here."
Practical uses of confidence monitoring include:
- Active learning triggers: Low confidence results can be sent for human review and labeling to improve the model.
- Confidence threshold tuning: By watching confidence scores, teams can choose better cutoffs to balance missing defects and false alarms.
- Workflow automation: Low confidence cases can go to manual checks, while high confidence cases can be handled automatically.
- Per class performance: Tracking confidence by class shows which object types the model struggles with in real use.
Tracking confidence distributions over time gives you the foresight to retrain and redeploy before your customers ever see a mistake.
How Do I Know It's Still Working?
In computer vision, "running" and "working" are two very different things. A model can spin up and return predictions all day long, but if the world has changed, those predictions are just noise.
To make sure your system hasn't secretly quit on you, track these five vital signs:
- Latency Stability: Is your response time flat? If your inference is getting sluggish, you're likely hitting a hardware bottleneck or thermal throttling on your edge device.
- Service Reliability: Is your success rate 100%? Up means responding with valid data every single time, not just being reachable.
- Confidence Baselines: Is your average certainty holding steady? A dip here is your first warning that your model is seeing unknown unknowns.
- Consistency in Output: Is your "Defect per Hour" count suddenly spiking? Unless your factory just fell apart, it’s probably data drift or a bumped camera lens.
- Zero Malformed Outputs: Are you getting empty tensors or weirdly shaped masks? System-level glitches often hide in your edge cases.
Inference Monitoring in Roboflow
Roboflow provides built-in tools to monitor inference behavior for deployed computer vision models in production. Inference monitoring is automatically enabled for models served through Roboflow’s hosted APIs and supported self-hosted inference servers.
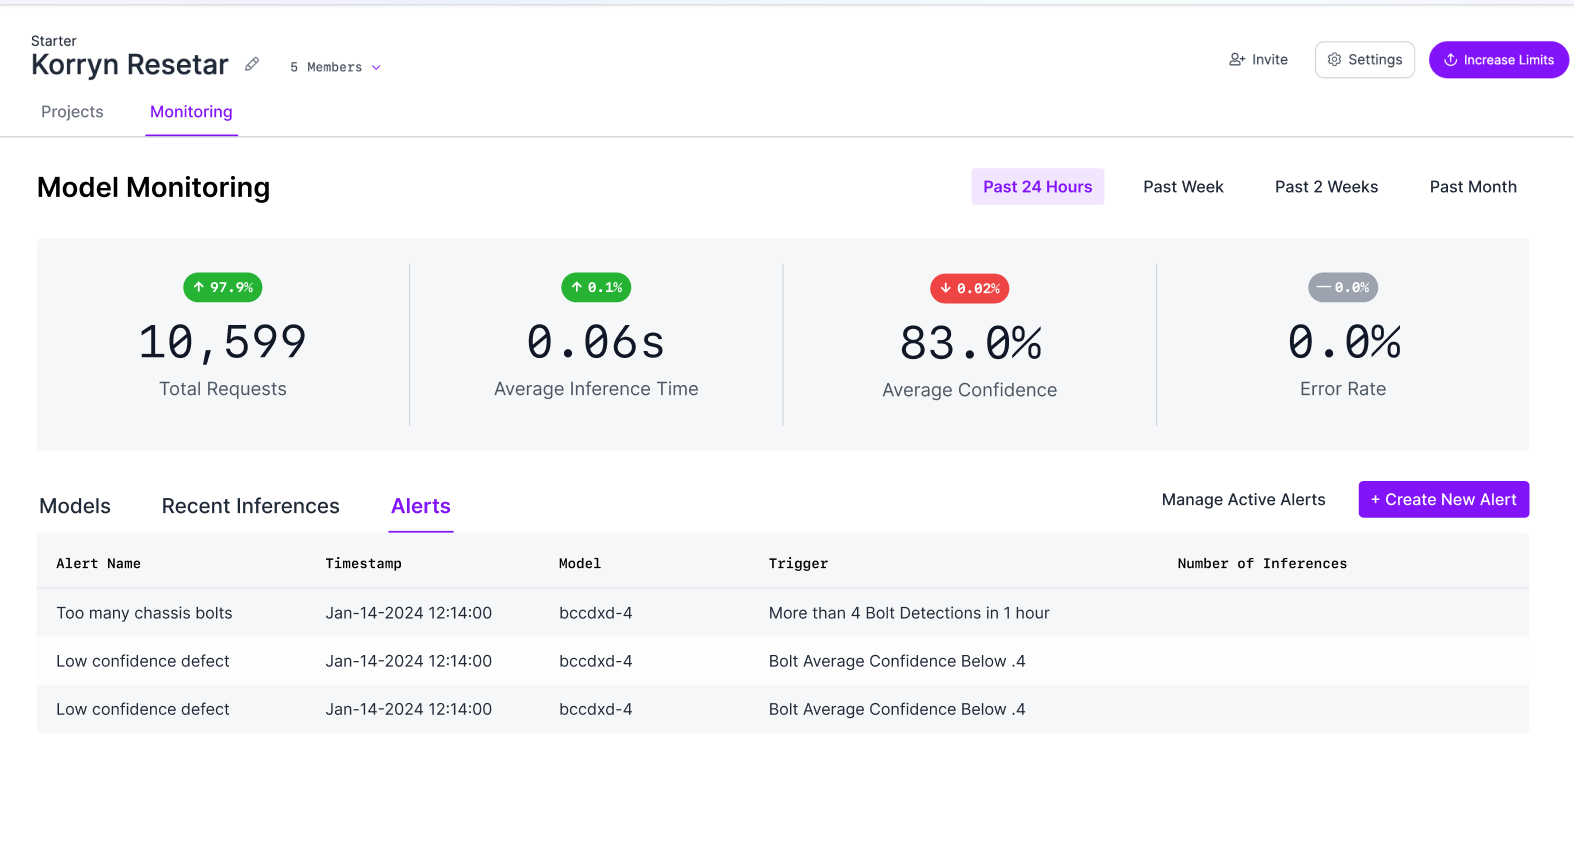
Using the Model Monitoring Dashboard
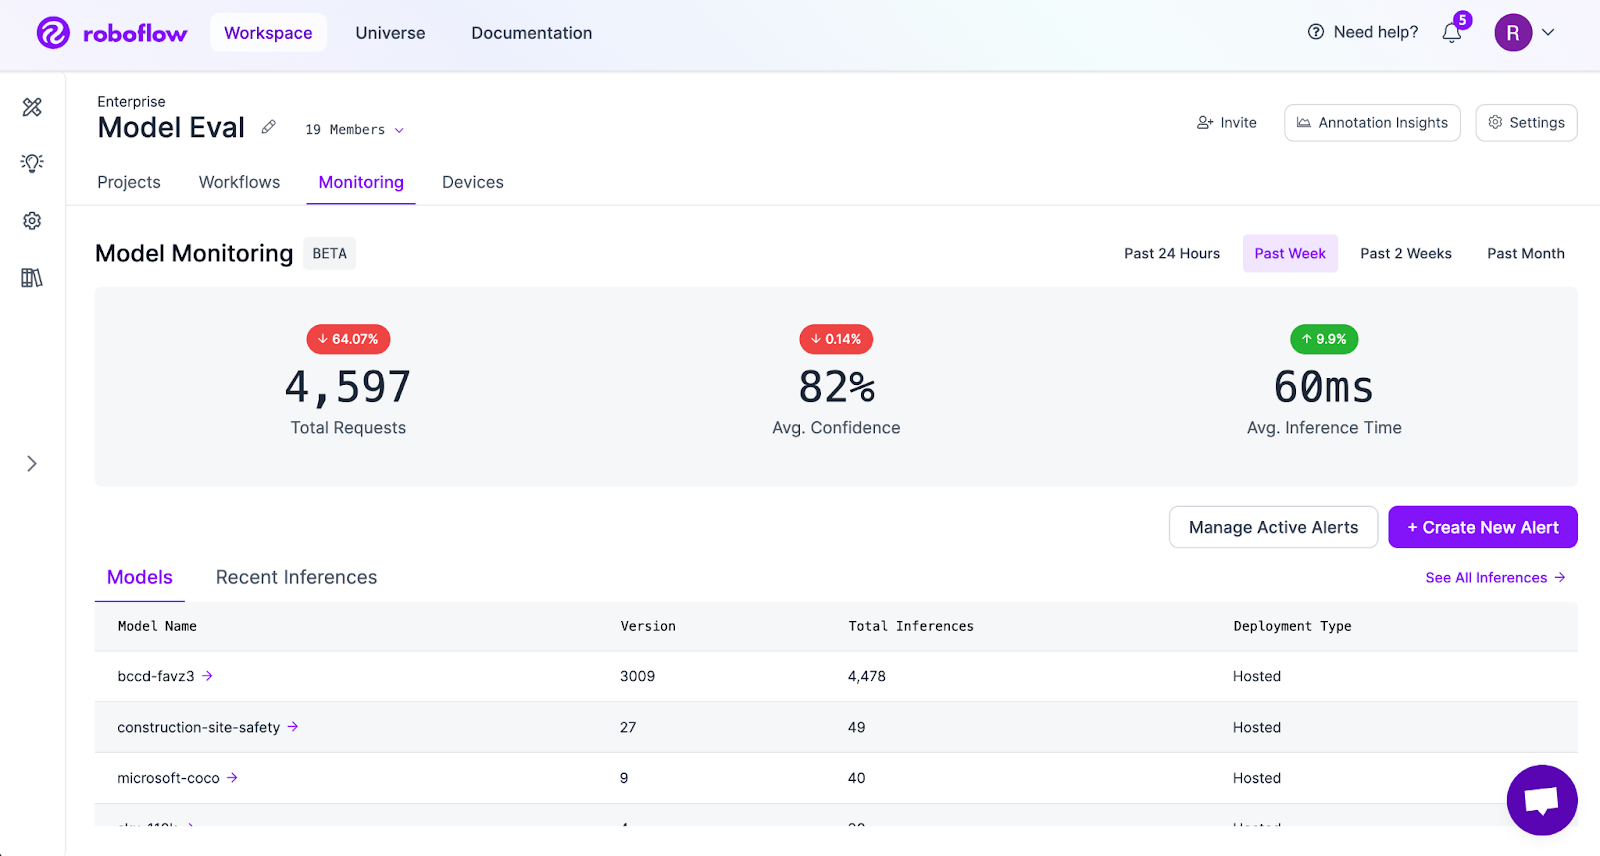
The model monitoring dashboard provides a centralized view of inference activity across all deployed models. Teams can track total inference requests, average prediction confidence, and average inference time across selected time ranges.
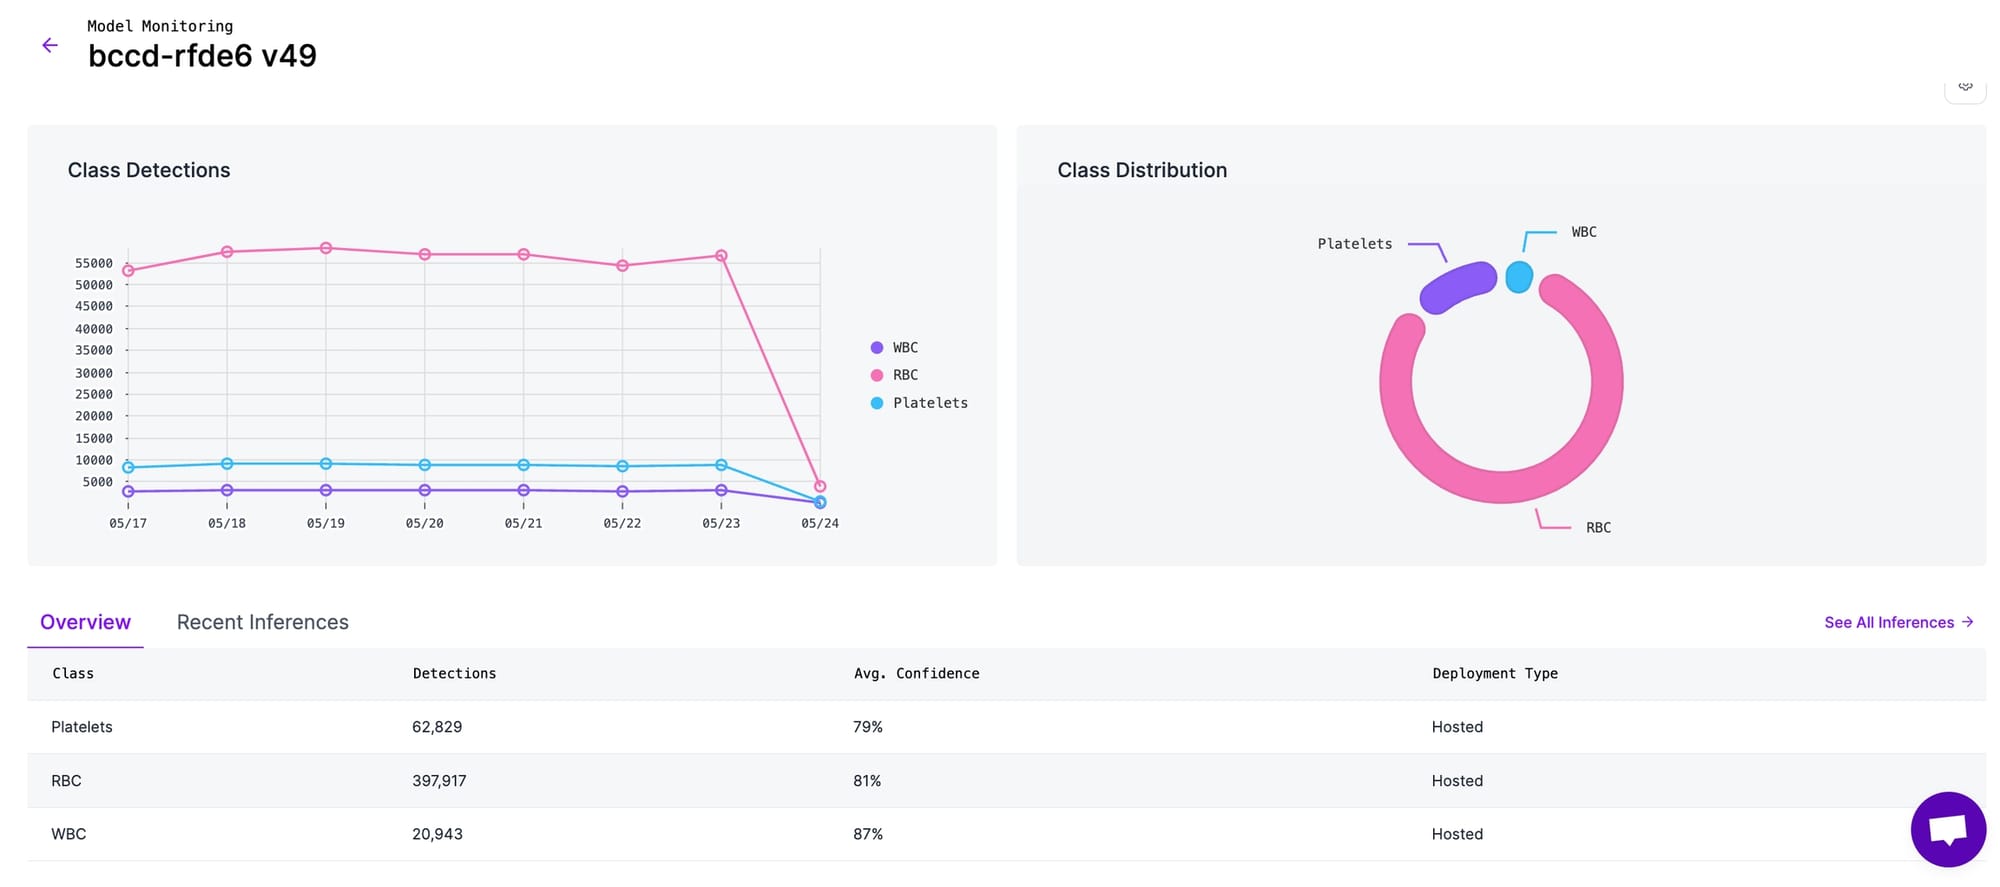
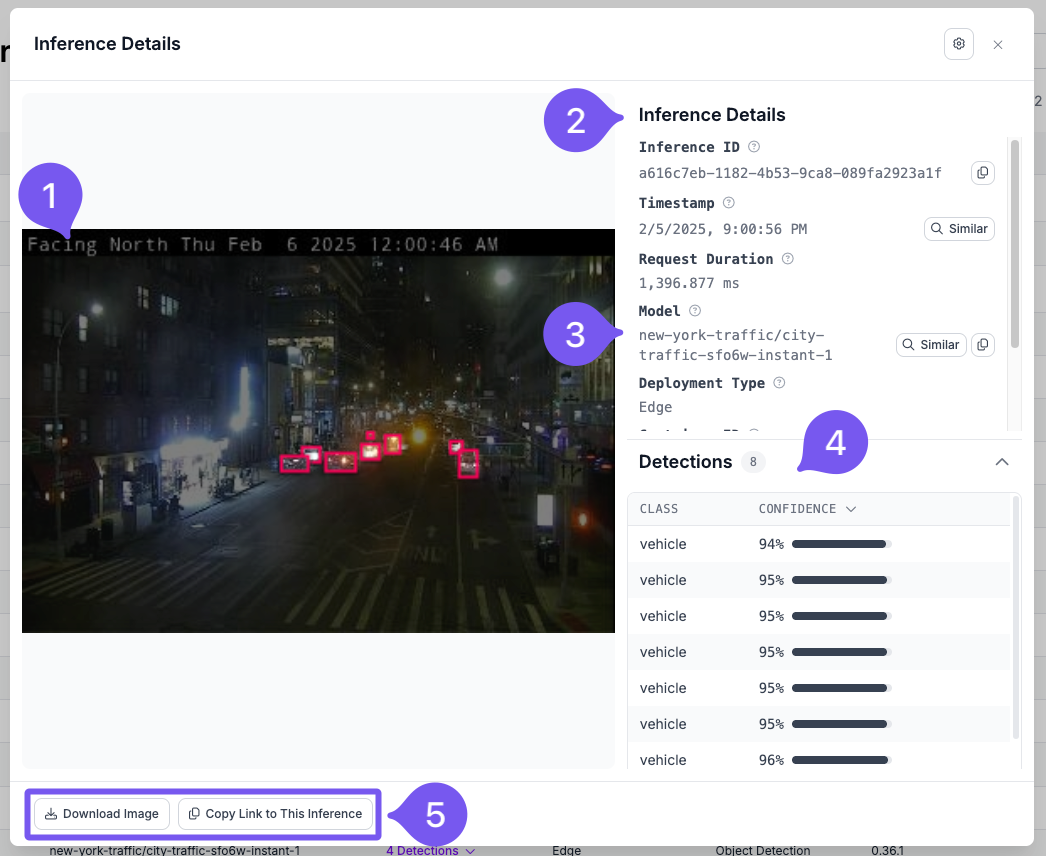
Individual model dashboards display per-class detection counts and class-wise distribution. The Inferences view allows teams to inspect individual predictions along with confidence scores, model version, and processing time, which is useful for debugging edge cases and investigating failures.
Enabling inference images and metadata
Inference images can be captured by connecting a dataset upload block in Workflows or by enabling active learning rules. This allows teams to visually inspect real production inputs and understand failure cases.
Custom metadata such as camera ID, location, device ID, or time of day can be attached to each inference using the Model Monitoring API. This enables filtering and analysis of inference behavior by location, device, or operating conditions.
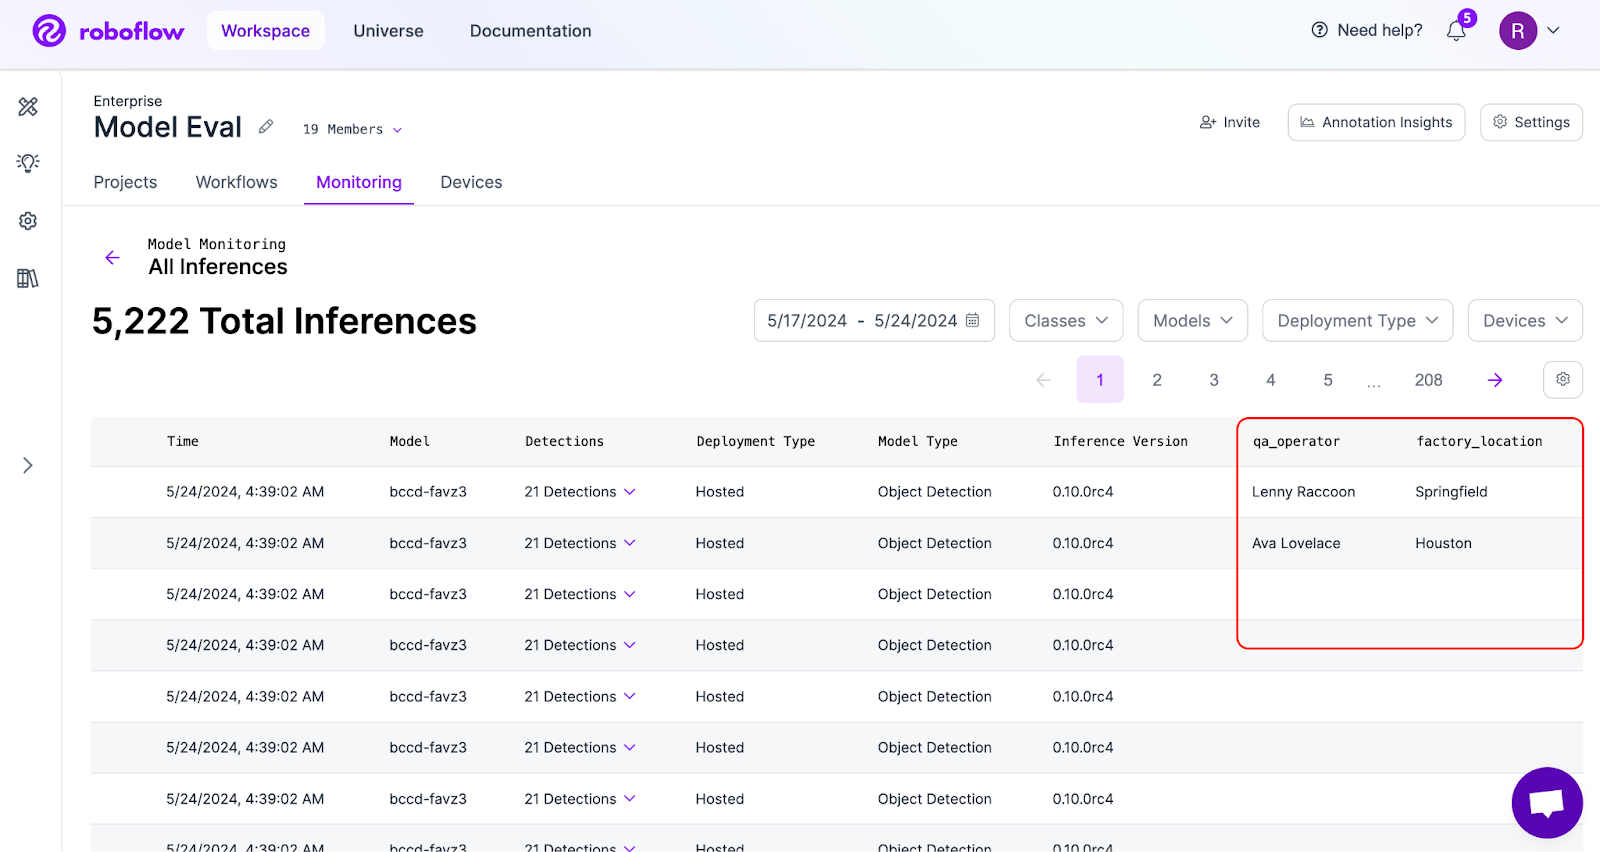
You can add this data using a simple HTTP request. Every inference response from the Hosted Inference API or the Inference Container includes an inference_id in the response. You can use this inference_id to send a POST request to:
https://api.roboflow.com/:workspace/inference-stats/metadataand attach additional metadata to that specific inference. For full details, refer to the Custom Metadata documentation.
Setting up alerts
Configurable alerts allow teams to receive notifications when inference health metrics cross defined thresholds. Common alerts include drops in average confidence, increases in inference latency, unexpected changes in request volume, and inference server downtime.
Alert thresholds can be adjusted based on operational requirements, and alert history helps identify recurring issues. For information on setting up Alerts, visit the Alerts documentation page.
How to Monitor Inference Health Conclusion
Effective monitoring follows a handful of clear practices. Teams should track real-world performance using core metrics, inspect failure cases visually to understand root causes, detect drift early through confidence and output patterns, collect high-value samples for retraining, and maintain version control to support continuous improvement.
Deployment is only the start. Long-term success depends on sustained performance in real-world operation. Investing in inference monitoring early improves reliability, reduces maintenance effort, and builds confidence in production AI systems. Modern monitoring tools, such as Roboflow Model Monitoring, make it possible to apply these practices at scale.
Cite this Post
Use the following entry to cite this post in your research:
Timothy M. (Feb 18, 2026). How Do I Monitor Inference Health?. Roboflow Blog: https://blog.roboflow.com/monitor-inference-health/