
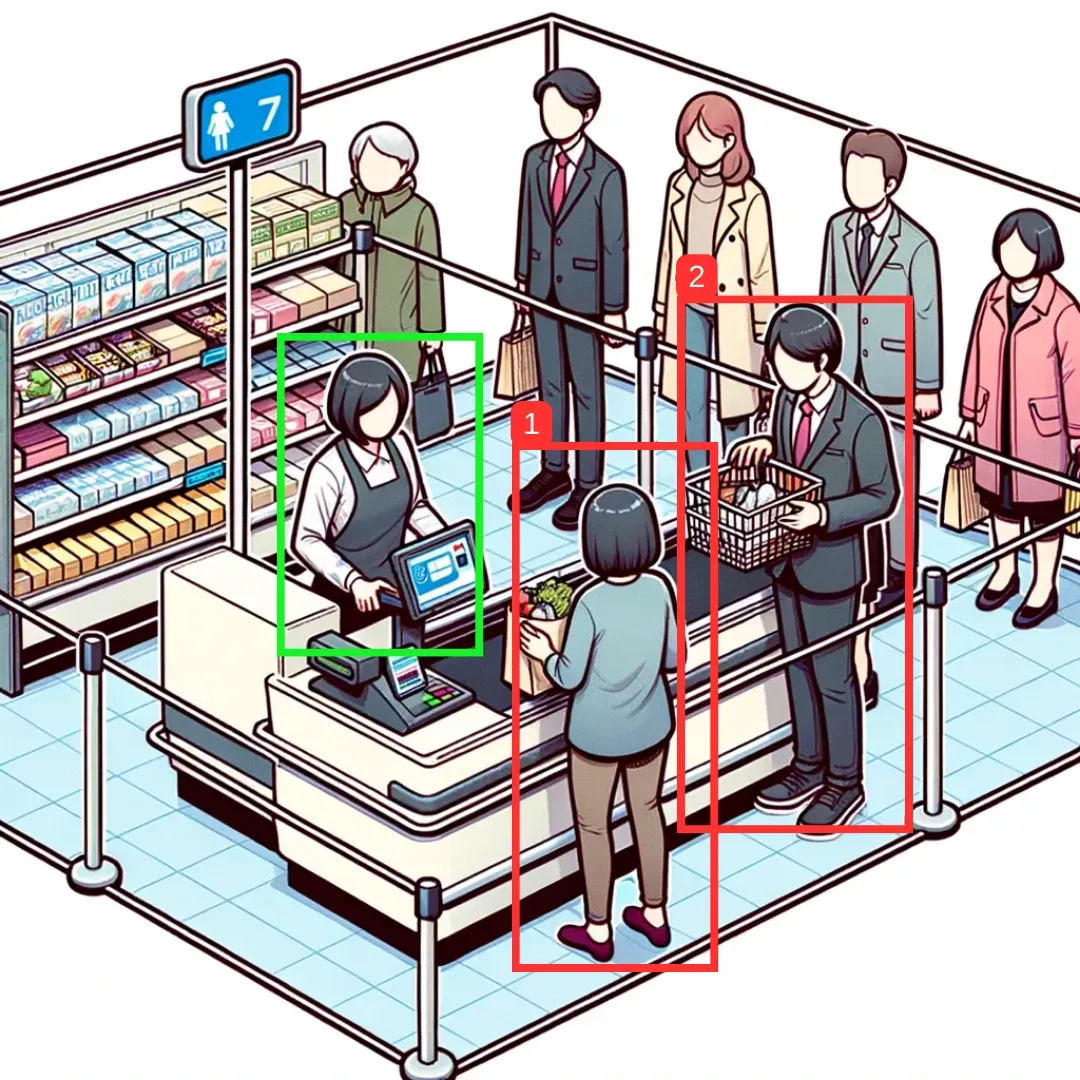
You can use computer vision to derive insights from how customers behave in retail queues. For example, you can measure the number of people who are in a queue at any given time, for how long each person has been in a queue, and for how long a queue has more than a certain number of people.
In this article, we’ll explore how computer vision can be applied to queue management and analysis in the retail industry. We'll also walk through relevant applications of this technology, a tutorial on how you can apply computer vision to understand how long a person is in a check-out line, and how queue analytics can guide important decisions to alter the in-store customer experience.
By the end of this guide, we will write a program that measures for how long a person is in a line, and the average time spent in line. Our code will be written to process a video, but could be configured to work with a real-time system.
Without further ado, let’s get started!
Understanding Object Tracking: Computer Vision in Retail
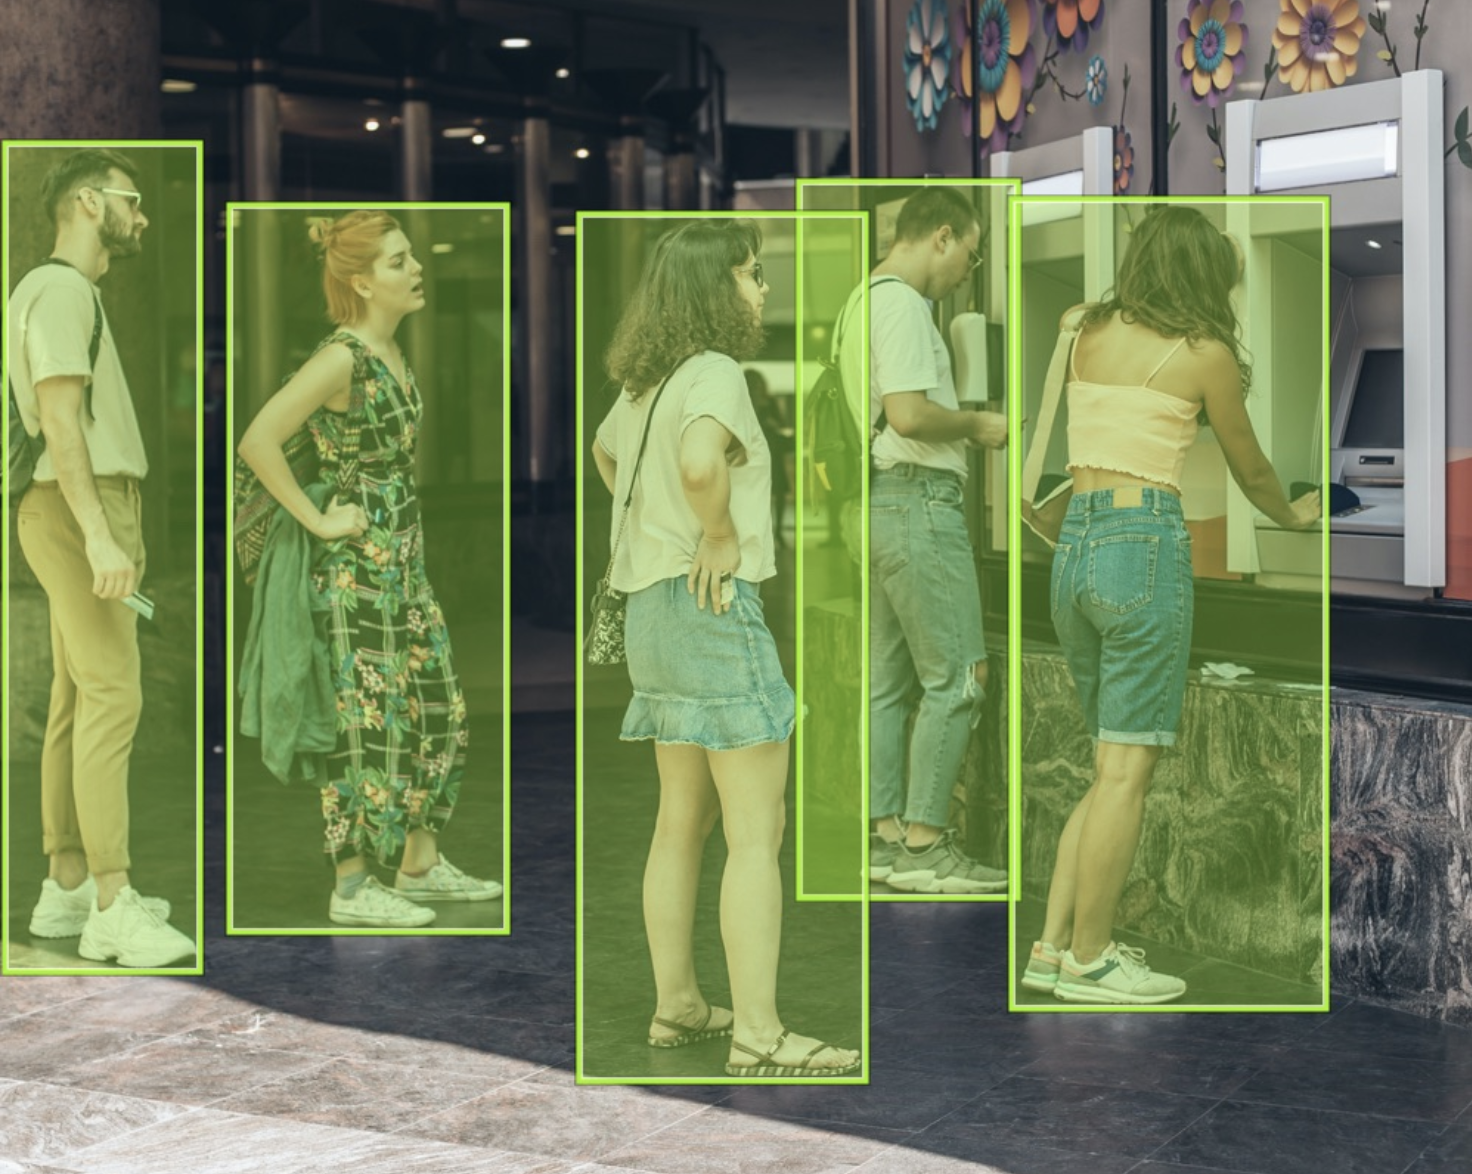
Object tracking is a computer vision technique that can detect and recognize objects like humans across video frames and track their motion over time. This allows stores to gather real-time analytics on customer behavior by recording their movement through the store.
This information can be used to optimize operations to enhance customer experiences, such as by opening extra registers when long queues are spotted, or when people have been waiting longer than a specific period of time.
Retail Applications for Queue Management and Object Tracking
Computer vision is changing the landscape of retail storefronts. The largest retail companies on the bleeding edge of technological innovation have been taking advantage of computer vision for years. However, it no longer takes a team of machine learning experts building a computer vision solution from scratch. In fact, retailers of all sizes are now able to bring the power of computer vision into their own storefronts.
By integrating computer vision near checkouts, retailers can deploy smart cameras with computer vision analytics to keep an eye on queue lengths and wait times in real time. It can help with understanding where congestion occurs in queues, tracking peak customer rushes, and figuring out when more staff are needed at the checkout.
Let’s look at some specific applications of queue management in retail.
Safety Applications
Object tracking can help ensure that retail lines do not obstruct emergency exits, idle zones, or access corridors. Real-time warnings can notify workers if dangerous congestion accumulates in specific regions. Similarly, in-store security can be improved by identifying unauthorized access or questionable behavior near checkout lanes.
Efficiency Applications
Continuous queue monitoring results in collecting information about peak customer traffic times and workforce requirements. During peak hours, businesses can use real-time queue data to open new checkout lanes on the fly. A more pleasant shopping environment is created by reducing wait times and ensuring a smooth checkout process.
Customer Self-Service
Shoppers are getting well-acquainted with self-checkout lanes at grocery stores and other big box locations, but it’s getting even easier than that. In some retail locations, customers can simply add products to their cart while a computer vision-powered application can add up the total cost within the cart. Customers can then pay for their goods before leaving the store, skipping the lines or the need to first empty and then refill their cart.
Inventory Management
Retailers are using cameras equipped with computer vision to automatically scan shelves to alert to depleted inventory. Having a program that does inventory and price tag auditing can save hours of employees’ time, allowing them to spend more time with the customer. Automated inventory monitoring can also be more accurate than having store employees keep track of inventory moving in and out of the door.
Marketing and Sales
Computer vision can help recognize repeat customers and alert them to deals or similar products that they have been interested in in the past. It can also monitor interest by measuring eye and body movements, such as time spent in a certain department looking at specific merchandise, and can offer up recommendations for other products or deals in the store.
Theft Prevention
If retailers can monitor what customers are putting in their carts or on their person in order to provide a seamless self-checkout experience, then they can also monitor which customers are trying to leave the store with merchandise without paying. Computer vision can be more accurate and less biased than manually deploying security to keep an eye on all guests within a store.
Applying Object Tracking for Queue Monitoring
Let’s use a trained object detection model to track people and understand how long they spend in a queue at check-out. In this guide, we’ll focus on how to apply an object detection model rather than how to train an object detection model. For more information on creating your own object detection model, take a look at our guide to RF-DETR.
We'll be using the pre-trained object detection model, RF-DETR, and Supervision’s object-tracking capabilities. Supervision is an open-source toolkit for any computer vision project.
We'll also use the Roboflow Inference Server, a microservice interface that operates over HTTP, for running our model. This service offers both a Python library and a Docker interface. For this guide, we will use the Python library.
Code for Capturing and Analyzing Queue Times
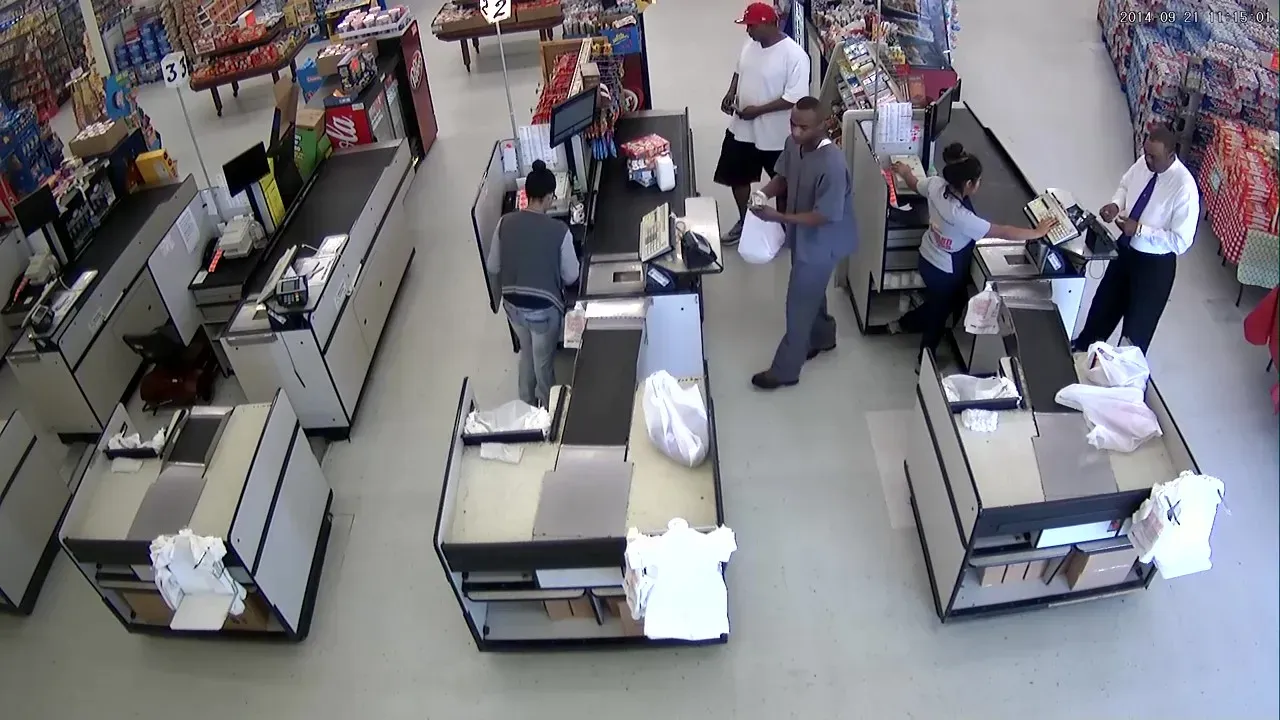
Our objective is to create a boundary around the check-out lines that can be considered as a region of interest (ROI), and while a person is within this boundary, we will keep track of how much time goes by. Finally, we’ll be able to calculate the average time that people spend in the queue with respect to the video we are analyzing.
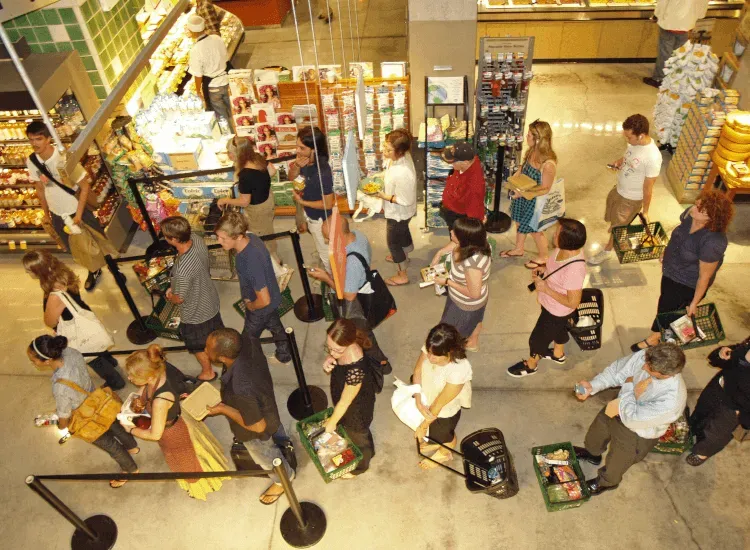
We’ve downloaded a relevant video (as shown below) from the internet to analyze. You can do the same or use your own relevant videos.
Let’s get started!
Step 1: Setting Up Roboflow Inference and Supervision
First, we’ll need to install the Roboflow Inference and Supervision packages using the following command.
pip install inference supervisionStep 2: Defining Boundaries for the Check-out Lines
Using PolygonZone, a helpful tool that lets you upload an image and draw points on it to create coordinates, you can get the coordinates of the queue lines of our retail store. To draw the polygon, start from a point, draw the required shape, and end back to the same point as shown below. After this, the coordinates will be reflected, and you can copy and use them as your Region of Interest (ROI).
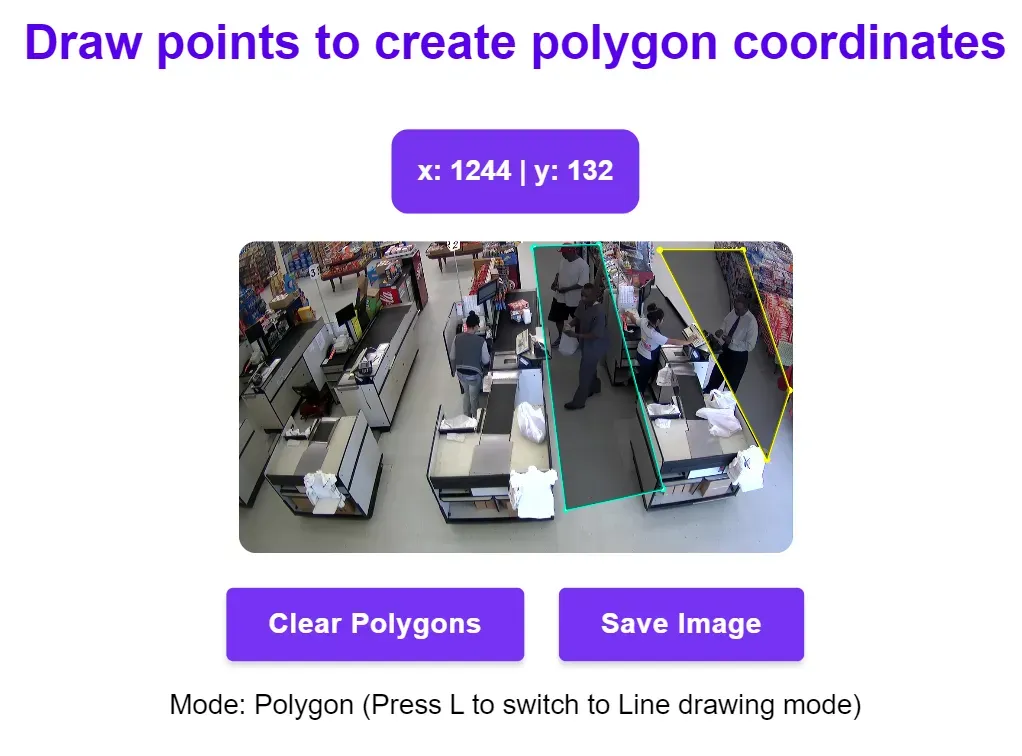
For the video used in this tutorial, the ROI coordinates are as follows:
# first check-out line
np.array([[747, 622],[707, 38],[807, 22],[931, 654],[747, 622]])

# second check-out line
np.array([[1039, 62],[1243, 546],[1271, 502],[1231, 286],[1107, 34],[1039, 62]])
Step 3: Loading the Model
Here’s the link to the Google Colab notebook used for the next steps of this tutorial: notebook.
First, we need to open the video and load our RF-DETR model.
# Load the RF-DETR model
model = get_roboflow_model(model_id="rfdetr-base")

# Open the video file for analysis
video_path = "/path_to_your_video/video_name.mp4"
cap = cv2.VideoCapture(video_path)
Step 4: Setting Up the VideoWriter
We'll set up parameters to save our processed video. This video will visually show how the computer vision system is tracking individuals in the queue. You could update this code to process video in real time, too.
fps = 20
output_video_path = "/path_to_save_output/output_video_name.mp4"
frame_width = int(cap.get(3))
frame_height = int(cap.get(4))
fourcc = cv2.VideoWriter_fourcc(*'mp4v')
out = cv2.VideoWriter(output_video_path, fourcc, 20.0, (frame_width, frame_height))
Step 5: Analyzing Queue Behavior
Our goal is to track each individual's time spent in the queue. We'll use the RF-DETR model to identify people and calculate their time in our predefined regions of interest (check-out lines).
Before diving into the main loop, initialize the necessary data structures and files:
people_enter_queue = {}
timespent = []
filename = "queue_time.csv"
file = open(filename, 'w', newline='')
csv_writer = csv.writer(file)
frame_count = 0
We'll iterate through each frame of the video, detect people using the model, and track their movement relative to the checkout lines.
while cap.isOpened():
    success, frame = cap.read()
    if success:
        annotated_frame = frame.copy()
Highlight and draw the areas that represent checkout lines on the frame.
while cap.isOpened():
    success, frame = cap.read()
    if success:
        annotated_frame = frame.copy()

       cv2.drawContours(annotated_frame, [roi1_coords], -1, (255, 0, 0), 3)
       cv2.drawContours(annotated_frame, [roi2_coords], -1, (255, 0, 0), 3)

       # Run RF-DETR tracking on the original frame
       results = model.infer(frame)
       detections = sv.Detections.from_inference(results[0])
       detections = tracker.update_with_detections(detections)

       # Get the boxes and track IDs
       boxes = detections.xyxy


       if type(detections.tracker_id) == np.ndarray:
          # track_ids = results[0].boxes.id.int().cpu().tolist()
          track_ids = detections.tracker_id

          # Check if center of bounding boxes is inside the ROI
          for box, track_id in zip(boxes, track_ids):

              print("Tracking:",track_id)

              x1, y1, x2, y2 = box
              x1, y1, x2, y2= int(x1), int(y1), int(x2), int(y2)

              # print(x1,y1,x2,y2)
              x = (x1+x2)/2
              y = (y1+y2)/2

              # Visualize the people being tracked in queues on the frame
              if ((cv2.pointPolygonTest(roi1_coords, (x,y), False) > 0) or ((cv2.pointPolygonTest(roi2_coords, (x,y), False)) > 0)):
                  if (str(track_id) not in people_enter_queue):
                    #get timestamp
                    people_enter_queue[str(track_id)] = str(frame_count)

                  cv2.rectangle(annotated_frame, (x1,y1), (x2, y2), (0,255,0), 2)
                  cv2.putText(annotated_frame,"Person id:"+ str(track_id), (x1,y1-5), cv2.FONT_HERSHEY_COMPLEX_SMALL, 1, (20,255,0), 2)
              else:
                print("outside:",track_id)

                if (str(track_id) in people_enter_queue):
                  #get timestamp
                  exit = frame_count

                  #get first timestamp
                  start = people_enter_queue[str(track_id)]

                  time_spent = (exit - int(start))/fps
                  print("time spent ", time_spent, "by person", track_id)

                  timespent.append(time_spent)

                  # Write string to the file
                  csv_writer.writerow(["Time spent by person "+ str(track_id)+" in line is "+str(time_spent)])

                  people_enter_queue.pop(str(track_id))

       out.write(annotated_frame)
       frame_count = frame_count+1


   else:
      #for people still in line at the end of the video
      for person in people_enter_queue:

        #get timestamp
        exit = frame_count

        #get first timestamp
        start = people_enter_queue.get(person)

        time_spent = (exit - int(start))/fps
        print("time spent ", time_spent, "by person", person)

        timespent.append(time_spent)

        # Write string to the file
        csv_writer.writerow(["Time spent by person "+ str(person)+" in line is "+str(time_spent)])
Once all frames are processed, we can compute the average wait time and save it to the CSV file.
average = sum(timespent)/len(timespent)
csv_writer.writerow(["Average time spent in line is "+str(round(average,3))])
Step 6: Wrapping Up and Finalizing Outputs
After completing the analysis, close and save your video and data files properly.
cap.release()
out.release()
cv2.destroyAllWindows()
file.close()
print(f"Output video saved at: {output_video_path}")
The output in your CSV file will look like this:
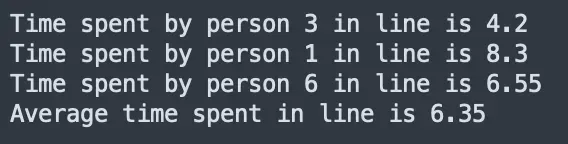
All numbers are measured in seconds.
Your output video will look like this:
Computer Vision in Retail
In this guide, we used Roboflow Inference to deploy a computer vision model that detects people in supermarkets. We used PolygonZone to designate specific areas at checkouts that we can use to track waiting times. We then used the supervision Python package to track the location of people in a queue between frames so we can measure for how long a given person is in a queue.
We looked at how retailers can gain valuable insights from observing queues using computer vision. These insights can lead to making more informed staffing decisions. For example, a store may hire more people in stores where queues have consistently high wait times, or move staff from shelves to checkouts at any given time if customers have been waiting more than a specified period of time in a queue.
Talk to an AI expert to learn more about how computer vision can elevate service quality, improve operational efficiency, and strengthen safety and compliance.
This article was contributed to the Roboflow blog by Abirami Vina.
Cite this Post
Use the following entry to cite this post in your research:
Contributing Writer. (Mar 13, 2024). Monitor and Analyze Retail Queues Using Computer Vision. Roboflow Blog: https://blog.roboflow.com/monitor-retail-queues/