
Printed Circuit Board (PCB) manufacturing demands precision to ensure reliability and performance in electronic devices. Defects like open circuits, short circuits, or spurious copper can lead to product failures, costly recalls, or safety hazards. I addressed this by building a real-time PCB defect detection system using computer vision, powered by a Roboflow-trained object detection model and a sleek Python GUI.
I leveraged Roboflow Workflows to detect, count, and classify defects, providing clear outcomes like “guaranteed fail” or “further inspection needed by a human.” The Python application displays these results in a modern, user-friendly interface. Here’s how I built it, step by step.
How to Build a PCB Defect Inspection Application with Computer Vision
Let’s dive in!
Part 1: Create the PCB Defect Detection Model
To detect PCB defects like open circuits, mouse bites, missing holes, shorts, spurious copper, and spurs in real-time, we need a robust object detection model. We can source a pre-trained PCB defect detection model from Roboflow Universe and customize it for our needs. Below, we explore the detailed process of data collection, annotation, training, and workflow setup to ensure our model performs reliably in a manufacturing environment.
Collect Images
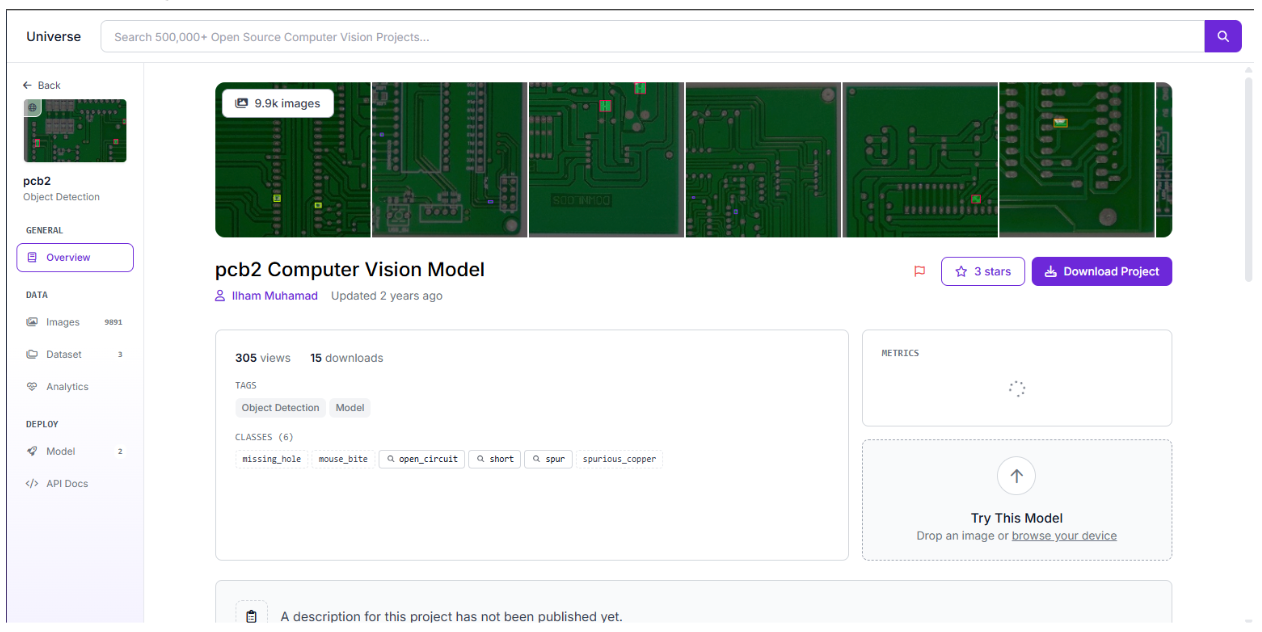
The foundation of any computer vision model is high-quality data. For this project, we require images of PCBs showcasing a variety of defects, such as open circuits (broken conductive paths), mouse bites (small notches in traces), missing holes (absent solder points), shorts (unintended connections), spurious copper (excess copper deposits), and spurs (protruding copper fragments). We can source a dataset from Roboflow Universe by searching for PCB defect detection models, which provides a solid starting point with hundreds of annotated images. However, to make the model robust for our specific environment, we can supplement this with our images if necessary. For this case, this was the model used.
Tips:
- We ensure consistent lighting to minimize noise in images.
- If needed for production purposes, we can capture PCBs from different batches to improve generalization.
- We test images in challenging conditions (e.g., low light) to prepare the model for real-world scenarios if required for production.
Because the project is forked, annotations have already been done, making it easy for us to move on to the next step.
Train the Model
We train our model using Roboflow’s RF-DETR (Nano) architecture, which offers high performance for defect detection with efficient resource usage. Roboflow’s training pipeline is user-friendly, requiring minimal configuration. We enable auto-orient preprocessing to correct image rotations and resize images to 640x640 pixels to ensure consistency, which is critical for PCBs with varied orientations and sizes. Training takes a few hours due to the massive dataset.
After training, we evaluate the model’s performance using the test set. Roboflow provides metrics like precision, recall, and mAP (mean Average Precision). Our model achieves a mAP of 0.99, indicating excellent performance across defect types. We test the model with sample PCB images to confirm it correctly identifies defects like “spurious_copper” with accurate bounding boxes and high confidence scores. If our model underperforms, we can add more images, refine annotations, or adjust training parameters (e.g., increase epochs).
Tips:
- We monitor training metrics in Roboflow to detect underfitting or overfitting.
- We test with challenging images (e.g., low-light PCBs) to ensure robustness.
- We save the trained model version in Roboflow for reproducibility.
Create a Workflow
To enable real-time inference, we create a Roboflow Workflow, starting with the “Detect, Count, and Visualize” sample workflow. This workflow detects defects, counts them, and generates a visualized image with bounding boxes around each defect. To go beyond, we can add decision-making logic. We can include a custom Expression Block to evaluate detected defects and output an inspection result.
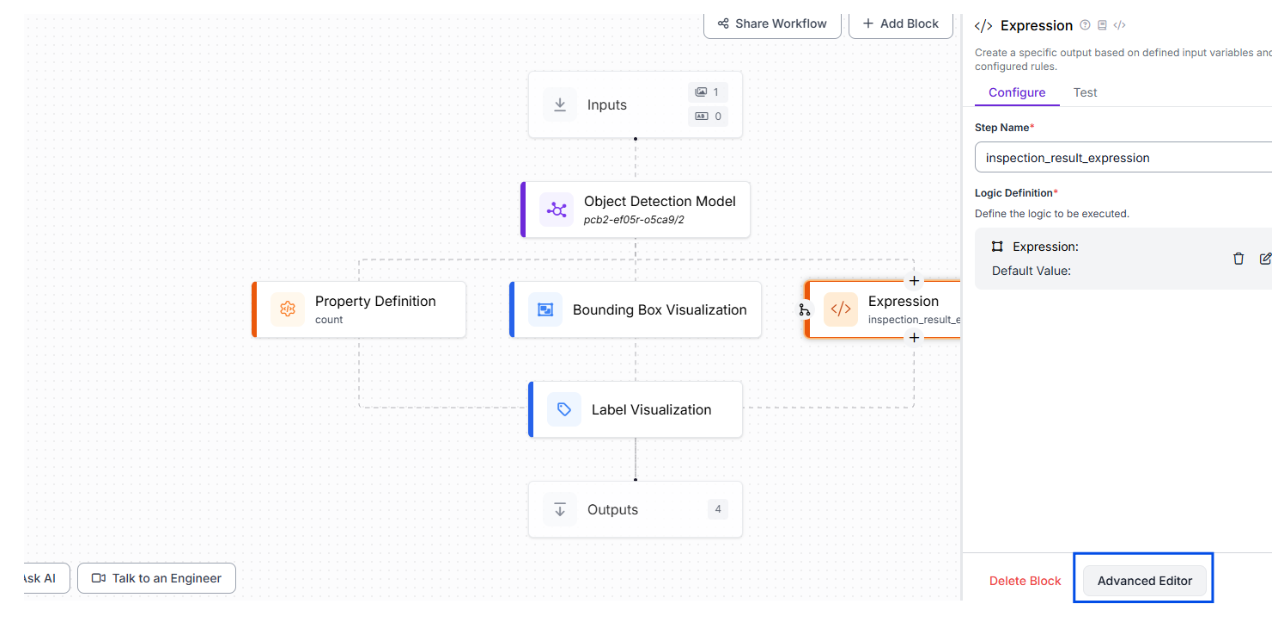
Below is the expression block configuration and its functionality:
{
  "type": "roboflow_core/expression@v1",
  "name": "inspection_result_expression",
  "data": {
    "predictions": "$steps.model.predictions"
  },
  "switch": {
    "type": "CasesDefinition",
    "cases": [
      {
        "type": "CaseDefinition",
        "condition": {
          "type": "StatementGroup",
          "statements": [
            {
              "type": "BinaryStatement",
              "left_operand": {
                "type": "DynamicOperand",
                "operand_name": "predictions"
              },
              "comparator": {
                "type": "any in (Sequence)"
              },
              "right_operand": {
                "type": "StaticOperand",
                "value": [
                  "open_circuit",
                  "mouse_bite",
                  "missing_hole",
                  "short"
                ]
              }
            }
          ]
        },
        "result": {
          "type": "StaticCaseResult",
          "value": "guaranteed fail"
        }
      },
      {
        "type": "CaseDefinition",
        "condition": {
          "type": "StatementGroup",
          "statements": [
            {
              "type": "BinaryStatement",
              "left_operand": {
                "type": "DynamicOperand",
                "operand_name": "predictions"
              },
              "comparator": {
                "type": "any in (Sequence)"
              },
              "right_operand": {
                "type": "StaticOperand",
                "value": [
                  "spurious_copper",
                  "spur"
                ]
              }
            }
          ]
        },
        "result": {
          "type": "StaticCaseResult",
          "value": "further inspection needed by human"
        }
      },
      {
        "type": "CaseDefinition",
        "condition": {
          "type": "StatementGroup",
          "statements": [
            {
              "type": "UnaryStatement",
              "operand": {
                "type": "DynamicOperand",
                "operand_name": "predictions"
              },
              "operator": {
                "type": "(Sequence) is not empty"
              },
              "negate": true
            }
          ]
        },
        "result": {
          "type": "StaticCaseResult",
          "value": ""
        }
      }
    ],
    "default": {
      "type": "StaticCaseResult",
      "value": ""
    }
  },
  "predictions": "$steps.model.predictions",
  "data_operations": {
    "predictions": [
      {
        "type": "DetectionsPropertyExtract",
        "property_name": "class_name"
      }
    ]
  }
}Explanation of the Expression Block:
We use this block to process detected defects ($steps.model.predictions) and determine the PCB’s inspection status based on defect severity. We will extract the class_name (e.g., “spurious_copper”) from each prediction using the data_operations section.
Here are the cases that can happen:
- Case 1: If any detected defect is “open_circuit,” “mouse_bite,” “missing_hole,” or “short,” we output “guaranteed fail,” as these critical defects mean the PCB is unusable.
- Case 2: If any defect is “spurious_copper” or “spur,” we output “further inspection needed by human,” as these may be repairable but require manual review.
- Case 3: If no defects are detected (empty predictions list), we output an empty string, indicating a defect-free PCB.
- Default: If none of the conditions match, we output an empty string.
Once the logic is done through Roboflow, it provides us with some JSON that our Python application displays. We set the confidence threshold to 0.4 to balance sensitivity and precision, ensuring reliable detection without excessive false positives.
Tips:
- We test the workflow in Roboflow’s interface with sample images to verify the expression block’s logic.
- We adjust the confidence threshold (0.3–0.5) based on our model’s performance.
- We ensure the output key (inspection_result_json_output) matches our Python code’s expectations.
Deploy the Model
With our workflow configured, we deploy it via Roboflow’s API for real-time inference. Our workflow outputs three key pieces of data:
- label_visualization: A base64-encoded image or URL showing the PCB with bounding boxes around detected defects.
- inspection_result_json_output: The decision from the expression block (e.g., “guaranteed fail”).
- model_predictions: A list of detected defects with details (class, confidence, position, size).
Next, we can build a Python application with a Tkinter GUI to display these outputs in a modern, user-friendly interface, which we cover next.
Part 2: Build the Python Application
We design our Python application to display the Roboflow Workflow’s outputs (label_visualization, inspection_result_json_output, model_predictions) in a modern, centered, scrollable Tkinter GUI. The application performs no additional processing beyond summarizing defect counts for display purposes. Below, we break the code into sections with explanations.
Setup and Dependencies
We create a virtual environment and install the required packages:
pip install inference-sdk pillow requests python-dotenv
We store our Roboflow API key and workflow details (WORKSPACE_NAME=aarnavs-space, WORKFLOW_ID=pcbspace) in a .env file for security. For guidance on .env files, see this article.
Code Section 1: Imports and Image Processing Function
We will first import libraries and define the process_image function to call the Roboflow Workflow and handle its outputs.
import tkinter as tk
from tkinter import filedialog, messagebox
from inference_sdk import InferenceHTTPClient
import requests
from PIL import Image, ImageTk
from io import BytesIO
import base64
import os
from dotenv import load_dotenv


# Load environment variables from .env file
load_dotenv()


def process_image(image_path):
    client = InferenceHTTPClient(
        api_url="https://serverless.roboflow.com",
        api_key=os.getenv("API_KEY")
    )


    try:
        result = client.run_workflow(
            workspace_name=os.getenv("WORKSPACE_NAME"),
            workflow_id=os.getenv("WORKFLOW_ID"),
            images={"image": image_path},
            use_cache=False  # Disabled caching to see workflow changes immediately
        )

        output = result[0] if result else {}

        # Load visualization image (base64 or URL)
        vis_img = None
        vis_data = output.get("label_visualization")
        if vis_data:
            if isinstance(vis_data, str) and vis_data.startswith("data:image"):
                base64_string = vis_data.split(",")[1] if "," in vis_data else vis_data
                img_data = base64.b64decode(base64_string)
                vis_img = Image.open(BytesIO(img_data))
            elif isinstance(vis_data, str) and (vis_data.startswith("/9j/") or vis_data.startswith("iVBOR")):
                img_data = base64.b64decode(vis_data)
                vis_img = Image.open(BytesIO(img_data))
            elif isinstance(vis_data, str) and vis_data.startswith("http"):
                response = requests.get(vis_data, timeout=10)
                response.raise_for_status()
                vis_img = Image.open(BytesIO(response.content))

        # Save visualization image
        if vis_img:
            vis_img.save("visualization_output.png")

        # Get inspection result and predictions
        inspection_result = output.get("inspection_result_json_output", "No inspection result available")
        predictions = output.get("model_predictions", {}).get("predictions", [])

        # Analyze predictions for majority class
        majority_class = "None"
        class_counts = {}
        if predictions:
            for pred in predictions:
                class_name = pred.get('class', 'Unknown')
                class_counts[class_name] = class_counts.get(class_name, 0) + 1
            majority_class = max(class_counts, key=class_counts.get) if class_counts else "None"

        return {
            'vis_img': vis_img,
            'inspection_result': inspection_result,
            'predictions': predictions,
            'majority_class': majority_class,
            'class_counts': class_counts,
            'raw_output': output
        }

    except Exception as e:
        print(f"Error in process_image: {e}")
        return {
            'vis_img': None,
            'inspection_result': f"Error: {str(e)}",
            'predictions': [],
            'majority_class': "Error",
            'class_counts': {},
            'raw_output': {}
        }
We first import tkinter for the GUI, filedialog and messagebox for file selection and errors, inference_sdk for Roboflow API calls, requests for URL image downloads, PIL for image handling, and python-dotenv for loading environment variables. Then, we load environment variables (API_KEY, WORKSPACE_NAME, WORKFLOW_ID) from a .env file using load_dotenv() for secure configuration. After this, we define process_image to send the selected image to the Roboflow Workflow. For displaying the label_visualization, we can covert the provided robolfow image to base64 data or download from a URL, creating a PIL Image object for display, and saving it as visualization_output.png. We extract inspection_result_json_output and model_predictions, computing majority_class and class_counts for display purposes (e.g., “spurious_copper: 4 (100.0%)”) without altering the workflow’s data. Lastly, we catch exceptions (e.g., network errors, invalid base64) to return a safe default dictionary, ensuring the GUI remains responsive.
Code Section 2: GUI Class Initialization
Next, we will set up the modern, centred, scrollable Tkinter interface in the PCBInspectionGUI class.
class PCBInspectionGUI:
    def __init__(self, root):
        self.root = root
        self.root.title("PCB Defect Inspection")

        # Get screen dimensions and center window
        screen_width = root.winfo_screenwidth()
        screen_height = root.winfo_screenheight()
        window_width = min(1200, int(screen_width * 0.8))
        window_height = min(900, int(screen_height * 0.8))

        # Center the window
        x = (screen_width - window_width) // 2
        y = (screen_height - window_height) // 2
        self.root.geometry(f"{window_width}x{window_height}+{x}+{y}")

        self.root.configure(bg="#1E2A44")

        # Font styles - responsive to screen size
        base_font_size = max(10, min(16, int(screen_width / 100)))
        self.header_font = ("Segoe UI", base_font_size + 6, "bold")
        self.label_font = ("Segoe UI", base_font_size)
        self.button_font = ("Segoe UI", base_font_size, "bold")
        self.text_font = ("Segoe UI", base_font_size - 2)

        # Colors
        self.bg_color = "#1E2A44"
        self.accent_color = "#00C4B4"
        self.secondary_color = "#FF6F61"
        self.text_color = "#FFFFFF"
        self.frame_color = "#2A3B5A"

        # Create main canvas with scrollbar
        main_canvas = tk.Canvas(self.root, bg=self.bg_color, highlightthickness=0)
        main_scrollbar = tk.Scrollbar(
            self.root,
            orient=tk.VERTICAL,
            command=main_canvas.yview,
            bg=self.bg_color,
            troughcolor=self.frame_color,
            highlightthickness=0
        )
        scrollable_frame = tk.Frame(main_canvas, bg=self.bg_color)

        scrollable_frame.bind(
            "<Configure>",
            lambda e: main_canvas.configure(scrollregion=main_canvas.bbox("all"))
        )

        main_canvas.create_window((0, 0), window=scrollable_frame, anchor="nw")
        main_canvas.configure(yscrollcommand=main_scrollbar.set)
        main_canvas.pack(side=tk.LEFT, fill=tk.BOTH, expand=True)
        main_scrollbar.pack(side=tk.RIGHT, fill=tk.Y)

        # Main container frame - centered
        container_frame = tk.Frame(scrollable_frame, bg=self.bg_color)
        container_frame.pack(expand=True, fill=tk.BOTH)

        # Main frame - all content goes here, centered
        main_frame = tk.Frame(container_frame, bg=self.bg_color)
        main_frame.pack(expand=True, anchor=tk.CENTER, padx=20, pady=20)

        # Header - centered
        header_label = tk.Label(
            main_frame,
            text="PCB Defect Inspection",
            font=self.header_font,
            fg=self.text_color,
            bg=self.bg_color
        )
        header_label.pack(pady=(0, 30))

        # Button frame - centered
        button_frame = tk.Frame(main_frame, bg=self.bg_color)
        button_frame.pack(pady=20)

        # Select image button
        self.select_btn = tk.Button(
            button_frame,
            text="Select Image",
            command=self.select_image,
            font=self.button_font,
            bg=self.accent_color,
            fg=self.text_color,
            activebackground="#00A69A",
            activeforeground=self.text_color,
            bd=0,
            relief=tk.FLAT,
            padx=30,
            pady=15
        )
        self.select_btn.pack(side=tk.LEFT, padx=15)
        self.select_btn.bind("<Enter>", lambda e: self.select_btn.config(bg="#00A69A"))
        self.select_btn.bind("<Leave>", lambda e: self.select_btn.config(bg=self.accent_color))

        # Process button
        self.process_btn = tk.Button(
            button_frame,
            text="Process Image",
            command=self.process_image,
            font=self.button_font,
            bg=self.accent_color,
            fg=self.text_color,
            activebackground="#00A69A",
            activeforeground=self.text_color,
            bd=0,
            relief=tk.FLAT,
            padx=30,
            pady=15,
            state=tk.DISABLED
        )
        self.process_btn.pack(side=tk.LEFT, padx=15)
        self.process_btn.bind("<Enter>", lambda e: self.process_btn.config(bg="#00A69A"))
        self.process_btn.bind("<Leave>", lambda e: self.process_btn.config(bg=self.accent_color))

        # File label - centered
        self.file_label = tk.Label(
            main_frame,
            text="No file selected",
            font=("Segoe UI", base_font_size - 1, "italic"),
            fg="#B0BEC5",
            bg=self.bg_color
        )
        self.file_label.pack(pady=15)

        # Status frame - centred
        status_frame = tk.Frame(
            main_frame,
            bg=self.frame_color,
            bd=2,
            relief=tk.RAISED,
            padx=20,
            pady=15
        )
        status_frame.pack(pady=20)

        # Inspection result label centred
        self.inspection_label = tk.Label(
            status_frame,
            text="Inspection Status: Not processed",
            font=("Segoe UI", base_font_size + 1, "bold"),
            fg=self.secondary_color,
            bg=self.frame_color
        )
        self.inspection_label.pack(pady=8)

        # Defect analysis label centred
        self.analysis_label = tk.Label(
            status_frame,
            text="Defect Analysis: Waiting for processing",
            font=self.label_font,
            fg=self.text_color,
            bg=self.frame_color
        )
        self.analysis_label.pack(pady=8)

        # Image frame centred
        self.images_frame = tk.Frame(main_frame, bg=self.bg_color)
        self.images_frame.pack(pady=20)

        # Processed image frame - centered
        self.processed_frame = tk.Frame(
            self.images_frame,
            bg=self.frame_color,
            bd=3,
            relief=tk.SOLID
        )
        self.processed_frame.pack()

        # Processed image label centred
        self.processed_label = tk.Label(
            self.processed_frame,
            text="Processed image with detections will appear here",
            font=self.label_font,
            fg="#B0BEC5",
            bg=self.frame_color,
            padx=50,
            pady=50
        )
        self.processed_label.pack()

        # Results text area frame centred
        text_outer_frame = tk.Frame(main_frame, bg=self.bg_color)
        text_outer_frame.pack(pady=20)

        text_frame = tk.Frame(text_outer_frame, bg=self.bg_color)
        text_frame.pack()

        # Calculate text area size based on screen
        text_width = min(100, max(60, int(screen_width / 15)))
        text_height = min(15, max(10, int(screen_height / 60)))

        self.result_text = tk.Text(
            text_frame,
            height=text_height,
            width=text_width,
            font=self.text_font,
            bg=self.frame_color,
            fg=self.text_color,
            insertbackground=self.text_color,
            relief=tk.FLAT,
            wrap=tk.WORD
        )
        scrollbar = tk.Scrollbar(
            text_frame,
            orient=tk.VERTICAL,
            command=self.result_text.yview,
            bg=self.bg_color,
            troughcolor=self.frame_color,
            highlightthickness=0
        )
        self.result_text.config(yscrollcommand=scrollbar.set)
        self.result_text.pack(side=tk.LEFT)
        scrollbar.pack(side=tk.RIGHT, fill=tk.Y)

        self.selected_image_path = None

        # Bind mousewheel to canvas
        main_canvas.bind_all("<MouseWheel>", lambda e: main_canvas.yview_scroll(int(-1*(e.delta/120)), "units"))
Explanation:
- We initialize a Tkinter window with responsive dimensions (80% of screen width/height, capped at 1200x900) and centre it on the screen using winfo_screenwidth and winfo_screenheight.
- We define responsive font sizes based on screen width (base size 10–16) for Segoe UI fonts (header, label, button, text) and use the same colour scheme (dark navy #1E2A44, teal #00C4B4, coral #FF6F61, light gray #B0BEC5).
- We create a scrollable canvas with a vertical scrollbar, using a scrollable_frame and a centred container_frame to hold all widgets.
- We set up widgets:
- Header: “PCB Defect Inspection” in bold Segoe UI, centred with padding.
- Buttons: “Select Image” and “Process Image” in teal, centred side-by-side with larger padding (padx=30, pady=15) and hover effects (darken to #00A69A).
- File Label: Displays the selected image’s filename, centred in italic Segoe UI.
- Status Frame: Shows inspection results and defect summaries in a card-like frame (relief=RAISED), centred.
- Image Frame: Displays the label_visualization image in a card-like frame (relief=SOLID), centred.
- Text Area: Shows detailed results with a scrollbar, sized responsively (width 60–100, height 10–15), centred.
- We ensure all elements are centred using pack(expand=True, anchor=tk.CENTER) for a modern, balanced look, with scrolling support via mouse wheel or scrollbar.
Code Section 3: GUI Methods for Image Selection and Processing
Next, we will define methods to handle user interactions and display workflow outputs.
 def select_image(self):
        file_path = filedialog.askopenfilename(
            title="Select PCB Image",
            filetypes=[("Image files", "*.jpg *.jpeg *.png *.bmp *.tiff"), ("All files", "*.*")]
        )
        if file_path:
            self.selected_image_path = file_path
            self.file_label.config(text=f"Selected: {file_path.split('/')[-1]}")
            self.process_btn.config(state=tk.NORMAL)

    def process_image(self):
        if not self.selected_image_path:
            messagebox.showerror("Error", "Please select an image first")
            return

        self.process_btn.config(text="Processing...", state=tk.DISABLED)
        self.root.update()
        self.result_text.delete(1.0, tk.END)
        self.result_text.insert(tk.END, "Processing image...\n")

        result = process_image(self.selected_image_path)

        # Update status labels
        self.inspection_label.config(text=f"Inspection Status: {result['inspection_result']}")
        if result['predictions']:
            self.analysis_label.config(text=f"Total: {len(result['predictions'])} defects | Primary Type: {result['majority_class']}")
        else:
            self.analysis_label.config(text="No defects detected")

        # Display results
        self.result_text.delete(1.0, tk.END)
        self.result_text.insert(tk.END, "=== INSPECTION RESULT ===\n")
        self.result_text.insert(tk.END, f"Status: {result['inspection_result']}\n\n")

        self.result_text.insert(tk.END, "=== DEFECT ANALYSIS ===\n")
        if result['predictions']:
            self.result_text.insert(tk.END, f"Total Detections: {len(result['predictions'])}\n")
            self.result_text.insert(tk.END, f"Primary Defect Type: {result['majority_class']}\n\n")
            self.result_text.insert(tk.END, "Class Distribution:\n")
            for class_name, count in result['class_counts'].items():
                percentage = (count / len(result['predictions'])) * 100
                self.result_text.insert(tk.END, f"  • {class_name}: {count} ({percentage:.1f}%)\n")
            self.result_text.insert(tk.END, "\n")
        else:
            self.result_text.insert(tk.END, "No defects detected\n\n")

        # Display visualization image
        if result['vis_img']:
            # Responsive image sizing based on screen
            screen_width = self.root.winfo_screenwidth()
            max_width = min(1200, int(screen_width * 0.6))
            max_height = min(800, int(screen_width * 0.4))

            vis_display = result['vis_img'].copy()
            vis_display.thumbnail((max_width, max_height), Image.Resampling.LANCZOS)
            vis_photo = ImageTk.PhotoImage(vis_display)
            self.processed_label.config(image=vis_photo, text="")
            self.processed_label.image = vis_photo
            self.result_text.insert(tk.END, "✓ Visualization image loaded\n")
            self.result_text.insert(tk.END, "✓ Saved as 'visualization_output.png'\n")
        else:
            self.processed_label.config(image="", text="No visualization image available")
            self.result_text.insert(tk.END, "✗ No visualization image available\n")

        # Display detailed predictions
        self.result_text.insert(tk.END, "\n=== DETAILED DETECTIONS ===\n")
        if result['predictions']:
            for i, pred in enumerate(result['predictions'], 1):
                self.result_text.insert(tk.END, f"Detection {i}:\n")
                self.result_text.insert(tk.END, f"  Type: {pred.get('class', 'Unknown')}\n")
                self.result_text.insert(tk.END, f"  Confidence: {pred.get('confidence', 0):.1%}\n")
                self.result_text.insert(tk.END, f"  Position: ({pred.get('x', 0):.0f}, {pred.get('y', 0):.0f})\n")
                self.result_text.insert(tk.END, f"  Size: {pred.get('width', 0):.0f} × {pred.get('height', 0):.0f} px\n")
                self.result_text.insert(tk.END, "-" * 40 + "\n")
        else:
            self.result_text.insert(tk.END, "No detections found\n")

        self.result_text.see(tk.END)
        self.process_btn.config(text="Process Image", state=tk.NORMAL)
Explanation:
- We define select_image to open a file dialogue for choosing a PCB image (.jpg, .png, etc.), update the file label with the filename, and enable the “Process Image” button.
- We implement process_image to:
- Check if an image is selected; if not, show an error message.
- Call process_image to retrieve workflow outputs.
- Update the GUI:
- Status Frame: Display inspection_result_json_output (e.g., “guaranteed fail”) and a summary (total defects, majority class like “spurious_copper”).
- Text Area: Show inspection_result_json_output, defect counts, class distribution (e.g., “spurious_copper: 4 (100.0%)”), and detailed predictions (class, confidence, position, size).
- Image Frame: Display the label_visualization image with bounding boxes, resized responsively (60% of screen width, max 1200x800). If unavailable, show “No visualization image available.”
- Add success/failure messages for image loading and saving to the text area.
- Reset the “Process Image” button after completion.
- We ensure the code only formats and displays the workflow’s outputs, with majority_class and class_counts computed locally for summary display.
Code Section 4: Main Execution
Finally, we run the application with the main function.
def main():
    root = tk.Tk()
    app = PCBInspectionGUI(root)
    root.mainloop()


if __name__ == "__main__":
    main()
Explanation:
- We create a Tkinter root window and initialize the PCBInspectionGUI class.
- We start the Tkinter event loop to run the GUI, enabling user interactions (selecting images, processing, and scrolling).
Why Is This Useful?
We built this system to automate PCB quality control, identifying critical defects (e.g., open circuits) for immediate rejection and flagging less severe issues (e.g., spurious copper) for human review. This reduces manual inspection time, minimizes errors, and ensures reliable PCBs for electronics manufacturing. Our modern Tkinter GUI, with its centered layout, teal buttons, and scrollable interface, makes it easy for operators to interpret results, enhancing usability in production environments.
Build Your Own PCB Defect Inspection System
Ready to build your own? Start by sourcing a PCB defect detection model from Roboflow Universe or by collecting your images. You can annotate and train the model, create a workflow with the expression block, and use the provided Python code to build a sleek GUI. The code is available on GitHub.
Have fun building and ensuring quality!
Written by Aarnav Shah
Cite this Post
Use the following entry to cite this post in your research:
Contributing Writer. (Aug 4, 2025). Real-Time PCB Defect Detection with Computer Vision. Roboflow Blog: https://blog.roboflow.com/pcb-defect-detection/