
A few weeks ago, I had an argument with a roommate over a popular Guinness drinking trend called Split the G. The argument was over whose split was better. After a few moments of back and forth, I had a realization. This was the perfect task for an AI application that could analyze a pint and create a leaderboard of the best splits.
https://splittheg.dev was born!
In this blog we'll cover what it takes to create an AI that measures a Split the G pint and build a website like this to let your friends join in on the fun.
What is Split the G?
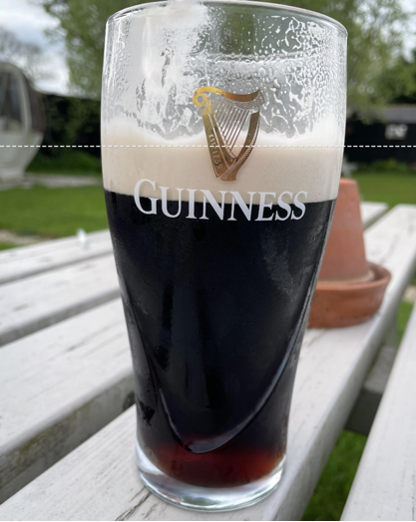
Split the G became popular as a social media trend and pub game, gaining traction in recent years. The trend involves drinking enough Guinness on the first sip (honestly it’s a massive gulp) to make the line between liquid and foam land halfway through the G on the glass. But how can we accomplish judging what splits are the best?
How we score a split
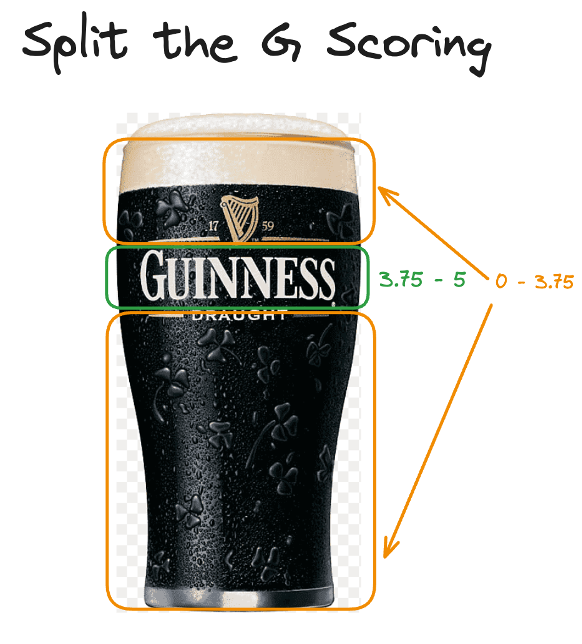
Prior to building the app, it was important that we agreed on how to score the splits. We settled on a score that would be from 0.00 - 5.00 with the highest score indicating the perfect split G.
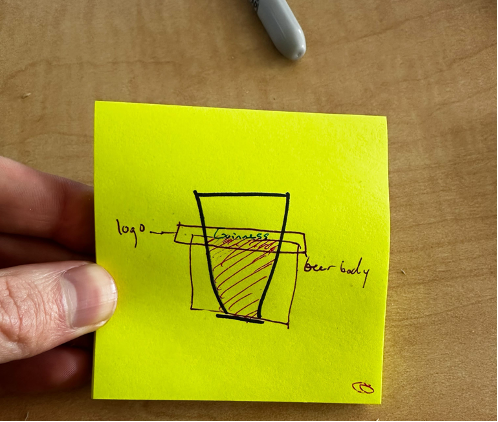
Originally when debating how we should score the split we thought the best approach would be to detect the beer line and logo with an object detection model, and determine how close the top of the bounding box was to the center of the logo.
In practice though, we quickly ran into an interesting physical phenomenon in fluid mechanics called the meniscus. With Guinness, surface tension between the liquid and the solid surface causes a convex meniscus. Similar to water, this is observed as an upward curving liquid level. In practice, this had a negative effect on scoring as displayed in the below image.
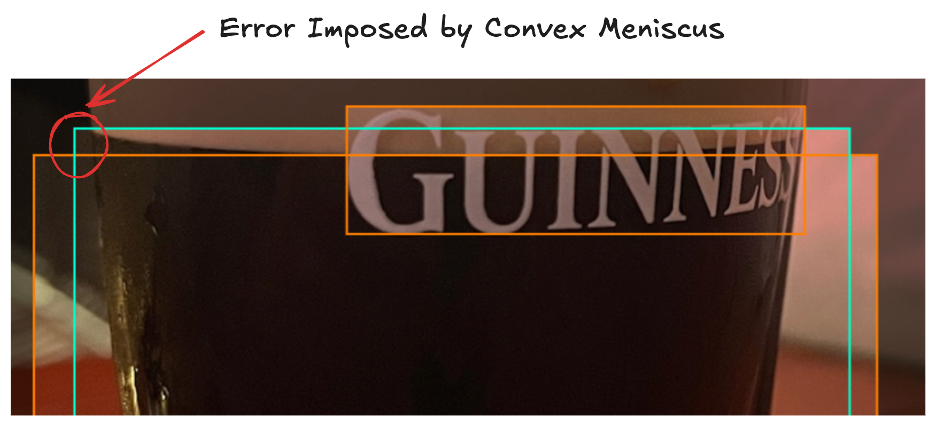
With object detection, the beer level is detected at the peaks of the meniscus as seen by the green line. This, compared with the level of the liquid present intersecting the G, imposed a noticeable variation. We take our Guinness scoring very seriously, so we needed a new game plan.
We decided to take a two stage approach. First, we would detect the G, and see if we could measure the split based on seeing beer level inside of the G. This would allow us to get more accurate on true splits giving scores between 3.75 - 5.00.
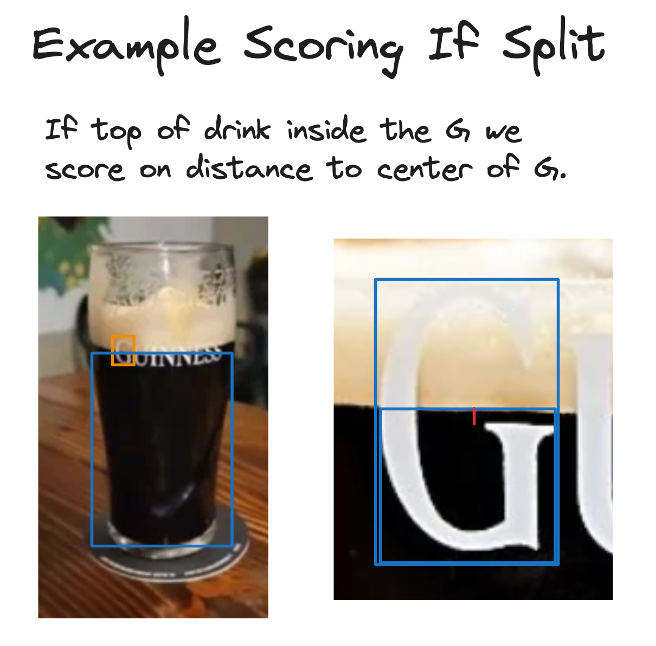
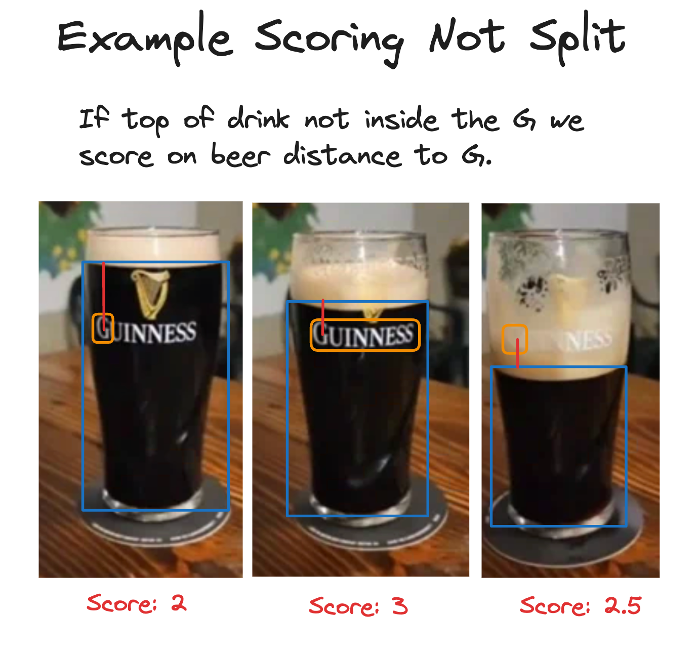
For pints where the G wasn’t split, we’d utilize the distance of the beer level with meniscus and give a score ranging 0.00 - 3.75.
With the scoring methodology set, we started building AI models.
Building the models
To achieve the desired output from our models and minimize the impact of the meniscus effect, we needed to build two separate models.
The first model was designed to detect beer, Guinness glasses, and the iconic “G” logo. To gather data, we scoured the internet for images of Guinness glasses, ultimately compiling a dataset of 56 images.
After training our initial model, we achieved performance metrics of 93.9% mAP, 80.1% precision, and 73.5% recall.
The second model required a more fine-tuned approach to improve accuracy in cases where the "G" logo appeared split. For this, we needed a new dataset consisting solely of “G” logo images.
Instead of manually cropping each image, we decided to isolate Gs from the data we already had and created a new object detection project.
Although this dataset contained the same number of images as the first, it required relabeling for precise fill level detection. We labeled the images with the top of the bounding box aligned to the beer's fill level, ensuring more accurate scoring. Training this model yielded good results: 99.5% mAP, 99.4% precision, and 100% recall.
These models provided a starting point for our web app.
Building the Workflows
With our initial models in place, the next step was to develop a workflow that would serve as our scoring system.
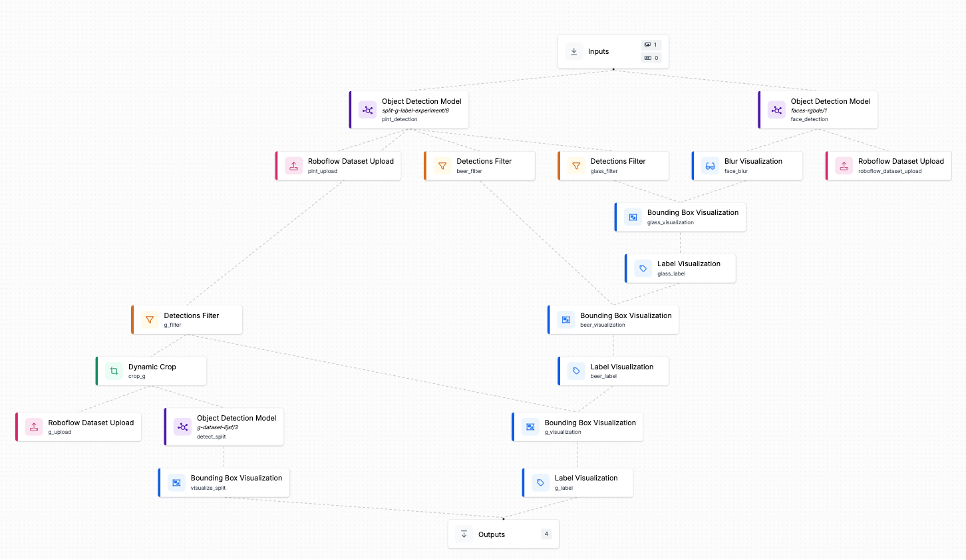
Our workflow is designed to generate all the necessary outputs, including visual representations of detections from both models and detection coordinates for scoring.
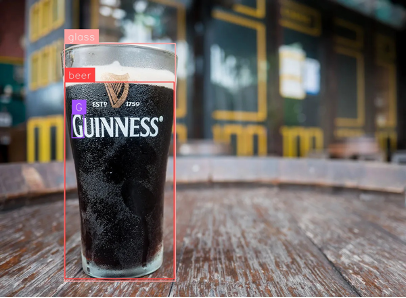
When the workflow is triggered, the image is passed through two separate models. The first is a face detection model that we use to blur out any faces captured in an image. The second is our main object detection model, which detects glasses, the G logo, and beer in the glass.
Visualizations are applied to display the detections and blur faces. This is the first of the two images displayed when a score is given in the app.
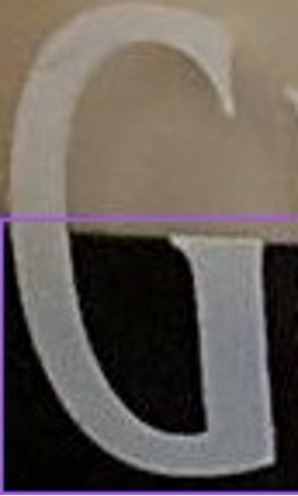
Next, the workflow focuses on extracting the G for further analysis by our second-stage model. We filter out all other detections and pass the remaining G detection through a dynamic crop block. This cropped image, now focused only on the G, is processed by the second-stage model, which identifies the intersection between the beer's fill level and the logo.
The resulting predictions are then used to calculate an accurate score, and the annotated images are sent to the client for display.
Application architecture
Now that we have the models and some custom logic available as an API endpoint, it’s time to build the web app. For building the app we used a few tools:
- React Router as the javascript framework
- TailwindCSS for styling
- Supabase for our database and s3 storage
- Roboflow InferenceJS for running models in the browser
- Roboflow Workflows API for our computer vision API
We won't walk through every detail on setting these tools up, but we will bring up some of the interesting items that were incorporated into this project. If interested in the full implementation, feel free to check out the full codebase which is available on github.
Image capture with Inferencejs in the browser
To create an easy user experience, we wanted the app to automatically capture the perfect image rather than requiring manual photo capture. Using Roboflow's InferenceJS package, we run object detection directly in the browser on the camera feed, waiting until we detect both a Guinness glass and the G logo.
First, we initialize InferenceJS and load our model:
// Initialize InferenceJS engine
useEffect(() => {
  async function initInference() {
    const { InferenceEngine } = await import('inferencejs');
    setInferEngine(new InferenceEngine());
  }

  initInference();
}, []);

// Load the model
useEffect(() => {
  if (!inferEngine || modelLoading) return;

  setModelLoading(true);
  inferEngine
    .startWorker("MODEL_ID", "MODEL_VERSION", "YOUR_PUBLIC_API_KEY")
    .then((id) => setModelWorkerId(id));
}, [inferEngine]);
Then, we set up a real-time detection on each camera frame:
const detectFrame = async () => {
  const { CVImage } = await import('inferencejs');
  const img = new CVImage(videoRef.current);
  const predictions = await inferEngine.infer(modelWorkerId, img);

  // Check if we can see both the glass and G logo
  const hasGlass = predictions.some(pred => pred.class === "glass");
  const hasG = predictions.some(pred => pred.class === "G");

  if (hasGlass && hasG) {
    setConsecutiveDetections(prev => prev + 1);
    setFeedbackMessage("Keep the glass centered...");
  } else {
    setConsecutiveDetections(0);
    setFeedbackMessage("Make sure both glass and G are visible");
  }
};
Finally, we capture the image only after several consecutive successful detections:
if (consecutiveDetections >= 6) {
  setFeedbackMessage("Perfect! Processing your pour...");

  // Capture the frame
  const canvas = canvasRef.current;
  const imageData = canvas.toDataURL('image/jpeg');
  const base64Image = imageData.replace(/^data:image\/\w+;base64,/, '');

  // Submit for processing
  const formData = new FormData();
  formData.append('image', base64Image);
  submit(formData, { method: 'post' });
}
Running inference with Roboflow Workflows API
Once we have the image captured, we utilize the Roboflow Workflows API through our action function on the route.
export async function action({ request }: ActionFunctionArgs) {
  const formData = await request.formData();
  const base64Image = formData.get('image') as string;

  // Call the Roboflow Workflows API
  const response = await fetch('https://detect.roboflow.com/infer/workflows/hunter-diminick/split-g-scoring', {
    method: 'POST',
    headers: {
      'Content-Type': 'application/json'
    },
    body: JSON.stringify({
      api_key: process.env.ROBOFLOW_API_KEY,
      inputs: {
        "image": {"type": "base64", "value": base64Image}
      }
    })
  });

  const result = await response.json();

  // Extract the annotated images from the workflow response
  const splitImage = result.outputs[0]['split image'][0].value;
  const pintImage = result.outputs[0]['pint image'].value;

  // Calculate score and store results
  const splitScore = calculateScore(result.outputs[0]);

  // ... rest of processing
}
This Workflow was built to return an annotated crop of our split G, an annotated image of our pint, as well as the results from both of the models for our scoring algorithm.
Along with this, we built an active learning step into the pipeline that allows us to collect additional data from the app which we can then use to make the models better for more accurate scoring over time.
The scoring algorithm
Once we have the results back from our Workflow API, it's time to use the detections to properly score the split G. The scoring logic is split into two main scenarios. First, we check if there's a detected split in the G. When a split is detected, the score ranges from 3.75 to 5.00 points, with the highest score achieved when the split is perfectly centered in the G.
function calculateSplitScore(splitResults: any): number {
  // Check if we have valid predictions
  if (!splitResults?.predictions?.predictions?.[0]) {
    return 0;
  }

  const split = splitResults.predictions.predictions[0];
  const imgDims = splitResults.predictions.image;

  // Normalize coordinates to 0-1 range
  const normalizedSplit = normalizeCoordinates(split, imgDims);

  // Calculate distance from center (0.5 is the center point)
  const splitTopY = normalizedSplit.y - (normalizedSplit.height / 2);
  const distanceFromCenter = Math.abs(splitTopY - 0.5);

  // Convert to score (5.0 at center, 3.75 at edges)
  const normalizedDistance = Math.min(distanceFromCenter / 0.5, 1);
  return 3.75 + (1.25 * (1 - normalizedDistance));
}
If no split is detected, we fall back to scoring based on how close the beer level is to the center of the G. This score ranges from 0.00 to 3.75 points and uses a quadratic decay function to more aggressively penalize beer levels that are far from the G's center.
function calculateNonSplitScore(pintResults: any): number {
  const predictions = pintResults?.predictions?.predictions || [];
  const imgDims = pintResults?.predictions?.image;

  // Find beer and G detections
  const beer = predictions.find(p => p.class === 'beer');
  const g = predictions.find(p => p.class === 'G');

  if (!beer || !g) return 0;

  // Calculate distance between beer top and G center
  const normalizedBeer = normalizeCoordinates(beer, imgDims);
  const normalizedG = normalizeCoordinates(g, imgDims);
  const beerTopY = normalizedBeer.y - (normalizedBeer.height / 2);
  const gCenterY = normalizedG.y;

  // Apply quadratic decay for more aggressive scoring
  const distanceFromCenter = Math.abs(beerTopY - gCenterY);
  const maxDistance = 0.5;
  const normalizedDistance = Math.min(distanceFromCenter / maxDistance, 1);
  const decayFactor = Math.pow(1 - normalizedDistance, 2);

  return 3.75 * decayFactor;
}
The final score is determined by first checking for a split, and if none is found, falling back to the beer level scoring.
export function calculateScore(results: any): number {
  const splitScore = calculateSplitScore(results["split results"][0]);
  if (splitScore > 0) {
    return splitScore;
  }
  return calculateNonSplitScore(results["pint results"]);
}
Leaderboard and sharing
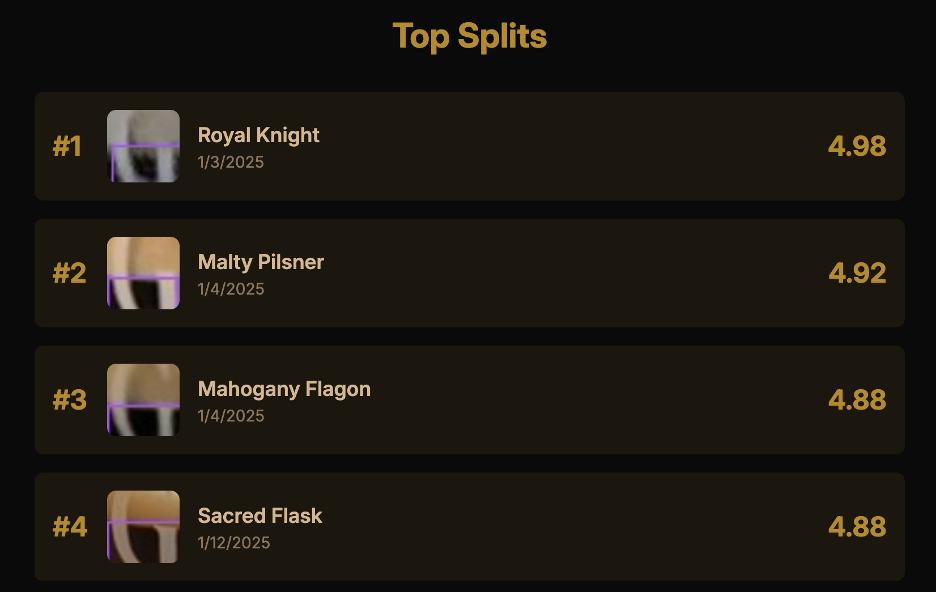
Now that we’ve got our scoring and our annotated images, the last step to wrap up our application is to incorporate some state for a leaderboard and enable easy sharing of results. For the database and image storage we used Supabase. Their awesome CLI and easy to use javascript client allow you to get the entire stack running locally as well which was a huge plus. The leaderboard provides a competitive element to our Split the G application by showing the top 15 splits. We use the Supabase client to query our scores table, ordering by the highest split scores.
const { data: entries } = await supabase
  .from('scores')
  .select(`
    id,
    username,
    split_score,
    created_at,
    split_image_url
  `)
  .order('split_score', { ascending: false })
  .limit(15);
Each leaderboard entry is clickable and links to the individual score page, showing the rank position, username (randomly generated), split score, date of the split, and a thumbnail of the G.
When viewing an individual score, we show the user's rank among all attempts:
// Get the user's rank by counting scores higher than or equal to their score
const { count: rank } = await supabase
  .from('scores')
  .select('*', { count: 'exact', head: true })
  .gte('split_score', score.split_score);

// Get total number of attempts for percentile context
const { count: totalSplits } = await supabase
  .from('scores')
  .select('*', { count: 'exact', head: true });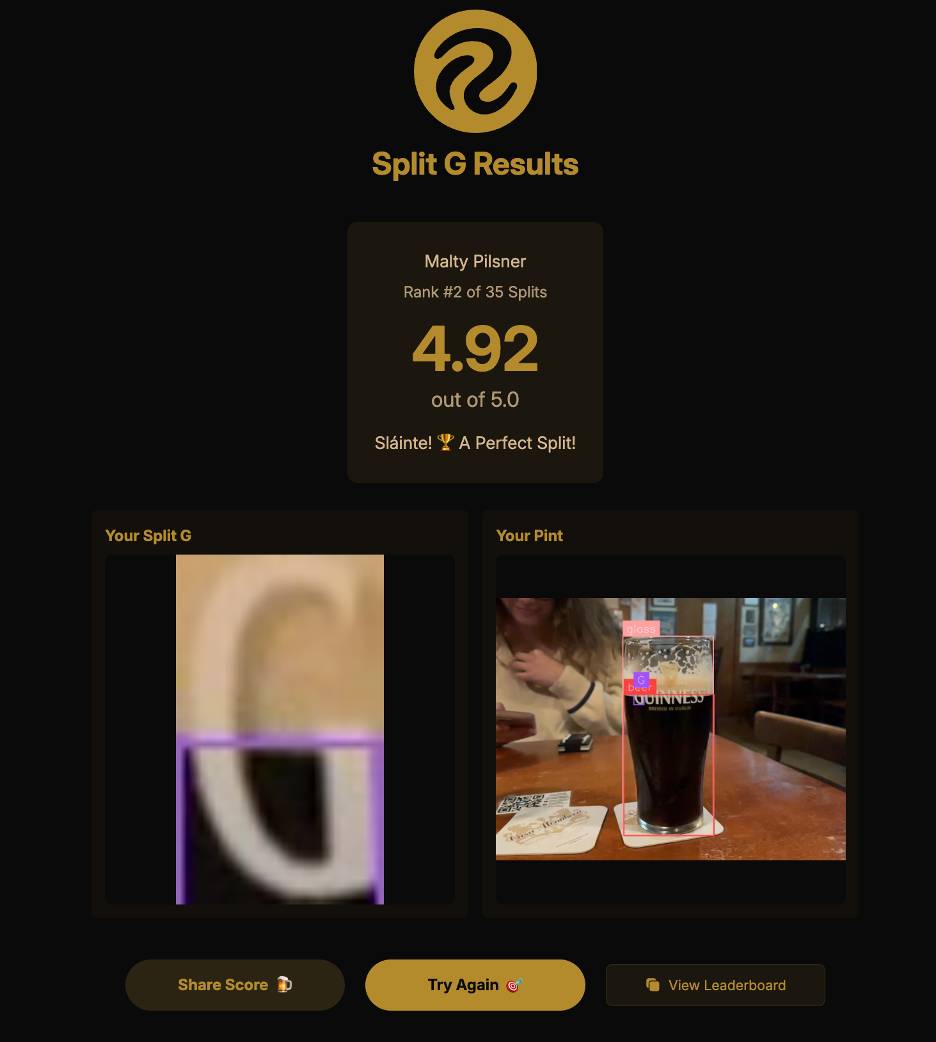
Try it out
We enjoyed building this app and hope you enjoy using it. We are open to contributions in the repo if you have ideas on how to make it better! Cheers 🍻.
Cite this Post
Use the following entry to cite this post in your research:
Nick Herrig, Hunter Diminick. (Feb 5, 2025). Using AI to Score Split the G. Roboflow Blog: https://blog.roboflow.com/split-the-g-app/