
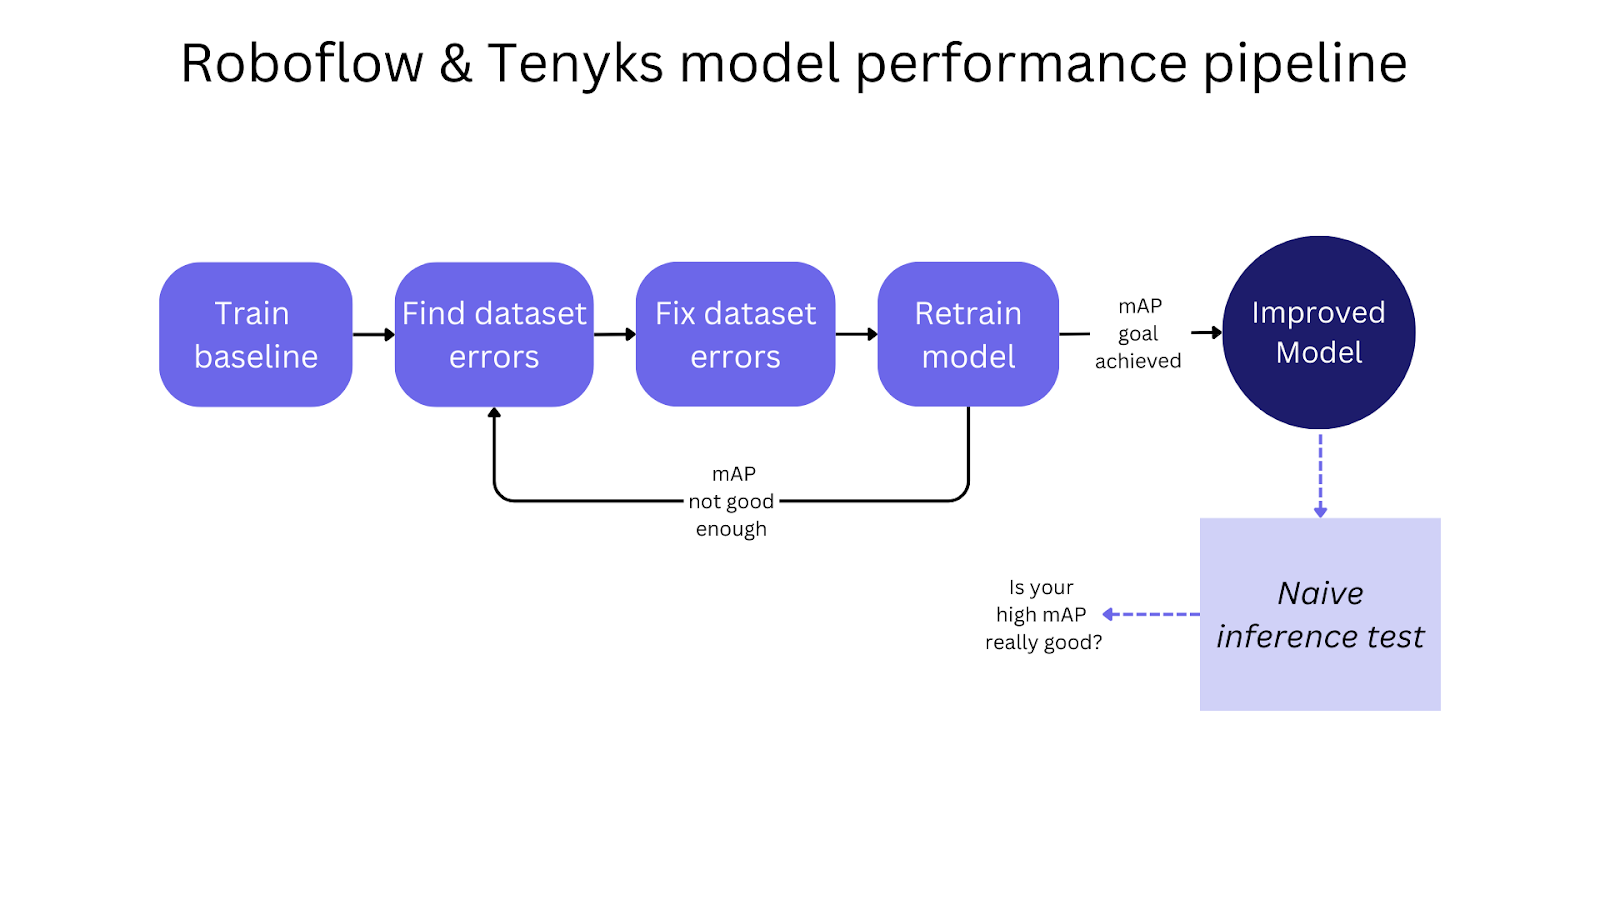
A collaboration between Roboflow and Tenyks showing that model performance gains often come from fixing data, not tuning architecture. Using a traffic sign detection model as the test scenario, the workflow covers training a baseline, auditing the Roboflow dataset with Tenyks to surface label errors and class imbalances, correcting them in Roboflow Annotate, and retraining to lift overall mAP from 94% to 97.6% and weak classes from 60% to 77% mAP.
This is a guest post with Jose Gabriel Islas Montero (ML Engineer and Evangelist at Tenyks), and Dmitry Kazhdan (CTO & Co-Founder at Tenyks)
Introduction
When improving an object detection model, many engineers focus solely on tweaking the model architecture and hyperparameters. However, the root cause of mediocre performance often lies in the data itself.
In this collaborative post between Roboflow & Tenyks, we’ll show you how a machine learning engineer tasked with improving model performance can accomplish this goal by systematically identifying and fixing dataset issues.
In this post, you’ll learn the step-by-step process you can follow to thoroughly use Tenyks to audit and enhance your Roboflow dataset, ultimately leading to a boost in performance. By the end of this tutorial, you'll see how model performance increased from 94% mAP to 97.6% mAP, and specific classes from 60% mAP to 77% mAP.
Project Steps
- The Scenario: You are Tasked with Improving Model Performance
- Training a Baseline: High mAP Doesn’t Always Mean Your Model is Good
- Zooming In: Performance is Lacking in Some Classes
- Finding Dataset Issues
- Fixing Issues to Improve Dataset Quality
- Obtaining Higher Model Performance with the Fixed Dataset
Let's get started!
The Scenario: You are Tasked with Improving Model Performance
Assume you are a machine learning engineer who recently joined a startup building self-driving car technology. Say you are assigned an object detection model that identifies traffic signs in camera footage. However, your team is dissatisfied with the current model’s accuracy, which is too low to reliably detect objects in diverse real-world conditions.
During evaluation, you find the model performance for some classes is below the minimum accuracy needed for safe autonomous navigation. The model frequently fails to detect small, or unusual objects. It is also inconsistent across different locations.
Your first task is boosting the object detector’s performance to meet the threshold goal. You have heard many times the gospel that “a model is only as strong as its training data”, right? Imagine you embark to rigorously audit the dataset to identify opportunities for improvement.
Ok, where do you begin? 😵
Training a Baseline: High mAP Doesn’t Always Mean Your Model is Good
For this tutorial, we will use a road traffic object detection dataset, see Figure 1. This Roboflow dataset contains more than 2,500 annotated images across 12 common sign types including speed limit, yield, and pedestrian warnings. The dataset is split into 2,200 train images, 260 validation images, and 260 test images.
0:00/1×Figure 1. The Road Traffic object dataset used in this article
We trained a baseline model on our object detection dataset using Roboflow. For this task, we utilized Roboflow Train (Figure 2), which offers an automated approach to training state-of-the-art computer vision models. We employed one of our three available free credits to train the model with just a few clicks.
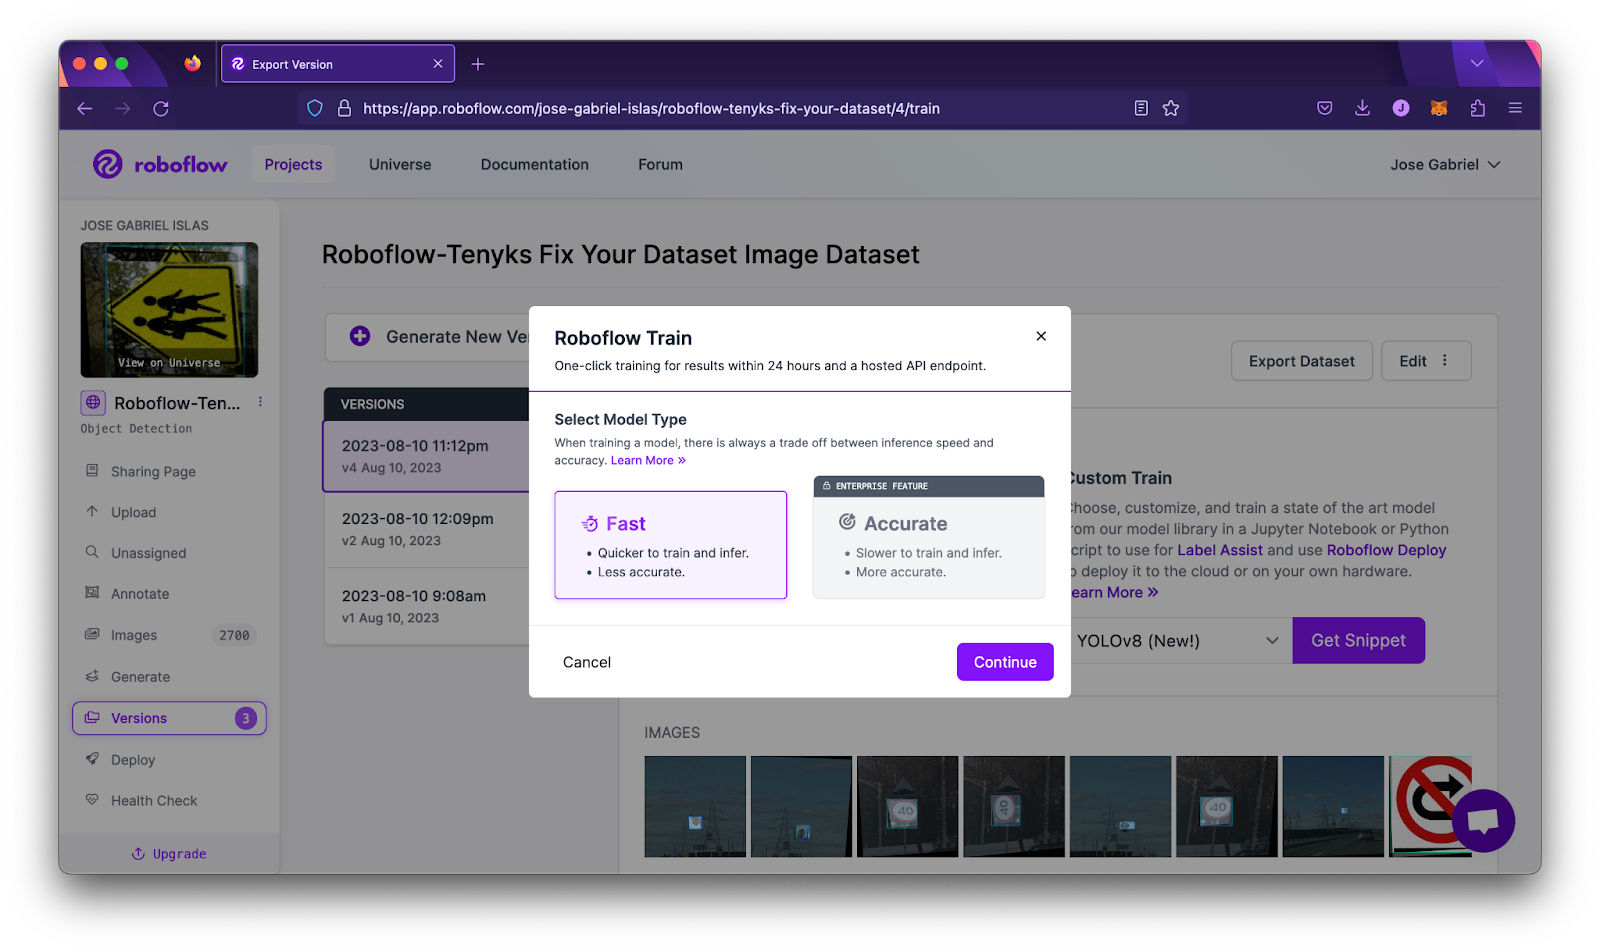
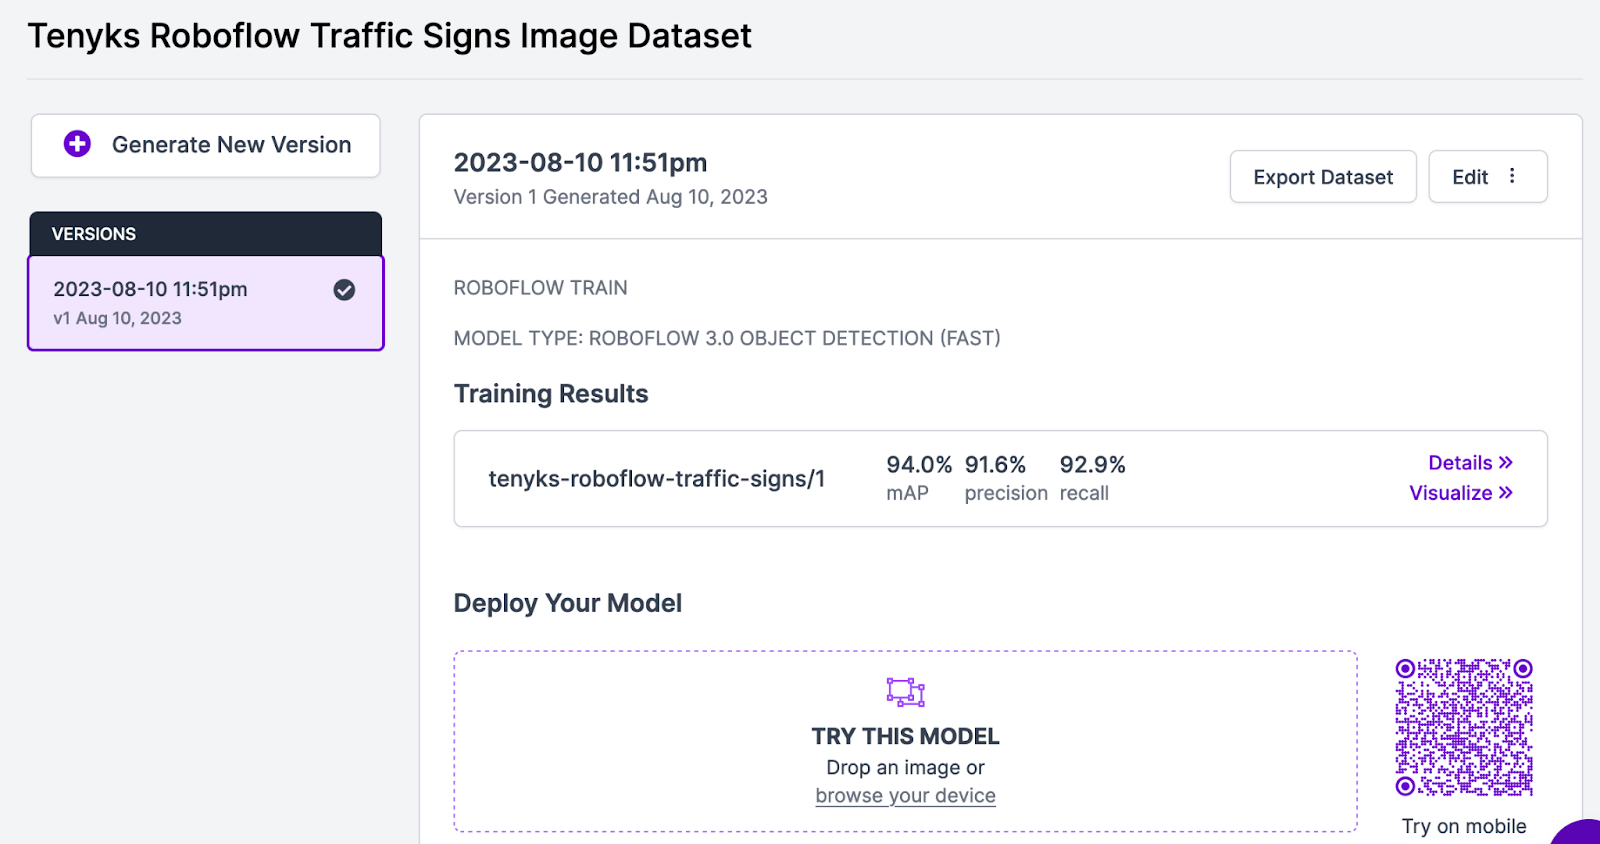
The baseline model achieved an overall 94.0% mean average precision (mAP) as shown in Figure 3.
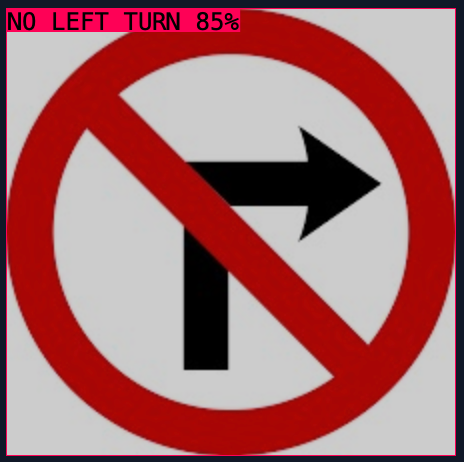
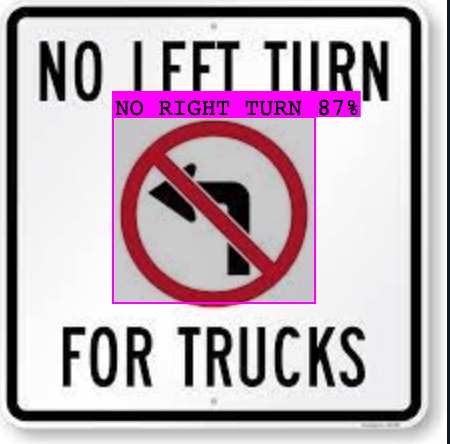
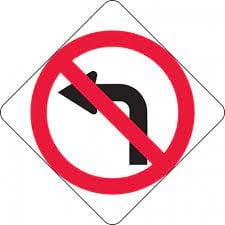
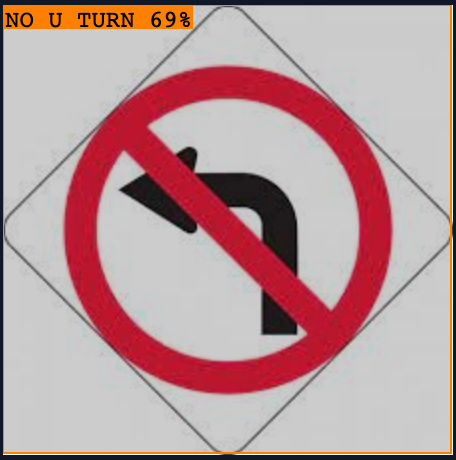
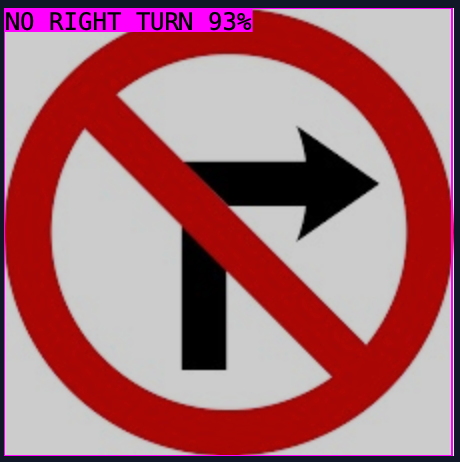
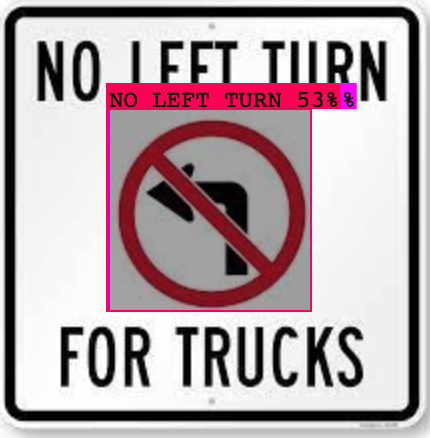
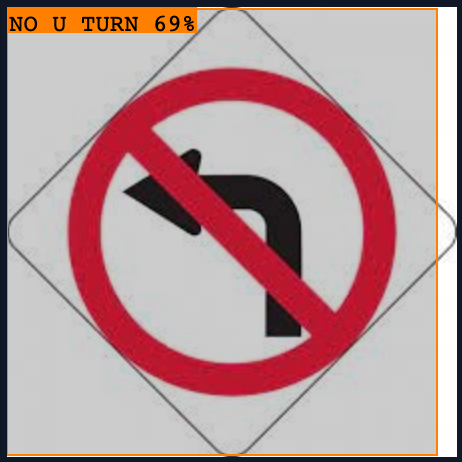
Don’t trust, verify: a high mAP doesn’t always mean your model is reliable. We conduct a simple yet practical test to verify our model’s reliability: the following figure shows how our trained model –with a considerably high mAP (i.e. 94%)– is embarrassingly failing to detect a number of samples taken randomly from Google Search:
- A ‘No Right Turn’ example is predicted as ‘No Left Turn’
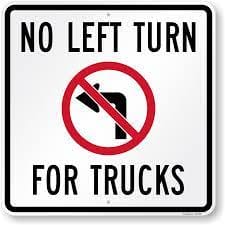
- A ‘No Left Turn’ example is predicted as ‘No Right Turn’
- A ‘No Left Turn’ example is predicted as ‘No U Turn’
0:00/1×Figure 4. Verifying our model is as good as it’s supposed to be
We can see on Table 1 what our model is predicting for the previous examples. Why is the model confidently predicting the wrong labels? The rest of this article will attempt to answer this question.

Zooming In: Performance is Lacking in Some Classes
Part of the answer to the above question is reflected in the test set: while some classes achieved a very high mAP, other classes such as ‘No Left Turn’ (60% mAP) and ‘No Right Turn’ (70% mAP) did not perform as well, see Figure 5.
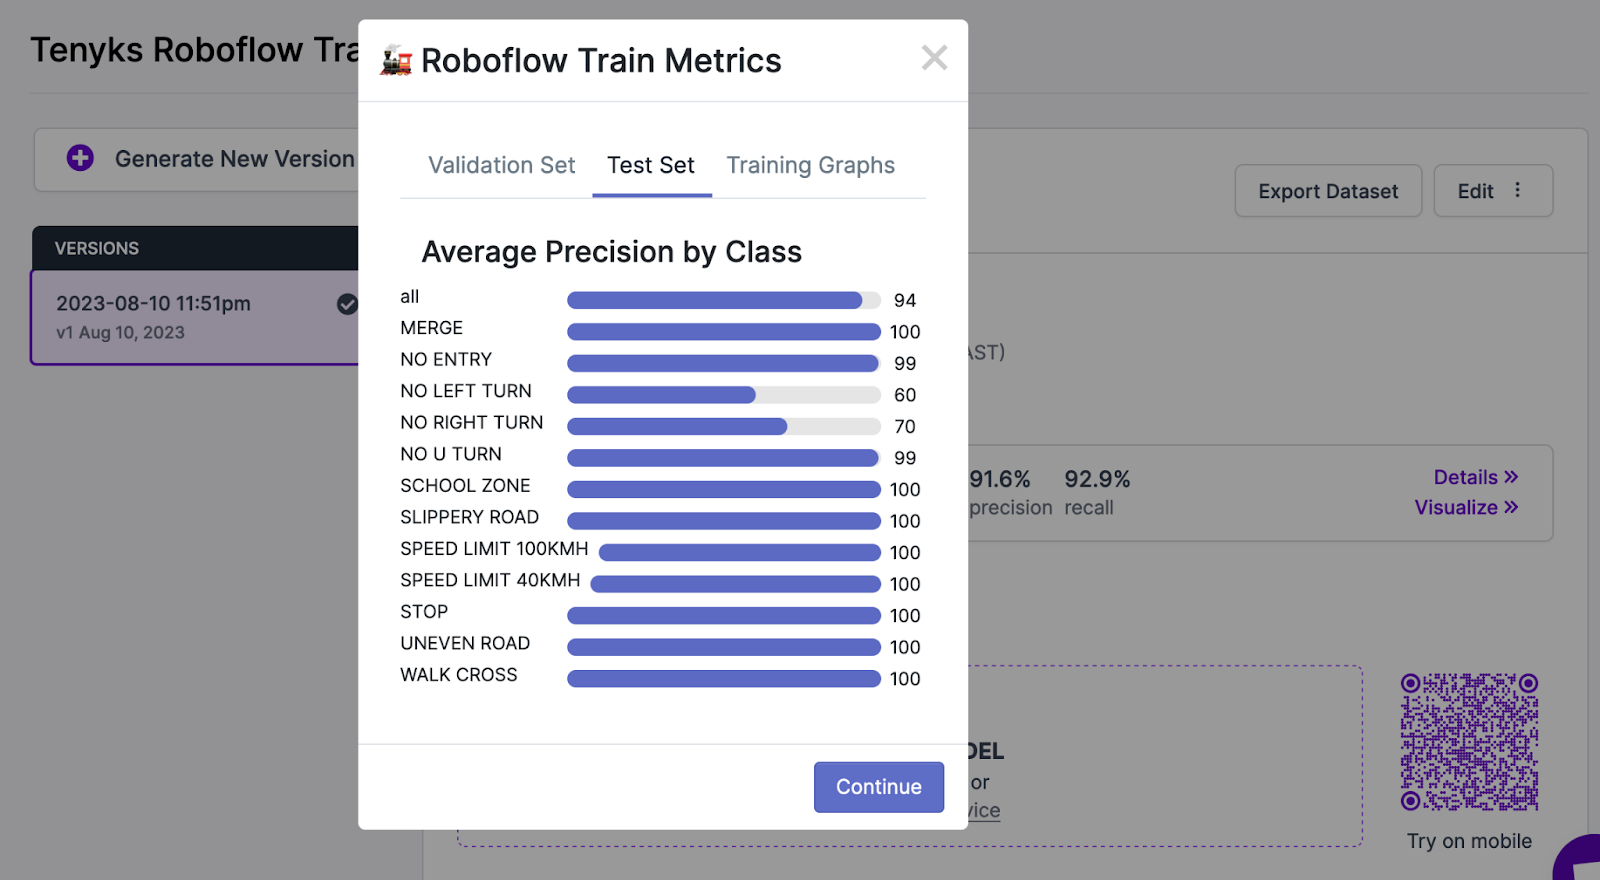
However, to truly find the root cause of the unreliable high performance of the model we need to examine the data.
Finding Dataset Issues
After creating a sandbox account (https://sandbox.tenyks.ai) in the Tenyks platform, you will find the dataset of this article pre-uploaded.
If you wish to upload and fix your own dataset, here you can find detailed documentation on how to set up your first dataset in the Tenyks platform.
Once in the Tenyks platform, we can promptly verify the outcome of evaluating the trained model on the test set. In Figure 6, the Model Comparison feature provides a breakdown of mAP for each class. As expected, two main classes stand out due to its low performance: ‘No Left Turn’ and ‘No Right Turn’.
0:00/1×Figure 6. Test set model performance using the Model Comparison feature in the Tenyks platform
What if your safety team requires a specific mAP threshold in each class before deploying the model in production? In this section, we’ll explore potential shortcomings in the dataset. Then, in Section 5, we will demonstrate how to address these issues — in fact, we will show you how to enhance the dataset quality of any Roboflow dataset.
As figure 7 shows, we can obtain a big picture of the data by using Tenyk’s multi-class object detection matrix.
0:00/1×Figure 7. Multi-class object detection matrix in action
From this graph we can see that both ‘No Left Turn’ and ‘No Right Turn’ have a high number of mispredictions. For instance, there are at least 6 samples where ‘No Left Turn’ was mispredicted as ‘No U Turn’. On the other hand, we can also see that there are 19 undetected examples for the class ‘No Right Turn’.
In a nutshell the multi-class confusion matrix allows us to quickly grasp some key insights of where the model might be failing.
For this article we will focus on only one kind of failure: label quality.
“Label quality refers to whether the labels of the dataset are complete and accurate”. High quality labels are necessary for an object detection model to learn effectively.
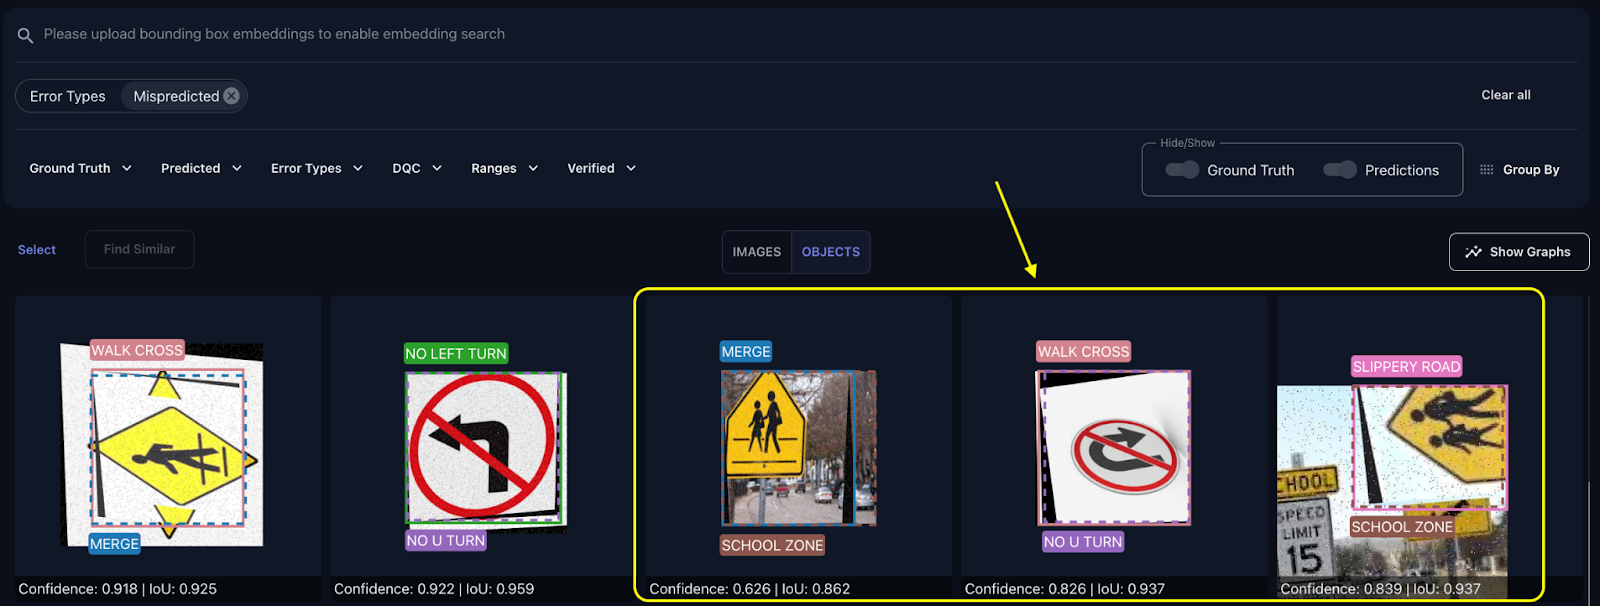
Figure 8 displays several instances in the dataset that were incorrectly labeled. The Tenyks platform provides built-in one-click features to reveal various types of errors. In this particular case, we employed the misprediction filter to swiftly identify objects with incorrect labels.
The above figure presents a comprehensive sequence where the ‘School Zone’ class is inaccurately labeled as a ‘Merge’ class. Additional instances of mislabeling include a ‘No U-Turn’ class wrongly marked as a ‘Walk Cross’ class, and a ‘School Zone’ class erroneously identified as ‘Slippery Road,’ as illustrated in Figure 9.
The misprediction filter is not the only tool we can use to spot potential errors with the labels. Another tool in the Tenyks platform that can help us to find similar examples is the similarity-search feature: given an image or an object, we can find other similar images or objects that share similar characteristics.
0:00/1×Figure 10. Using Tenyks’ feature similarity search to find similar incorrectly labeled objects
Figure 10 shows how we search by similarity at the object-level to find other instances that might reflect misprediction issues. In this example, we first select a mispredicted example: a ‘Walk Cross’ class that is being predicted as ‘Merge’ with a value of 0.83 confidence. Once this example is selected, we search for similar objects.
We obtain two other objects that show label problems: an incorrectly labeled ‘Merge’ class predicted as ‘School Zone’, and an incorrectly labeled ‘Uneven Road’ class predicted as ‘School Zone’.
While auditing an object detection dataset, examining false positives generated by the model can unveil instances of incomplete labeling.
0:00/1×Figure 11. Issue # 2: an instance of class Speed Limit 100 KMH with a missing annotation
By monitoring false positives through the Tenyks platform and utilizing the one-click error-type filter ‘False Positive,’ it becomes easier to identify systematic annotation gaps. This allows for the addition of missing labels. Figure 11 illustrates an object of the ‘Speed Limit 100 Kmh’ class that lacks an annotation — in fact, an annotation exists, but it’s not accurately encompassing the intended object.
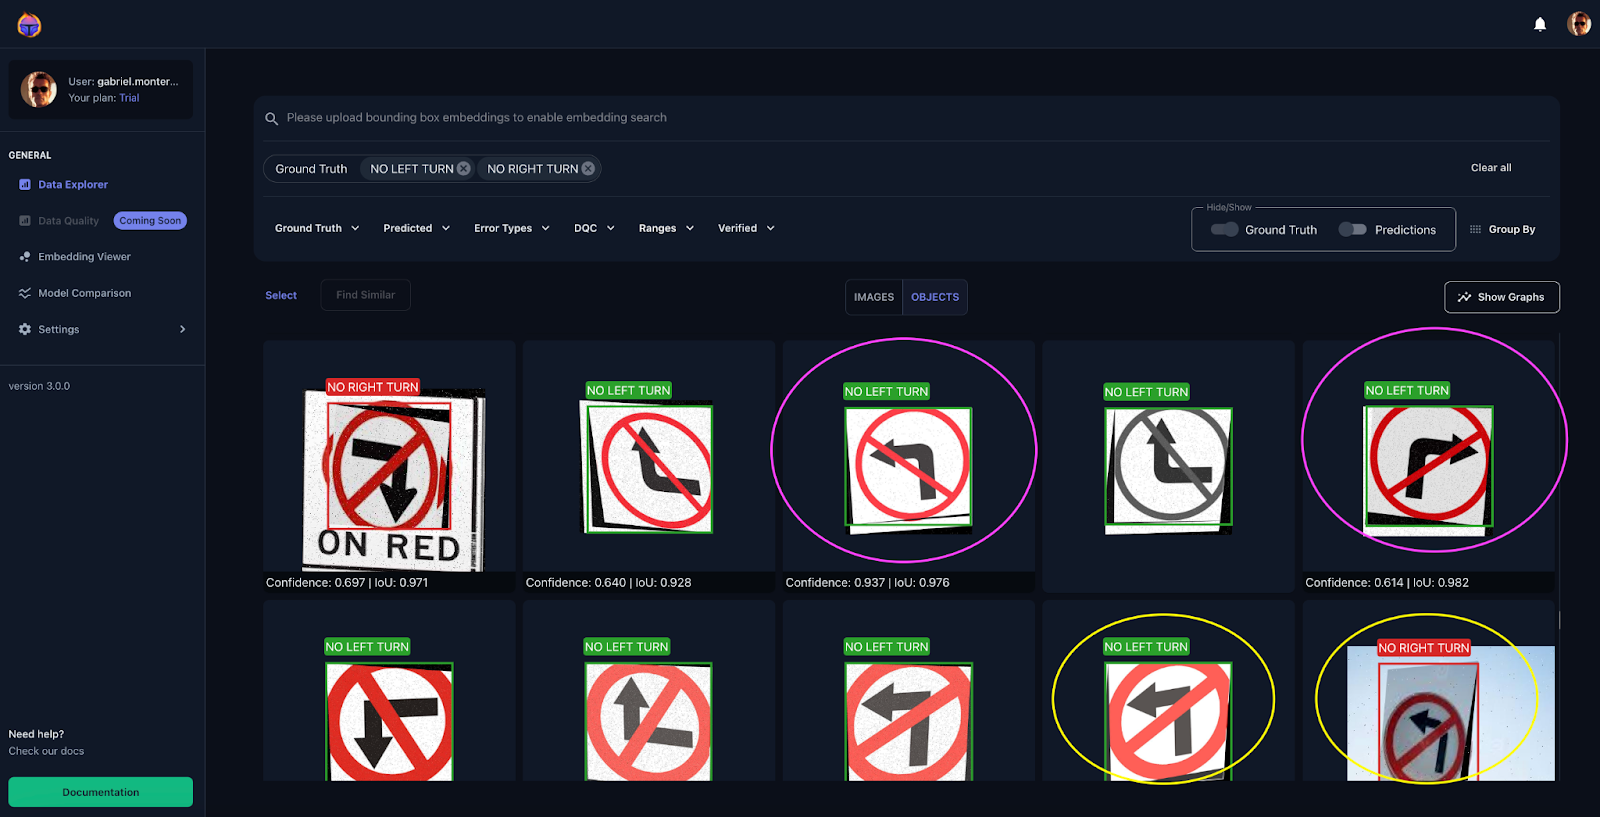
Figure 12 displays inconsistent labeling between the ‘No Left Turn’ and ‘No Right Turn’ classes. Upon applying the ‘Ground Truth’ filter, it becomes evident that these two classes exhibit labeling inconsistencies: there are many instances where a ‘No Left Turn’ was labeled as ‘No Right Turn’, and vice versa.
This lack of uniformity confuses the model and impedes its capacity for generalized learning. In fact, these two classes demonstrate the lowest mAP performance on a per-class basis.
To be more specific, it appears that this dataset was initially augmented 😮, resulting in the flipping of several images both horizontally and vertically.
In Figure 13, you can observe how similar objects were labeled as both ‘No Left Turn’ and ‘No Right Turn’ classes ⚠️. Interestingly, the augmentation technique of flipping these two objects (i.e., ‘No Left Turn’ and ‘No Right Turn’) turns out to be counterproductive for the model. Tenyks aids in discovering such insights through its built-in features, designed to enhance the productivity of ML Engineers.
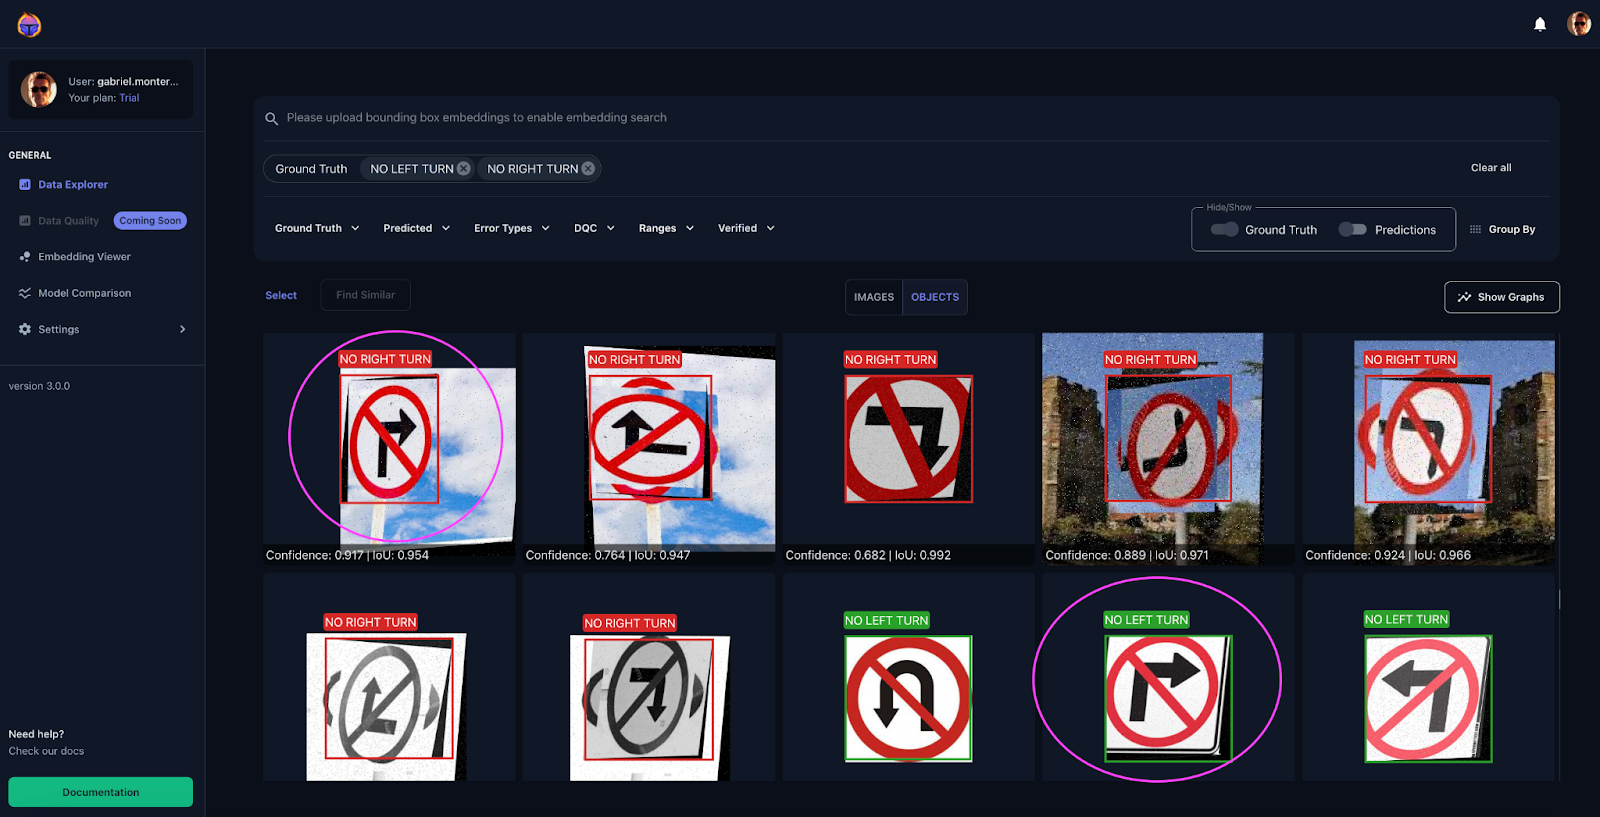
Figure 14, shows another example of how augmentation hurted the dataset: very similar objects (circled in yellow) were labeled as both ‘No Left Turn’ and ‘No Right Turn’ classes ⚠️.
During the dataset inspection phase, you can group the troubled examples by using tags. Figure 15 illustrates how some of the examples we showed you previously can be tagged by error, so that after you categorized a number of them, the Embedding Viewer can help you identify some patterns in your data by filtering by the tags you assigned.
0:00/1×Figure 15. Another example of No Left Turn and No Right Turn classes wrongly labelled
In summary, we found:
- Incorrect labels: some objects were annotated with the wrong label.
- Missing labels: some objects were poorly annotated (i.e. the bounding boxes did not frame any class object).
- Inconsistent labels: object A and object B were given the same label, even when object A and object B are different.
Fixing Issues to Improve Dataset Quality
Now that we have identified three types of data issues, we can use the Roboflow annotation tool to fix our dataset.
Figure 16 shows how Roboflow helps us quickly fix one of the instances annotated with an incorrect label. The object was annotated with a label Walk Cross, when in reality it belongs to class No U Turn.
0:00/1×Figure 16. Fixing an incorrect label for the class No U Turn in Roboflow
Obtaining higher model performance — with the new improved dataset
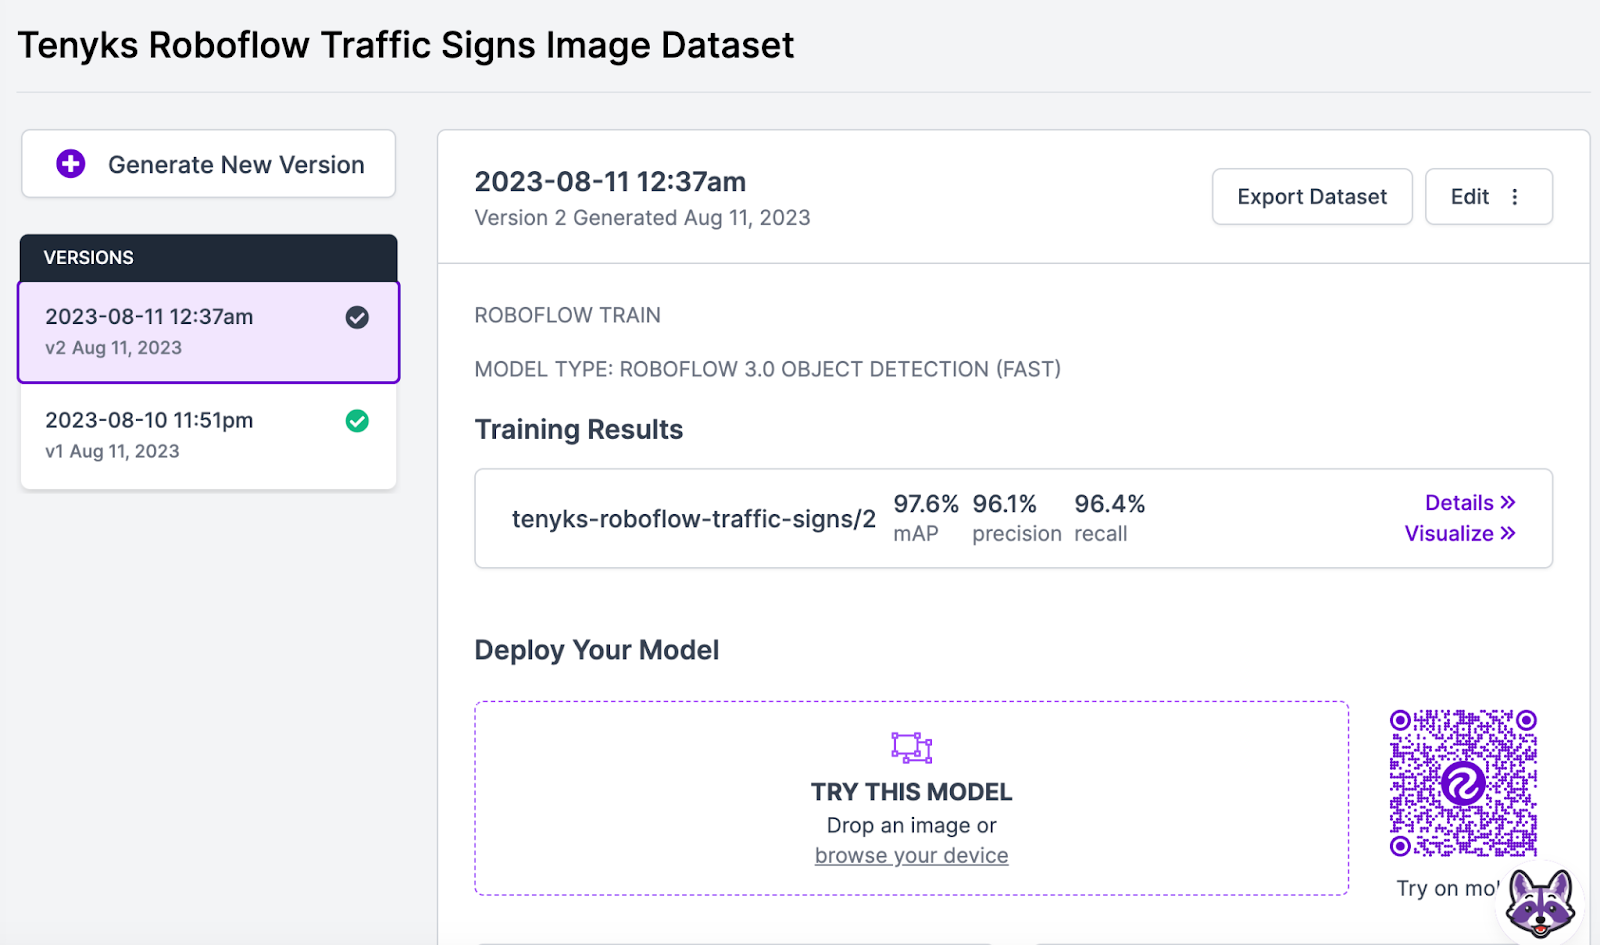
After we addressed the label quality issues previously discussed, we retrained our model in Roboflow with the revamped dataset, see figure 17.
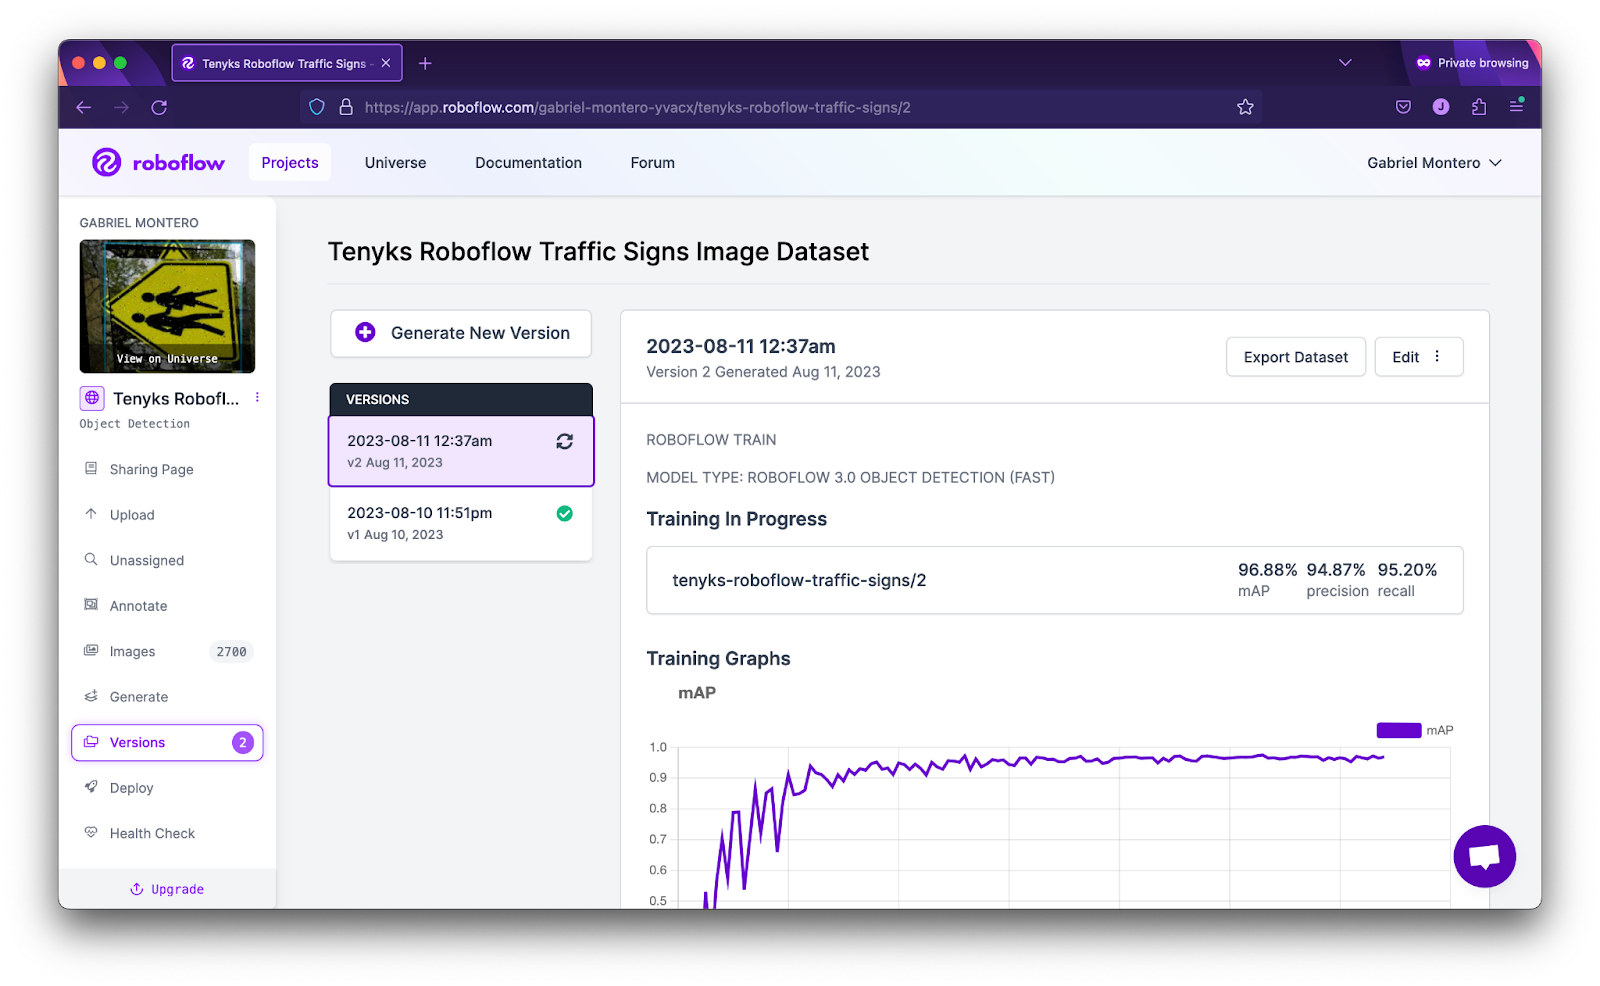
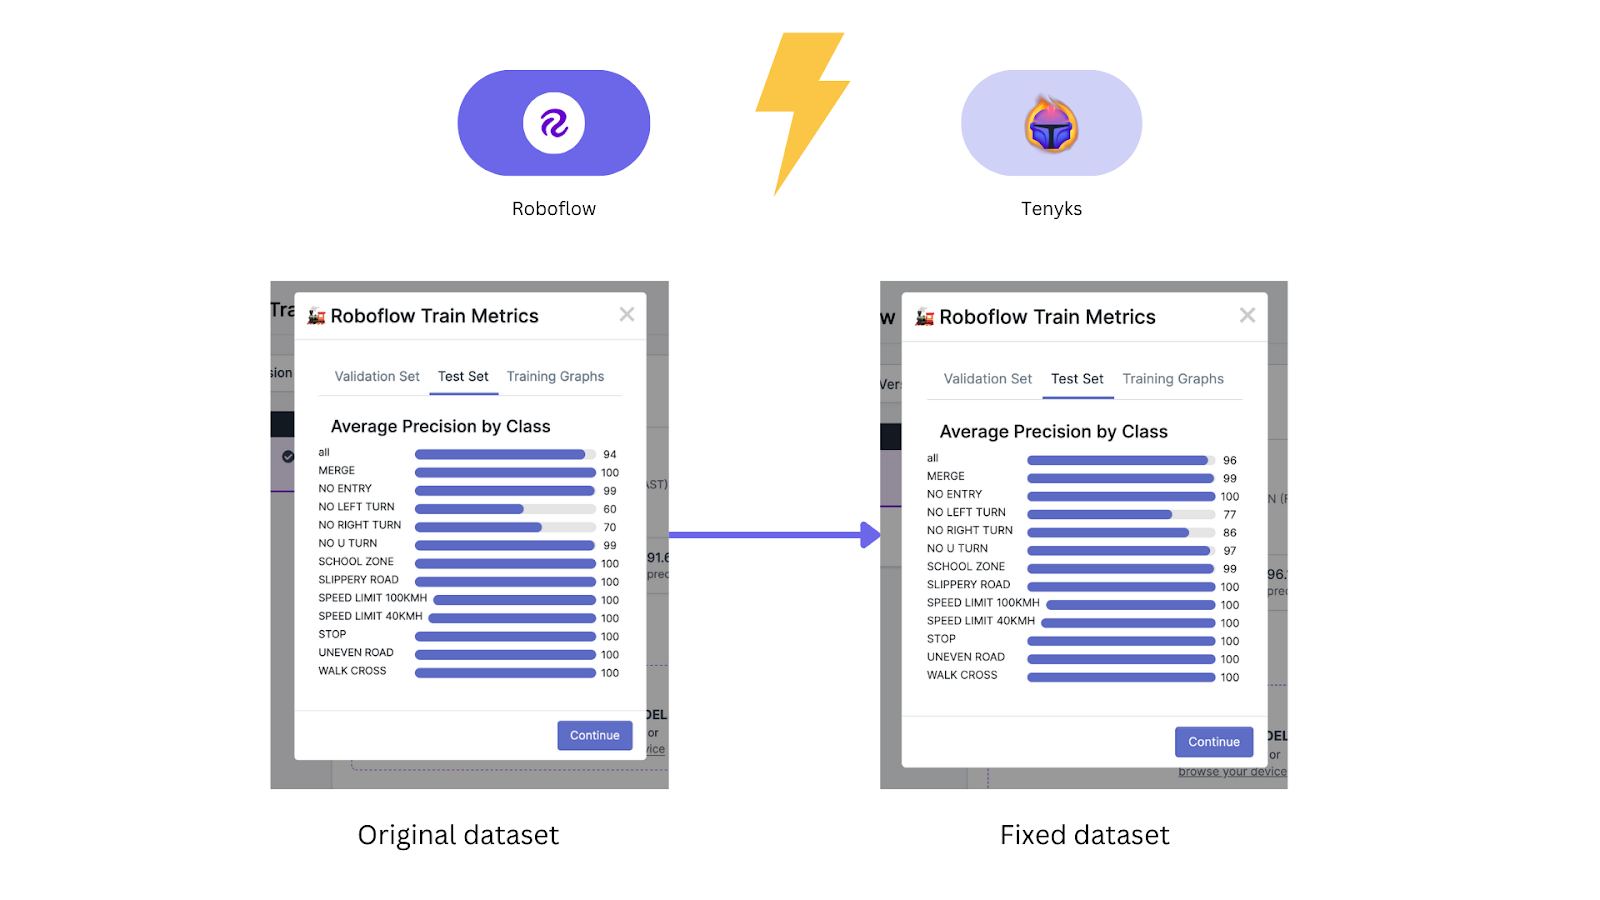
Figure 18 and 19 show that model performance increased from 94% mAP to 97.6% mAP, whereas performance for ‘No Left Turn’ class increased from 60% mAP to 77% mAP, and performance for ‘No Right Turn’ increased from 70% mAP to 86% mAP.
Finally we can use the model comparison feature on the Tenyks platform to obtain a clear picture of how the model performance improved on a per-class basis.
0:00/1×Figure 20. Comparing model performance between baseline and improved model
What Did We Learn?
In this article we showed how we can improve model performance by focusing on the data quality of your Roboflow dataset.
We started by training a baseline model using Roboflow Train, then we uncovered dataset issues using the Tenyks platform. After fixing these issues with the Roboflow annotation tool, we trained a new model that showed better performance.
Our improved model was not perfect, we can see on Table 2 that this new model still fails to discriminate between ‘No Left Turn’ and ‘No U Turn’ classes. One approach to fix this problem might be to add more training examples of these classes, so that the model can learn to distinguish between the two.
As we showed, a naive inference test can help you assess whether your “high mAP” model is as good as it seems on paper. This basic yet effective approach can truly help you to drive your model debugging in the right direction.
As we said earlier, Roboflow and Tenyks is a match made in heaven, and you can improve your model performance with a combination of both.
Cite this Post
Use the following entry to cite this post in your research:
Trevor Lynn. (Sep 15, 2023). Improving Vision Model Performance Using Roboflow & Tenyks. Roboflow Blog: https://blog.roboflow.com/advanced-dataset-model-performance-using-roboflow-tenyks/