
Introduction
Having worked in analytics for the last eight years, I have seen firsthand the evolution of data sources from simple tables to petabyte-scale lakehouses. Much of this data is machine or user-generated text that originates as either an input or an action. Data has undeniably enabled companies to build better products, attract more customers, reduce costs, etc. However, the advancement in computer vision technology has created a new dimension of insight.
Computer Vision Unlocks New Analytics Insights
We've all heard the adage, "A picture is worth a thousand words”. Computer vision (CV) makes this a digital reality. We gain new insight into the world by analyzing visual media like photos or videos. Below are three types of CV data you can use in your data workflows:
- Object Classification: Perhaps the most common use case, CV models can detect and identify objects seen in images and videos. This could be recognizing the number of times a logo appears in a commercial or what color rain jacket is most prevalent in Seattle.
- Time in Zone: This allows analysts to study how much time objects are in a specific zone. Time in Zone metrics can help determine how much time customers spend in a particular store area.
- Tracking: Following the movement of objects provides additional data to power use cases like traffic flow analysis and manufacturing monitoring.
Computer Vision Improves Analytics and Data Science
Integrating data from CV models into analytics and data science workloads significantly enhances the depth of the analysis and fuels machine learning model improvement. Visual data provides a level of detail and context that is unattainable by traditional means. It enables analysts to explore nuanced aspects of data that were previously inaccessible. Also, it becomes possible to ask more context-specific questions.
For machine learning models to improve, constant learning and iteration must occur. By incorporating insights from the real world, organizations can enhance the accuracy and performance of their models in ways not possible via text. This visual data flow ensures a complete feedback loop and advances machine learning algorithms.
Ways to Incorporate Computer Vision in Your Data Stack
Historical Data Analysis: Analyze existing media to extract historical data to uncover missed trends and patterns, feeding into machine learning model training.
One application of historical data analysis is in evaluating car park utilization. Overcrowded parking lots are no fun, especially for those in a rush. Understanding the trends of your parking needs can help you plan for the future.
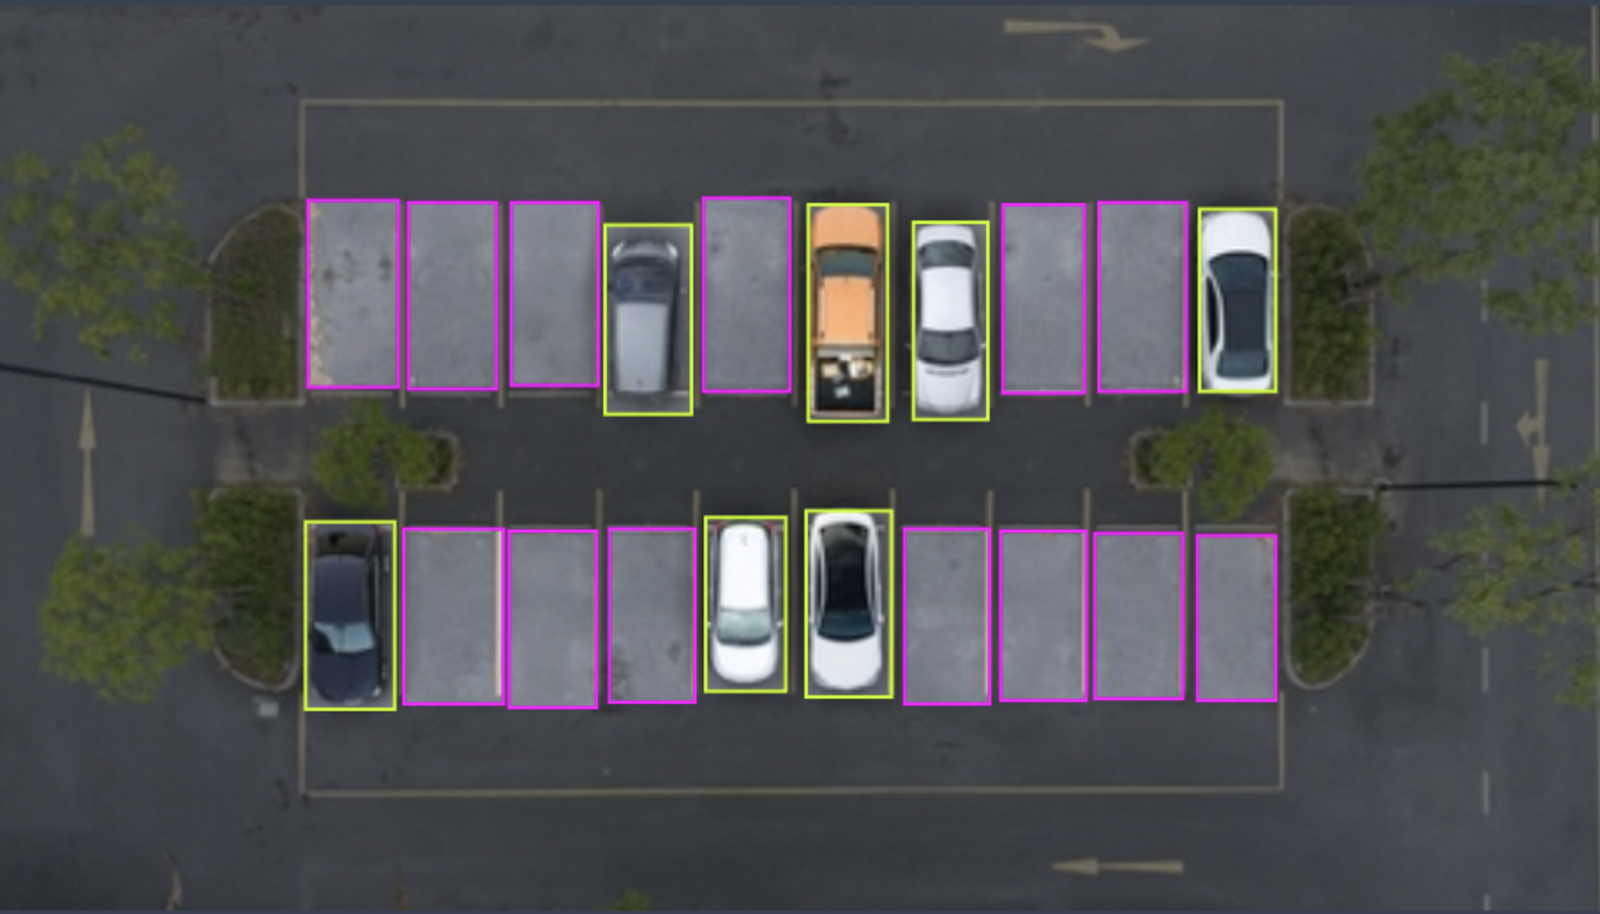
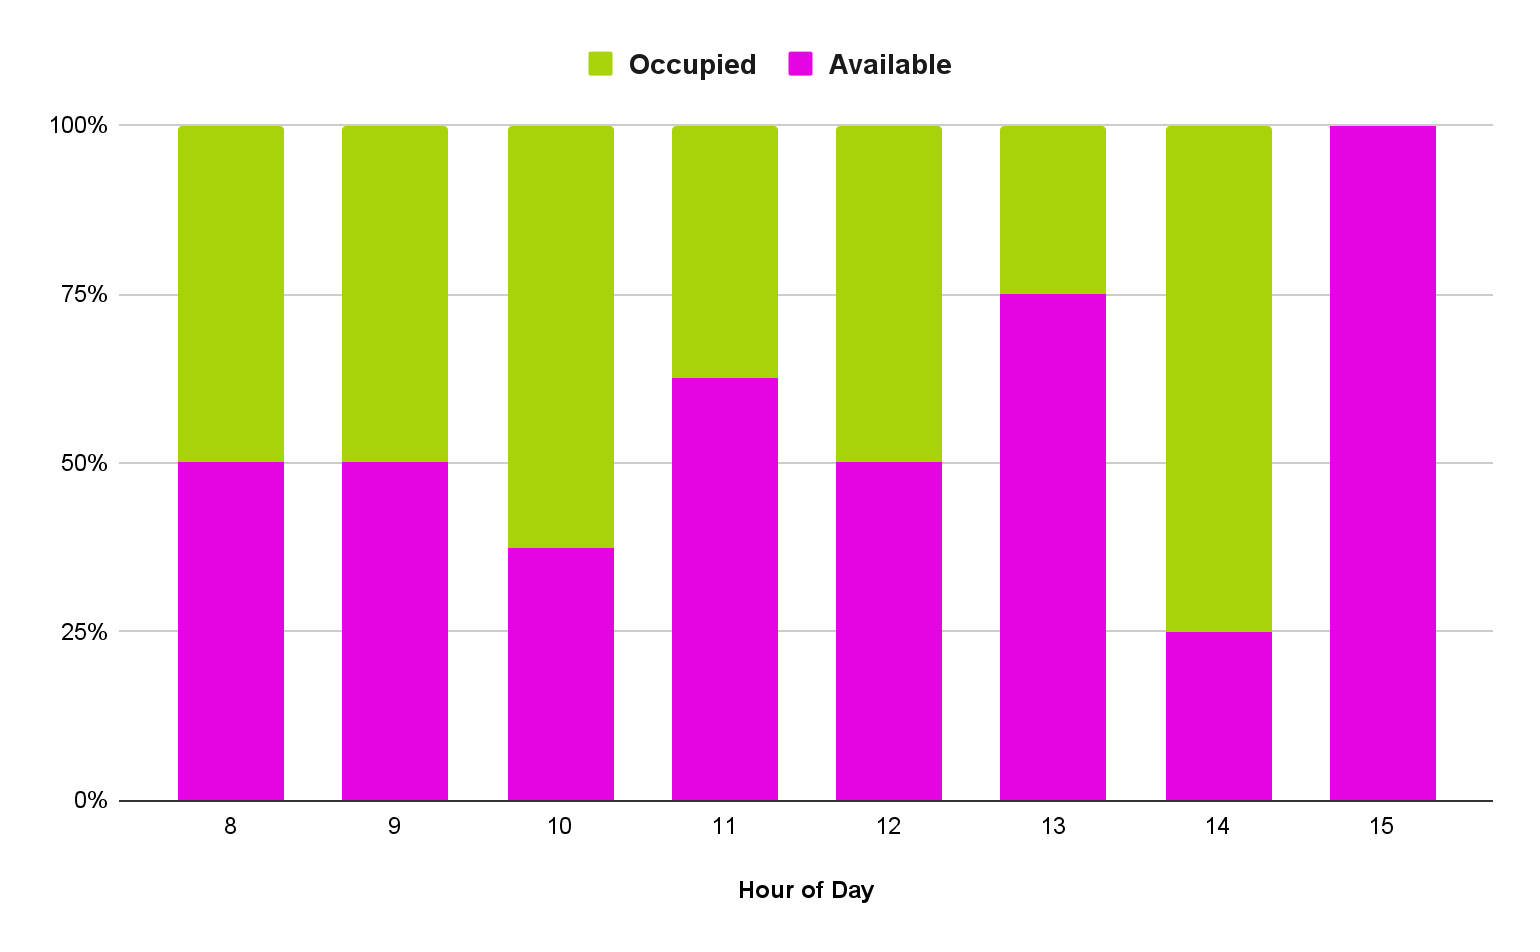
Should you buy more reserved parking for your storefront? How could you optimize your advertising messages to reduce congestion? Check out the PKLot Dataset on Roboflow Universe to build your own parking lot model!
Supplement Existing Workloads: Add a layer of context to existing two-dimensional data workloads.
In many industries, vision is used to supplement existing workloads, gathering insights that can be used to increase productivity, sales, reliability, and more.
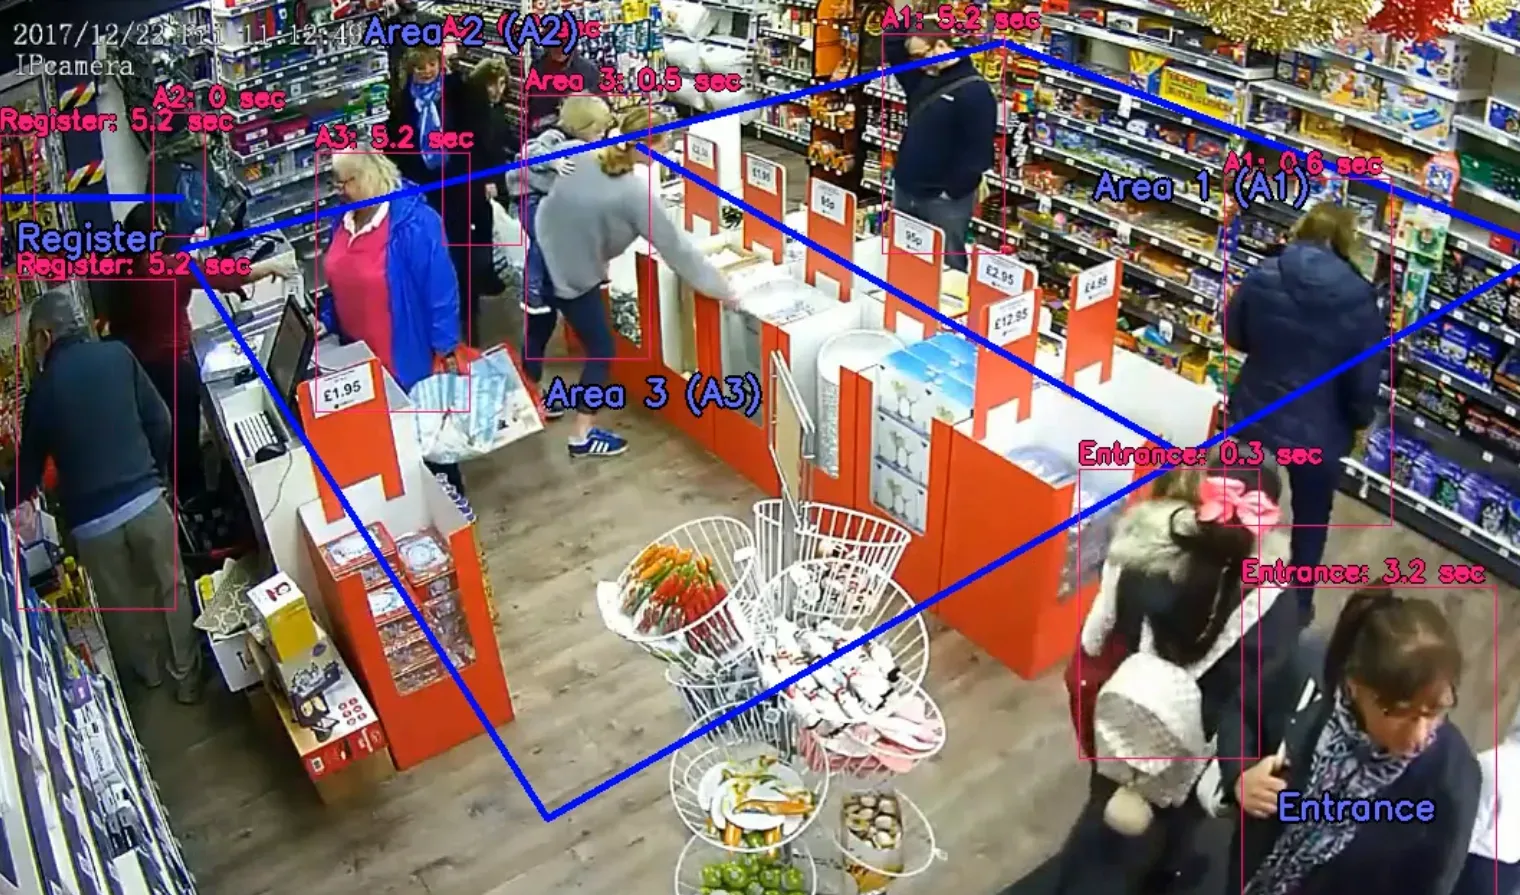
One such example of vision supplementing workloads is in retail. Retailers are often challenged with where to place products, how much to stock, and staffing. Daily sales reports are just one data point that tells part of the story.
What if you could combine this with media to understand where those customers spend most of their time? This would give you the complete picture of your store’s performance and how to improve revenue per sq ft.
In this example, customers spend a longer average time in electronics, so there might be an opportunity to staff this area up to capture more sales. We also see that the take rate of Organic Hand Soap is really low. Should this go in our Organics section to optimize space and target the right buyers?
Check out Monitor Movement in Retail Stores with Computer Vision to learn more about this use case!
Real-Time Analytics: Immediately gain insight from live video streams to enable real-time decision-making.
Real-time analytics are invaluable across industries, from manufacturing to logistics. For example, consider inventory management. Managing inventory is a challenge because it often requires manual entry and counting. Tracking inventory is error-prone, and rather than helping customers, employees focus on mundane tasks that you can automate. What if you could quickly take a photo of a shelf to determine which products to restock?
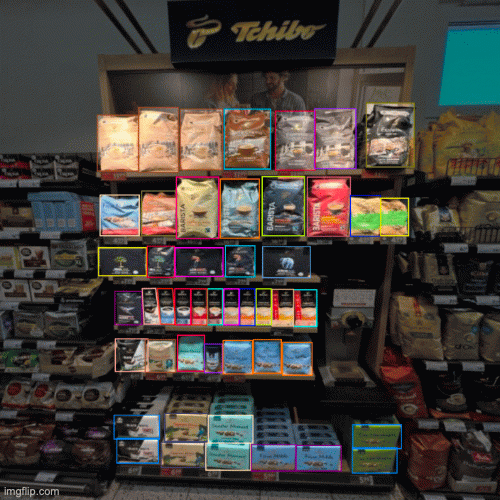
Check out How to Use Computer Vision to Monitor Inventory to learn how to implement inventory tracking using Roboflow’s inference server.
Conclusion
By tapping into computer vision's rich, contextual information, analysts and data scientists can uncover deeper insights and make more informed decisions to drive innovation. As technology advances, computer vision in analytics is ready to become even more integral, opening new frontiers in data-driven decision-making.
Cite this Post
Use the following entry to cite this post in your research:
Brandon Jernigan. (Dec 4, 2023). Use Cases for Computer Vision in Analytics. Roboflow Blog: https://blog.roboflow.com/computer-vision-in-data-analytics/