When you are working with keypoint detection models, one of the first things you will need to do is plot predictions onto source images. This is essential to help you better interpret the results of your model.
You can draw keypoint detections from a variety of popular model architectures, from MediaPipe to Detectron2 to YOLOv8 Keypoint, onto a source image using the supervision Python package.
Supervision is a Python package with a wide range of utilities for working with computer vision models, from support for visualizing predictions to features for post-processing and filtering detections.
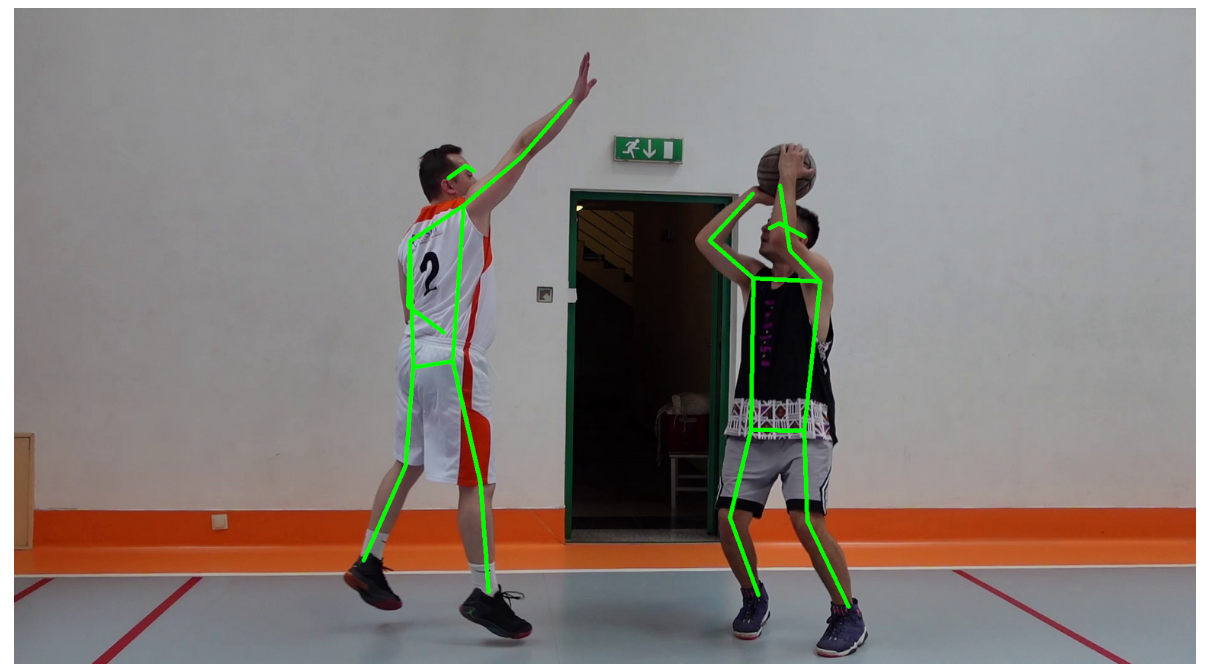
Here is an example showing the results of using supervision to draw keypoint detections:

In this guide, we will demonstrate how to draw keypoint detections with Python and supervision.
Without further ado, let’s get started!
How to Draw Keypoint Detections with Python
To get started, we need to install the supervision Python package. You can install the package using the following code:
pip install supervision
With supervision installed, we can start building the logic to draw our keypoint detection.
Step #1: Load Data
To draw predictions, we first need to load our data into a supervision KeyPoints object. Using supervision’s keypoint data loaders, you can load data from a variety of popular keypoint detection libraries with a single line of code.
Supported libraries include:
- Roboflow Inference
- Detectron2
- MediaPipe
- Ultralytics (i.e. YOLOv8)
- YOLO-NAS
To see a full list of supported libraries, refer to the supervision KeyPoints API documentation.
For this guide, we will load results from Roboflow Inference. We can do so with the following code:
import cv2
import supervision as sv
from inference import get_model

model = get_model(model_id="keypoint")
image = cv2.imread(<SOURCE_IMAGE_PATH>)
results = model.infer(image)[0]
detections = sv.KeyPoints.from_inference(results)
Our model detections are now in the sv.KeyPoints object assigned to the variable detections.
Step #2: Choose an Annotator
With our detections in the supervision KeyPoints format, we are now ready to choose an annotator. Supervision offers several annotators for KeyPoints:
- VertexAnnotator: Draws dots where keypoints are.
- VertexLabelAnnotator: Draws dots with labels where keypoints are.
- EdgeAnnotator: Draws lines between all keypoints.
For this guide, let’s use the EdgeAnnotator.
Refer to the supervision documentation for a full list of all keypoint annotators.
Step #3: Draw Predictions
Once you have chosen an annotator, you can use it with the following code:
edge_annotator = sv.EdgeAnnotator(
	color=sv.Color.GREEN,
	thickness=5
)
annotated_frame = edge_annotator.annotate(
	scene=image.copy(),
	key_points=key_points
)

sv.plot_image(annotated_image)
If you want to use another annotator, replace EdgeAnnotator with the name of the annotator you want to use above.
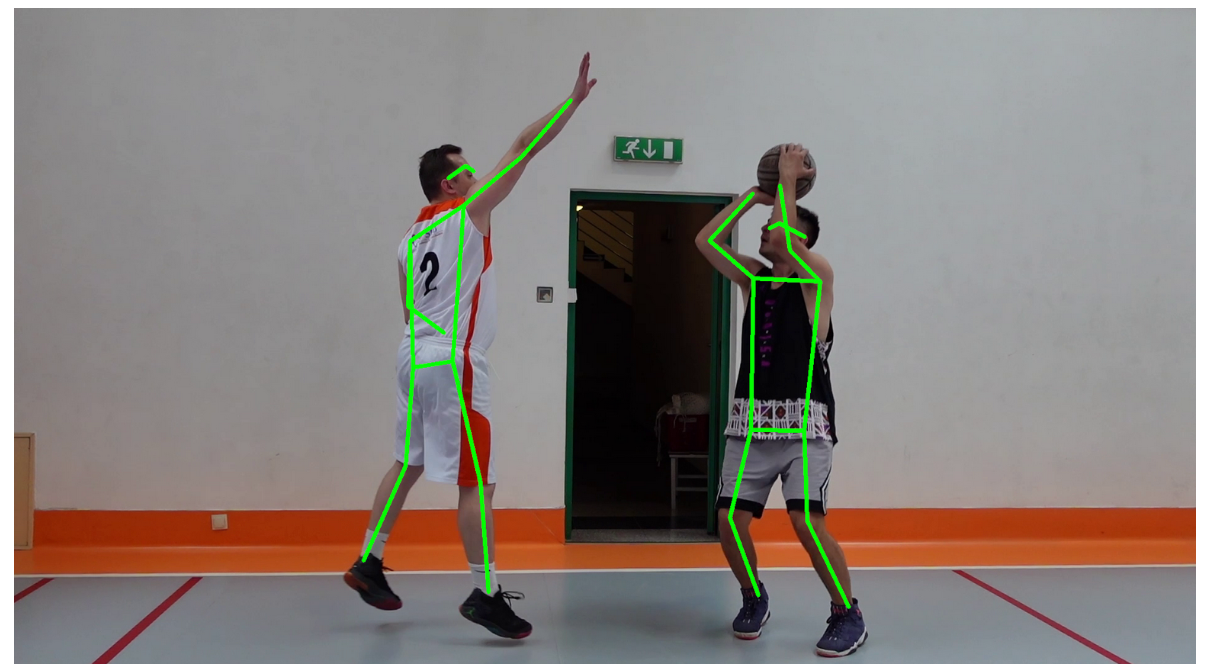
When our model is run on an image of two people playing basketball, we get the following results:

Our model successfully identified keypoints. Supervision then plotted those on our input image.
Conclusion
The supervision Python package provides a range of utilities for use in working with computer vision models. In this guide, we walked through how to use the supervision KeyPoints API to load key points into supervision, and how to use annotators to draw key points onto an image.
We used the EdgeAnnotator that draws lines between all key points in an image.
To learn more about the keypoint functionalities available in the supervision Python package, refer to the supervision KeyPoint API documentation.
Cite this Post
Use the following entry to cite this post in your research:
James Gallagher. (Sep 3, 2024). How to Display Keypoint Detections with Python. Roboflow Blog: https://blog.roboflow.com/display-keypoint-detections/
