

When you're building a computer vision system, the end goal isn't the model but the problem it solves. That might be inspecting critical infrastructure to schedule maintenance crews more effectively, catching defects on a production line before they ship, or analyzing satellite imagery to evaluate crop health across a region.
Solving those problems isn't a one-person job. Your vision system must work alongside a team of experts: a quality engineer who stops a line when a defect is flagged, a maintenance planner using it to decide which asset to repair first. For those experts to trust the system and act on it, the data it produces has to be accurate, accessible, and actionable. That requires an easy way to correct the model when it's wrong, and flexible access when someone wants to check the data on their own terms.
Those needs are the reason we built Vision Events, a central hub for all the predictions, images, and metadata your vision systems generate. In this article, we'll look at a few recent additions that make that hub more useful: closing the feedback loop between the system and the people using it, a built-in dashboard for seeing what's happening across your deployments, and asking questions of your event data in plain language.
Video: Vision Events helps you collect feedback from your team, review the images flagged as incorrect, and add those images into a training dataset for future improvement.
Vision Events: one place for every event your vision system produces
Vision systems produce data in shapes that traditional tools were not designed to hold together. One event includes several kinds of data, like model predictions, one or more images, the device that produced it, and additional context. In a manufacturing scenario, the additional context could be the specific facility, assembly line where the event happened, the shift, the lot number, the operator on duty, and more.
Traditionally, storing all those disparate items in one place wasn't easy. Vision Events provides a centralized place for every event, capturing the model output, its input and output images, source device information, and any custom metadata you pass through. That way, you have a searchable, structured history you can query by device, by time, by detection class, or by any metadata field.
Video: Exploring feedback loops, dashboards, and plain language queries in Vision Events.
Operator feedback: let the people who use the vision system help improve it
The first computer vision model you deploy is rarely the last. As the system runs, conditions change: lighting shifts, products change, new processes are introduced. Even when nothing dramatic changes, small drifts in the environment can push a stable model into producing more false positives or negatives. Keeping the system useful means iterating on the model over time.
Why knowledge from the floor is hard to capture
The team building and managing the system can't be at every location, watching for environmental changes or false positives. Even if they could, they may not have the domain knowledge to recognize what they see. On the other hand, a quality inspection engineer working the line every day catches things you might miss: a defect on a "passing" battery cell, or a lighting anomaly that triggers a false alert. That kind of judgment is what a model needs to keep improving, and it's what a centralized computer vision team has the hardest time collecting.
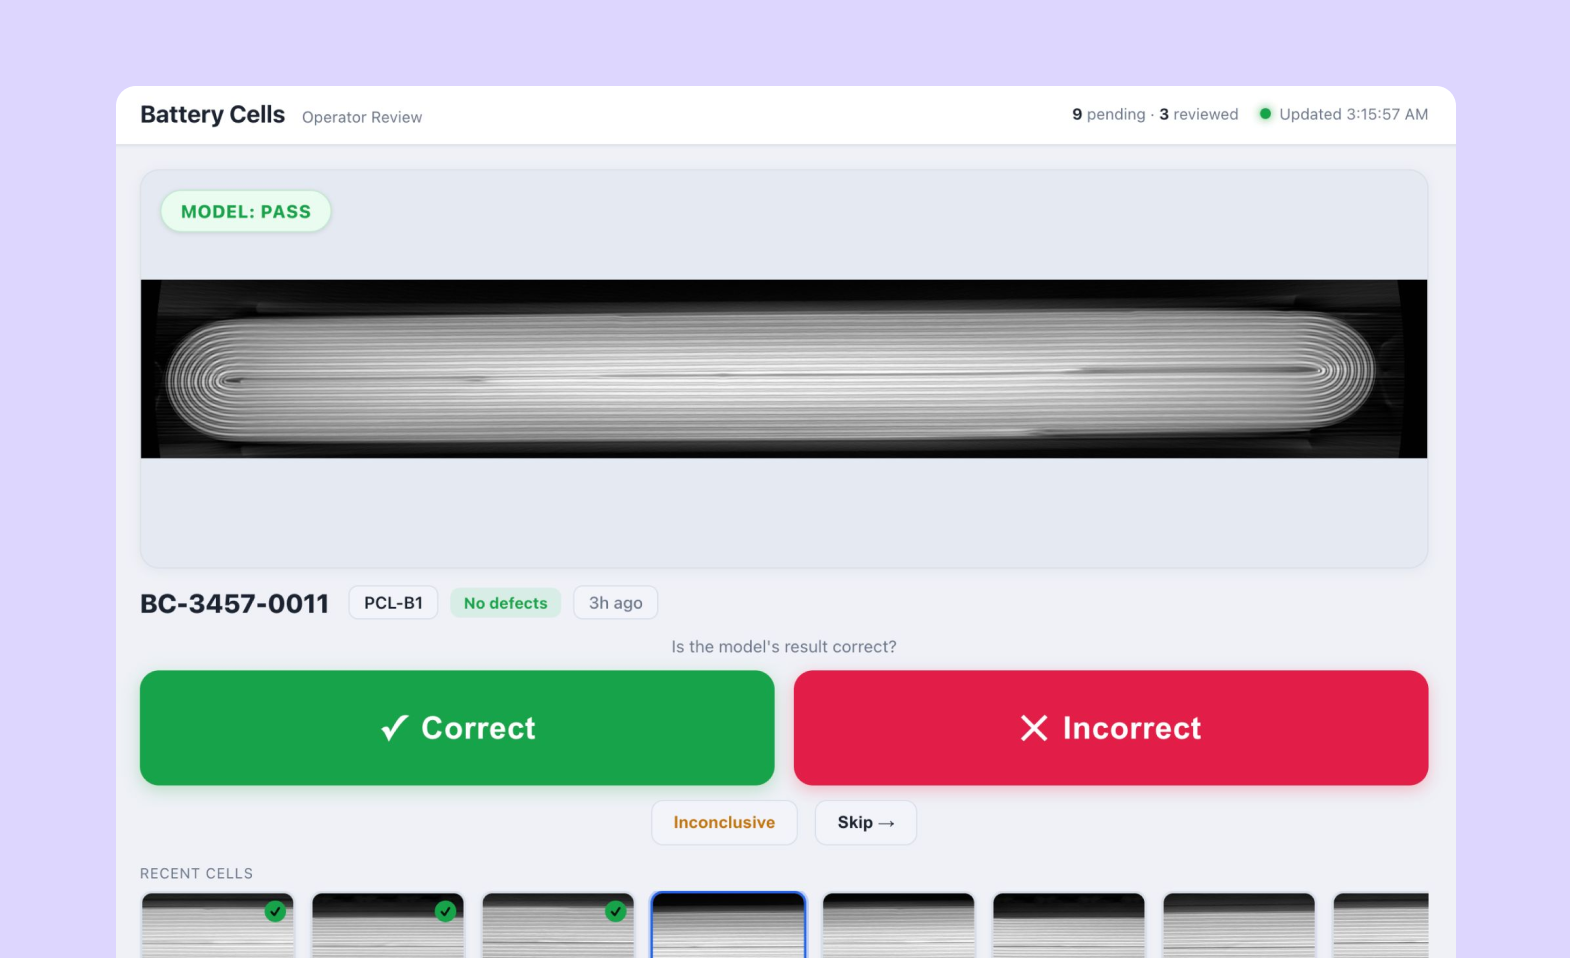
Capturing feedback right from the HMI
That is why we built Operator Feedback into Vision Events. Most floor teams already interact with their vision system through some kind of Human Machine Interface (HMI): a touchscreen next to the line, an embedded display in a control cabinet, or a dashboard on the operator's workstation. Operator Feedback lets that same HMI capture what the operator thinks about each prediction. When they see a false positive or negative, they can tap Incorrect on the touchscreen (or press a physical button wired to the same action). The feedback is stored in Vision Events alongside the image, the prediction, and the metadata.
One record of feedback for the whole team
For the team managing the vision system, feedback from every deployment is collected in one central place. Whether the system is running at one facility or across dozens, feedback can be saved in the same searchable event store. That way, you can find every prediction your team disagreed with, filter by site, line, or shift, and see who reviewed what, all without waiting for a status meeting or reconciling a shared spreadsheet.
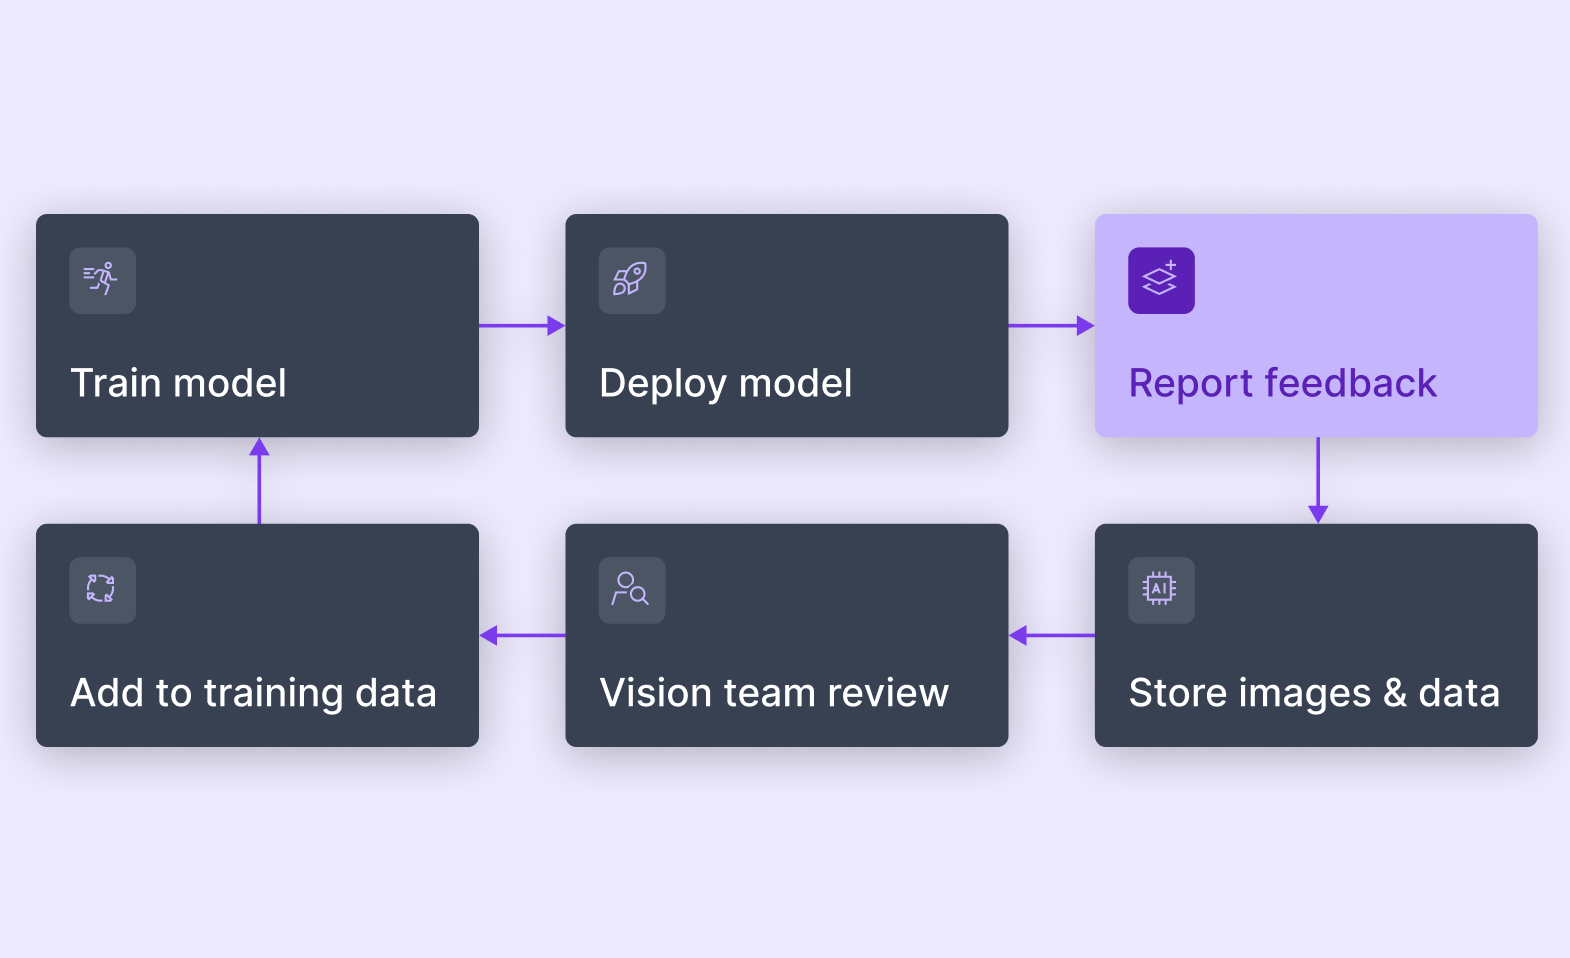
That centralization closes the loop. With feedback saved in one place, you can review the flagged events and pull the images straight into your training data. The next time you retrain and deploy, the model will already reflect what your teams learned in the field.
For more information, please see the Operator Feedback documentation.
Make event data accessible for everyone who works with it
In addition to closing the feedback loop, we've expanded how you and your team can access Vision Events data. You need a working view of what your model is doing across deployments. Other people at your organization need their own. Someone on a factory floor might care about issues detected in the past hour, while a data analyst at headquarters wants trends over months and quarters.
Built-in dashboards: where the vision team closes the loop
Vision Events now includes a built-in dashboard for each use case in the Roboflow app, providing a summary of what your model is seeing across time and locations. You can apply filters, get a sense of trends, and explore specific metrics.
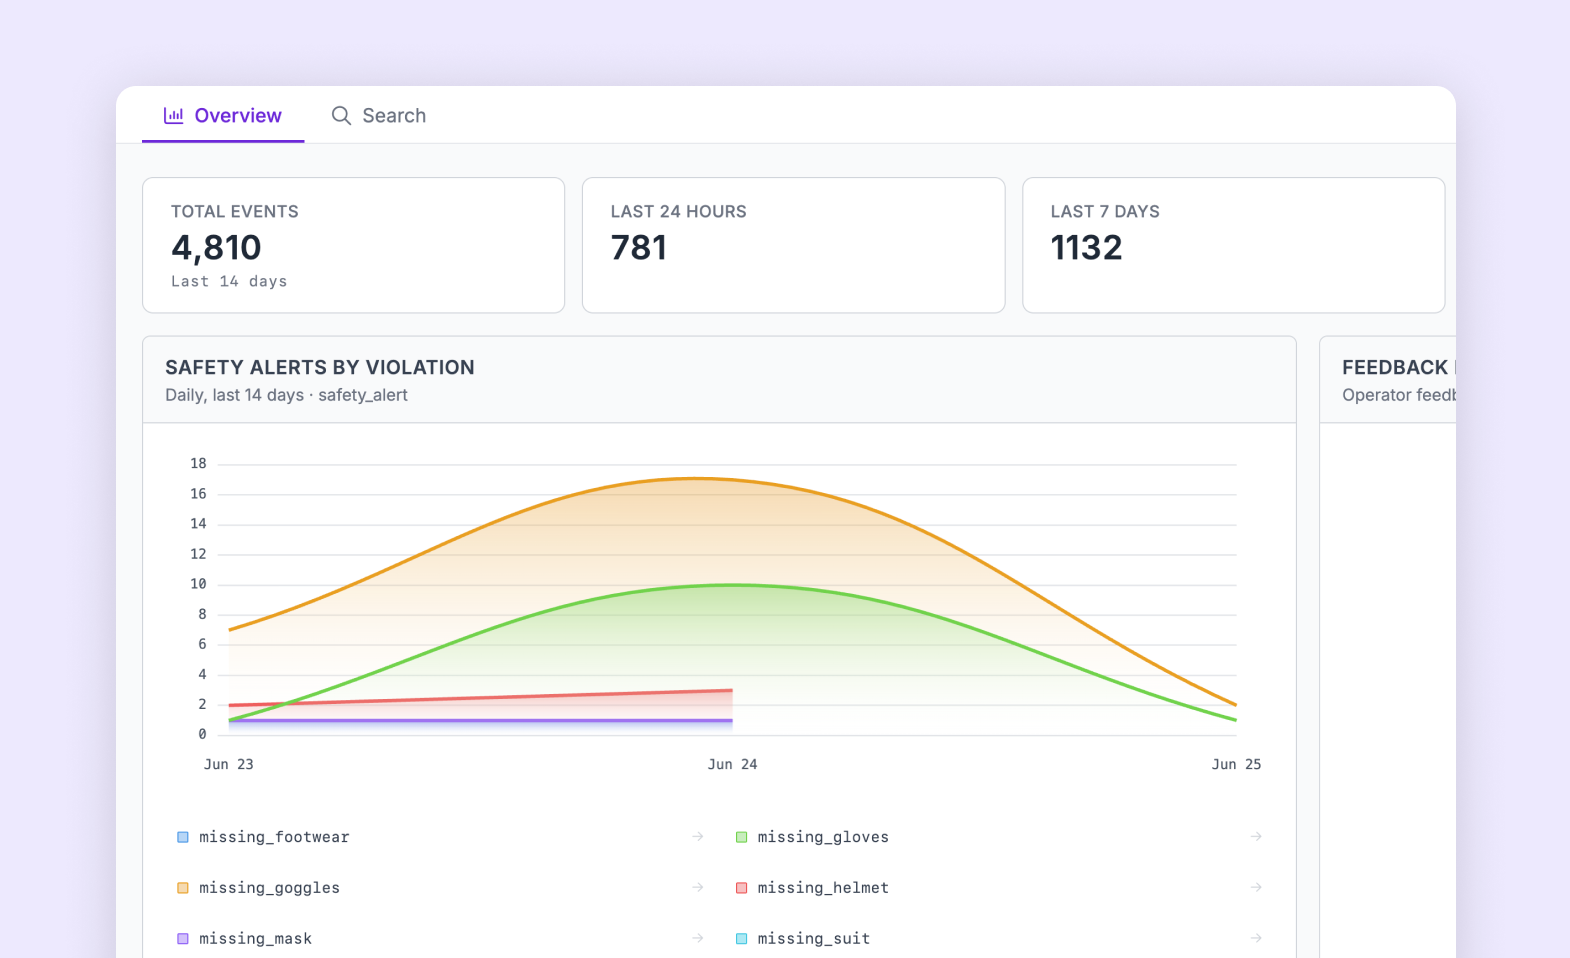
It is also where operator feedback becomes training data. Events that were flagged by your team show up alongside images and other event data. This allows you to review their feedback, spot patterns in what is getting flagged, and add them to the next training dataset all in one place.
For more on filtering and exploring events, see the Query Events documentation.
API: build custom dashboards powered by Vision Events
When the built-in view isn't the right shape for your team, a fully custom dashboard can be built on top of Vision Events data. The Vision Events API exposes the same events and filters the built-in dashboard uses, so a tailored dashboard for a quality lead or a floor manager can show exactly the metrics they want to follow. With the recent addition of Sign-In with Roboflow, your custom dashboards are gated by the same permissions users already have.
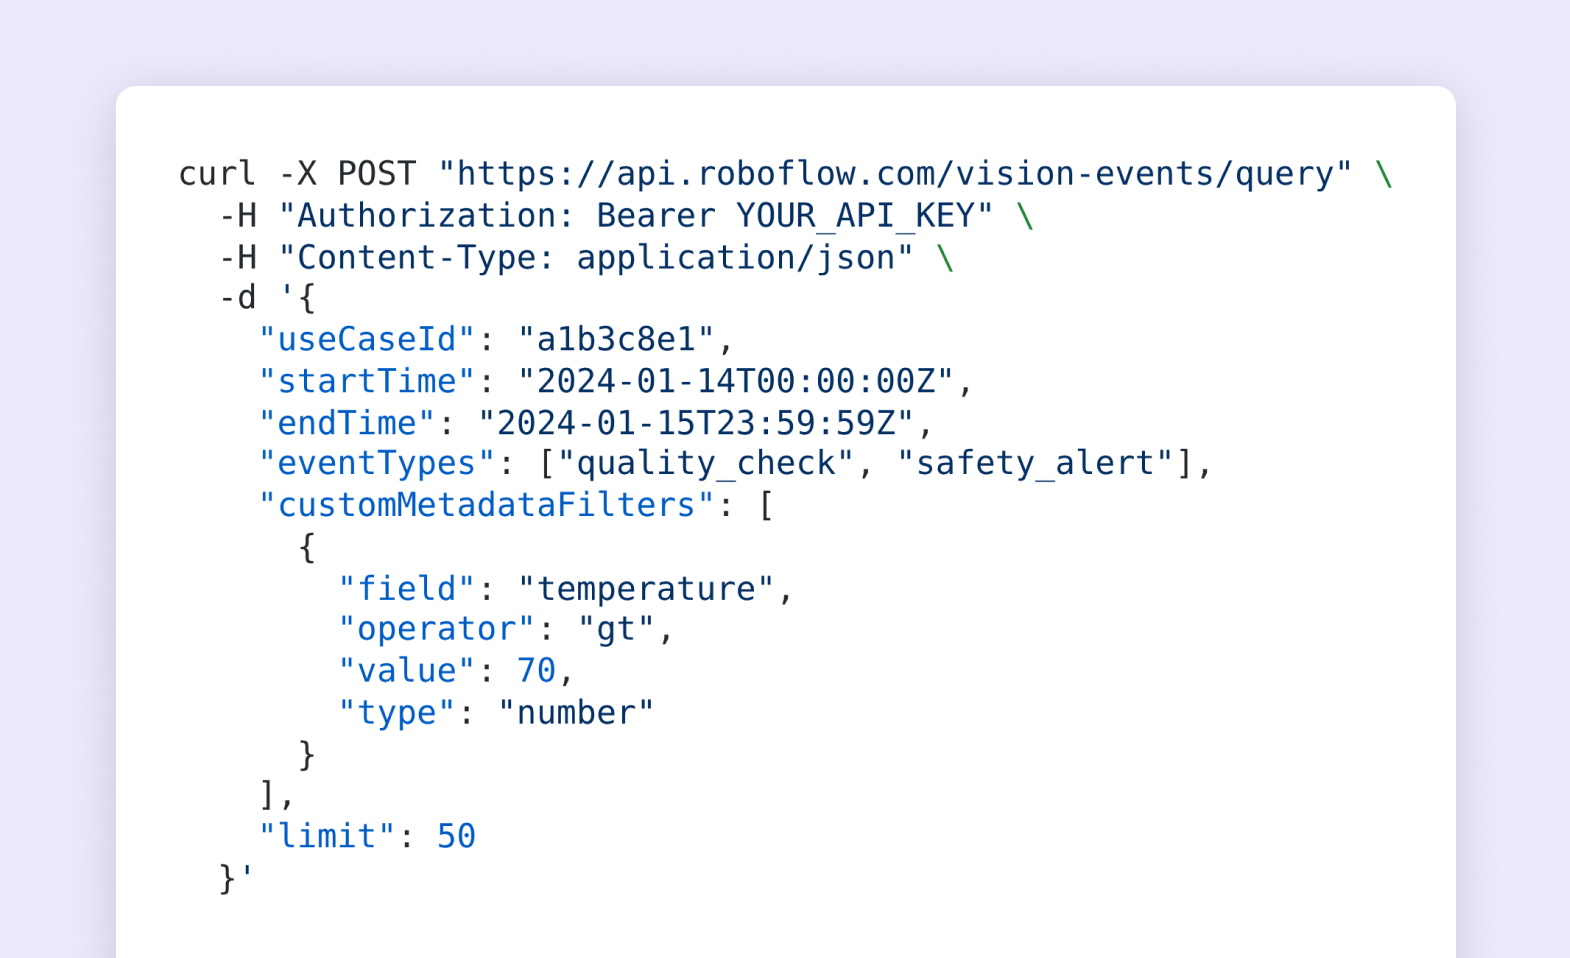
Enterprise customers can also connect Vision Events directly to their data warehouse (like Databricks, Snowflake, and others) so events land next to the rest of their operational data without a separate integration project.
MCP Server: ask questions in plain language
Sometimes the right interface for your event data is a conversation. The Roboflow MCP Server now includes a Vision Events skill, which equips your preferred coding agent (like Claude Code, Codex, or Cursor) with the ability to access and analyze event data for you.
That means you can ask a plain-language question, and your agent gets the answer from Vision Events. "How did the second assembly line do this week compared to last?" gets you the same event data the dashboard would surface, without a dashboard configuration or a query language in the way.
Video: The Vision Events skill in the Roboflow MCP Server lets your preferred agent (Claude Code, Codex, Cursor) query and filter events.
Because the MCP Server can access the same events and filters as the Vision Events API, an agent can answer almost anything you might otherwise open the app to check. For example:
- "Which shifts had the most operator feedback marked incorrect this month?"
- "Compare pass rates on assembly line 2 this week versus last week."
- "What are the top causes of failure on our night shift in the past 30 days?"
- "Show me every event where the model was confident and my team disagreed."
Those are questions that would normally take a data analyst writing custom queries. The agent runs them for you on demand.
Vision Events: turn predictions into accurate, accessible, and actionable insights
A vision system is only as useful as the data it produces. That data has to be accurate so the team trusts it, accessible so the right people can reach it, and actionable so they can do something with it. Vision Events does all three today, from the operator on the floor flagging a missed defect to the analyst asking an AI agent about last week's pass rate.
Log into Roboflow to try it, or talk to our team about getting started.


Cite this Post
Use the following entry to cite this post in your research:
Patrick Deschere. (Jul 9, 2026). Turn Predictions Into Better Models and Insights with Vision Events. Roboflow Blog: https://blog.roboflow.com/get-better-models-and-insights-with-vision-events/