

The COCO benchmark is the gold standard for evaluating object detection models. In March 2025, Roboflow released RF-DETR, the first real-time object detection model to exceed 60 mAP on COCO, achieving 60.5 mAP50:95 at 25 FPS on a T4 GPU.
This article walks you through how mAP is calculated, what each piece means, and how to read it from a real RF-DETR training run on the blood cell detection dataset.
mAP in Object Detection
Object detection models seek to identify the presence of relevant objects in images and classify those objects into relevant classes. For example, in medical images, you might want to count the number of red blood cells (RBC), white blood cells (WBC), and platelets in the bloodstream. To do this automatically, you need to train an object detection model to recognize each object and classify it correctly.
RF-DETR, Roboflow's real-time transformer-based object detection model, trained on the blood cell detection dataset from Roboflow Universe, predicts bounding boxes around each detected cell and assigns a class label with a confidence score.
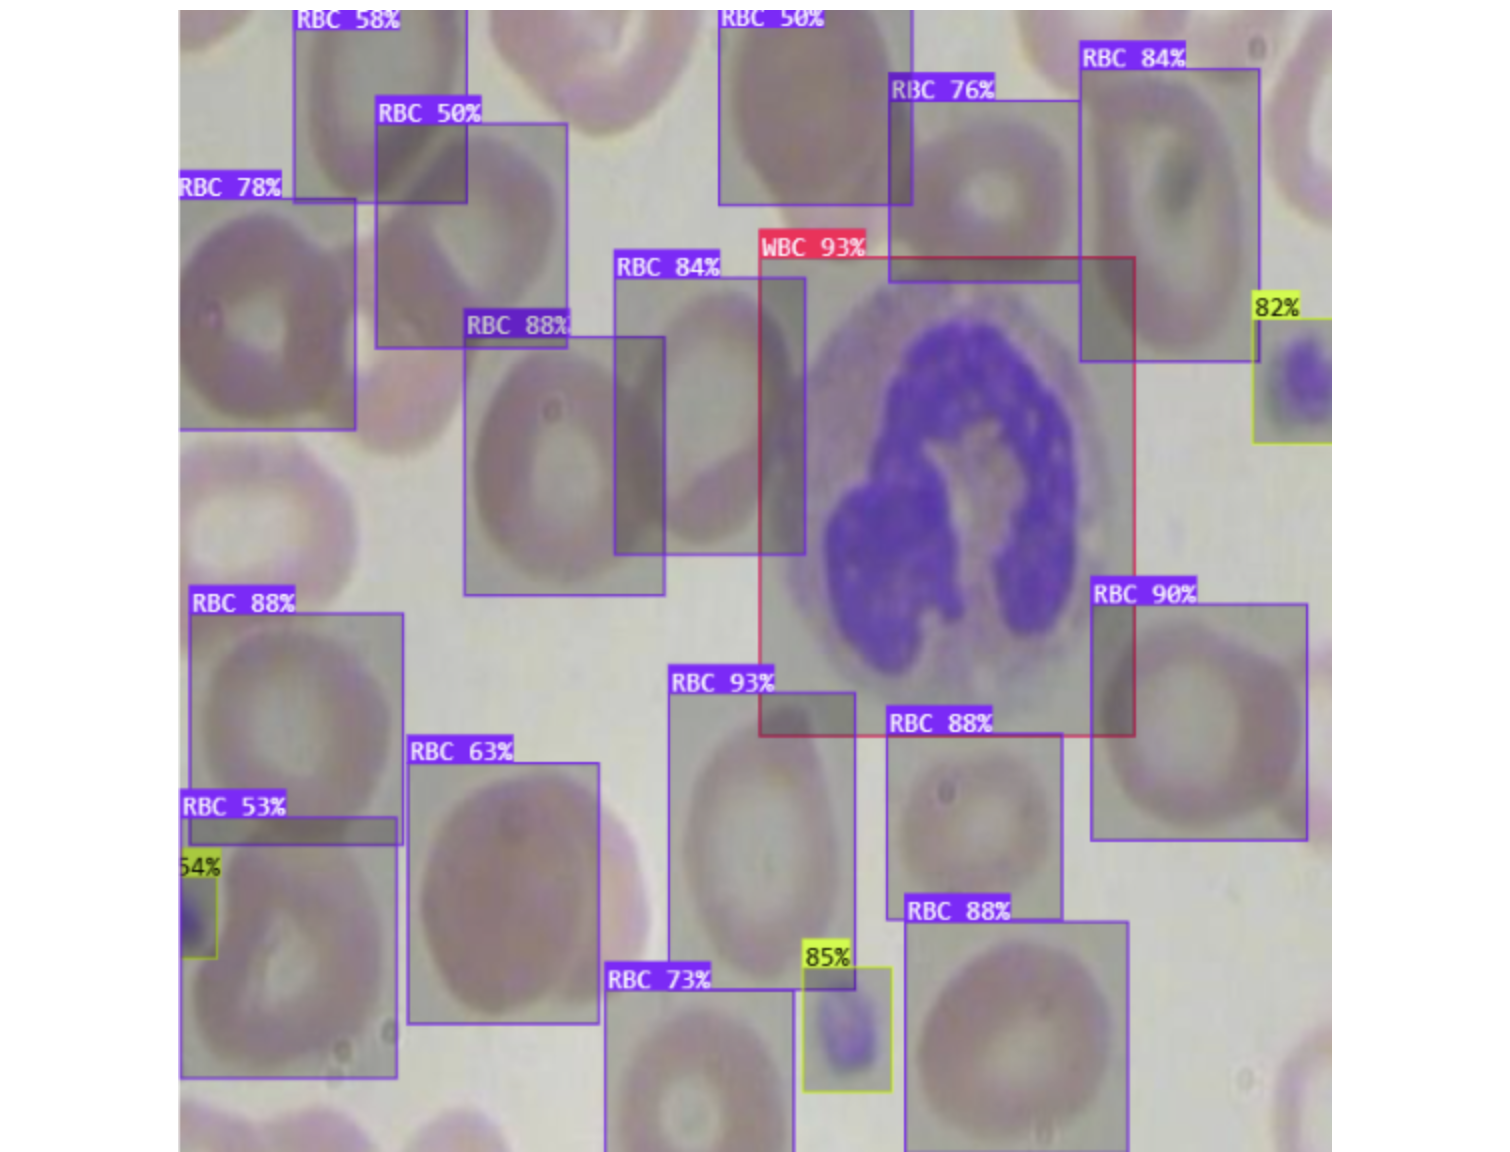
How do you decide which model is best? Looking at a single image is not reliable. You need a way to quantify how a model performs across every image in the test set, across all classes, and at different confidence thresholds. That is exactly what mAP measures.
What Is Mean Average Precision (mAP)?
Mean Average Precision (mAP) summarizes object detection performance into a single number between 0 and 1. To understand where that number comes from, you need three foundational concepts:
- The confusion matrix
- Precision and recall
- The precision-recall curve
mAP is computed by calculating the Average Precision for each class independently, then taking the mean across all classes. A higher score indicates stronger performance across both detection accuracy and classification correctness.
You can use mAP to compare both different models on the same task and different versions of the same model.
What Is the Confusion Matrix?
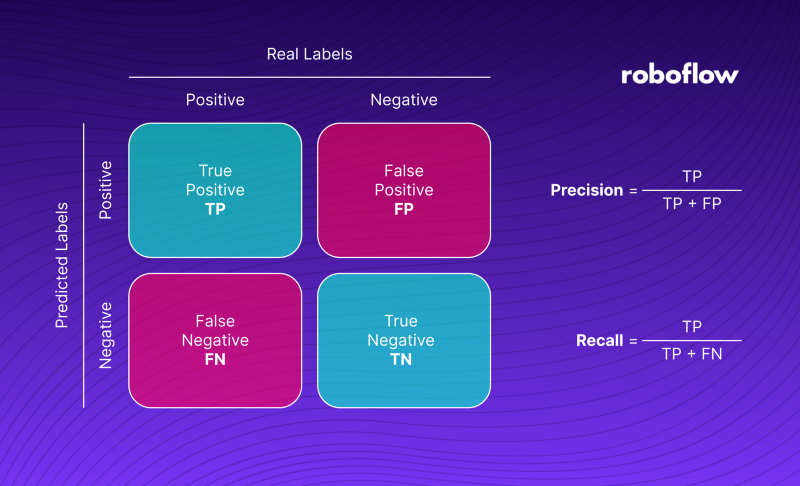
When we evaluate the quality of model detections, we usually compare them with ground truth and divide them into four groups. A case when the model correctly detects an object is called True Positive [TP]. When an object not actually in the image is found, we say it is False Positive [FP].
On the other hand, when an object in the ground truth is not detected, it is False Negative [FN]. The last group is formed by True Negatives [TN]. However, in the case of object detection, it is not taken into account. We can interpret it as all correctly undetected objects - background. The four groups form the so-called confusion matrix, shown in the illustration below.
What Is Precision and Recall?
Precision is a measure of, "when your model guesses how often does it guess correctly?" Recall is a measure of "has your model guessed every time that it should have guessed?" Consider an image that has 10 red blood cells. A model that finds only one of these ten but correctly labels is as "RBC" has perfect precision (as every guess it makes – one – is correct) but imperfect recall (only one of ten RBC cells has been found).
The two metrics pull against each other. Lowering the confidence threshold helps recall but hurts precision. Raising it does the opposite. Understanding this tradeoff is essential to understanding mAP.
What Is the Precision-Recall Curve?
The precision-recall curve, commonly plotted on a graph, shows how recall changes for a given precision and vice versa in a computer vision model. A large area under the curve means that a model has both strong recall and precision, whereas a smaller area under the curve means weaker recall or precision.
Models that involve an element of confidence can tradeoff precision for recall by adjusting the level of confidence they need to make a prediction. In other words, if the model is in a situation where avoiding false positives (stating a RBC is present when the cell was a WBC) is more important than avoiding false negatives, it can set its confidence threshold higher to encourage the model to only produce high precision predictions at the expense of lowering its amount of coverage (recall).
The process of plotting the model's precision and recall as a function of the model's confidence threshold is the precision recall curve. It is downward sloping because as confidence is decreased, more predictions are made (helping recall) and less precise predictions are made (hurting precision).
Think about it like this: if I said, "Name every type of shark," you'd start with obvious ones (high precision), but you'd become less confident with every additional type of shark you could name (approaching full recall with lesser precision). By the way, did you know there are cow sharks?
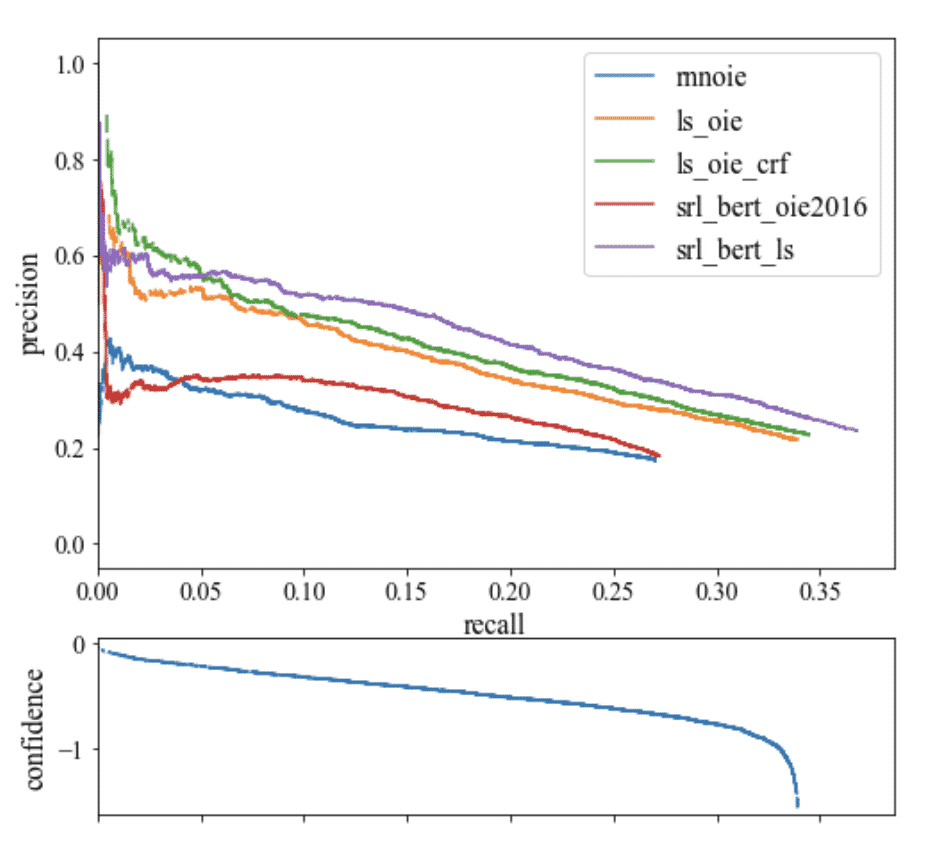
As the model is getting less confident, the curve is sloping downwards. If the model has an upward sloping precision and recall curve, the model likely has problems with its confidence estimation.
AI researchers love metrics and the whole precision-recall curve can be captured in single metrics. The first and most common is F1, which combines precision and recall measures to find the optimal confidence threshold where precision and recall produce the highest F1 value. Next, there is AUC (Area Under the Curve) which integrates the amount of the plot that falls underneath the precision and recall curve.
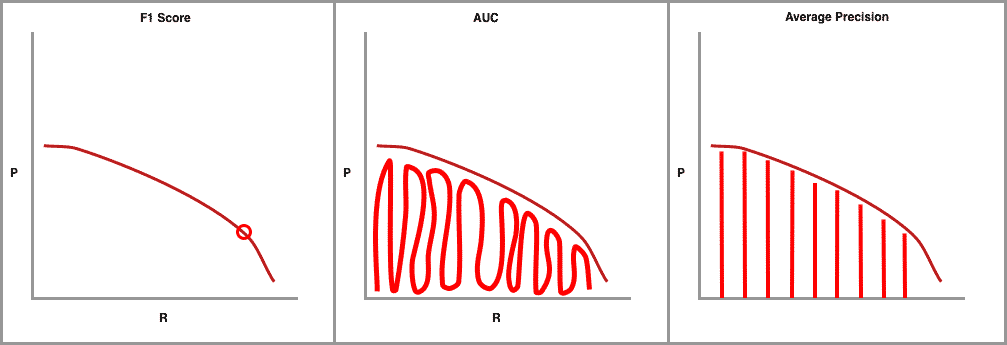
The final precision-recall curve metric is average precision (AP) and of most interest to us here. It is calculated as the weighted mean of precisions achieved at each threshold, with the increase in recall from the previous threshold used as the weight.
Both AUC and AP capture the whole shape of the precision recall curve. To choose one or the other for object detection is a matter of choice and the research community has converged on AP for interpretability.
Measuring Correctness via Intersection over Union
Object detection systems make predictions in terms of a bounding box and a class label.
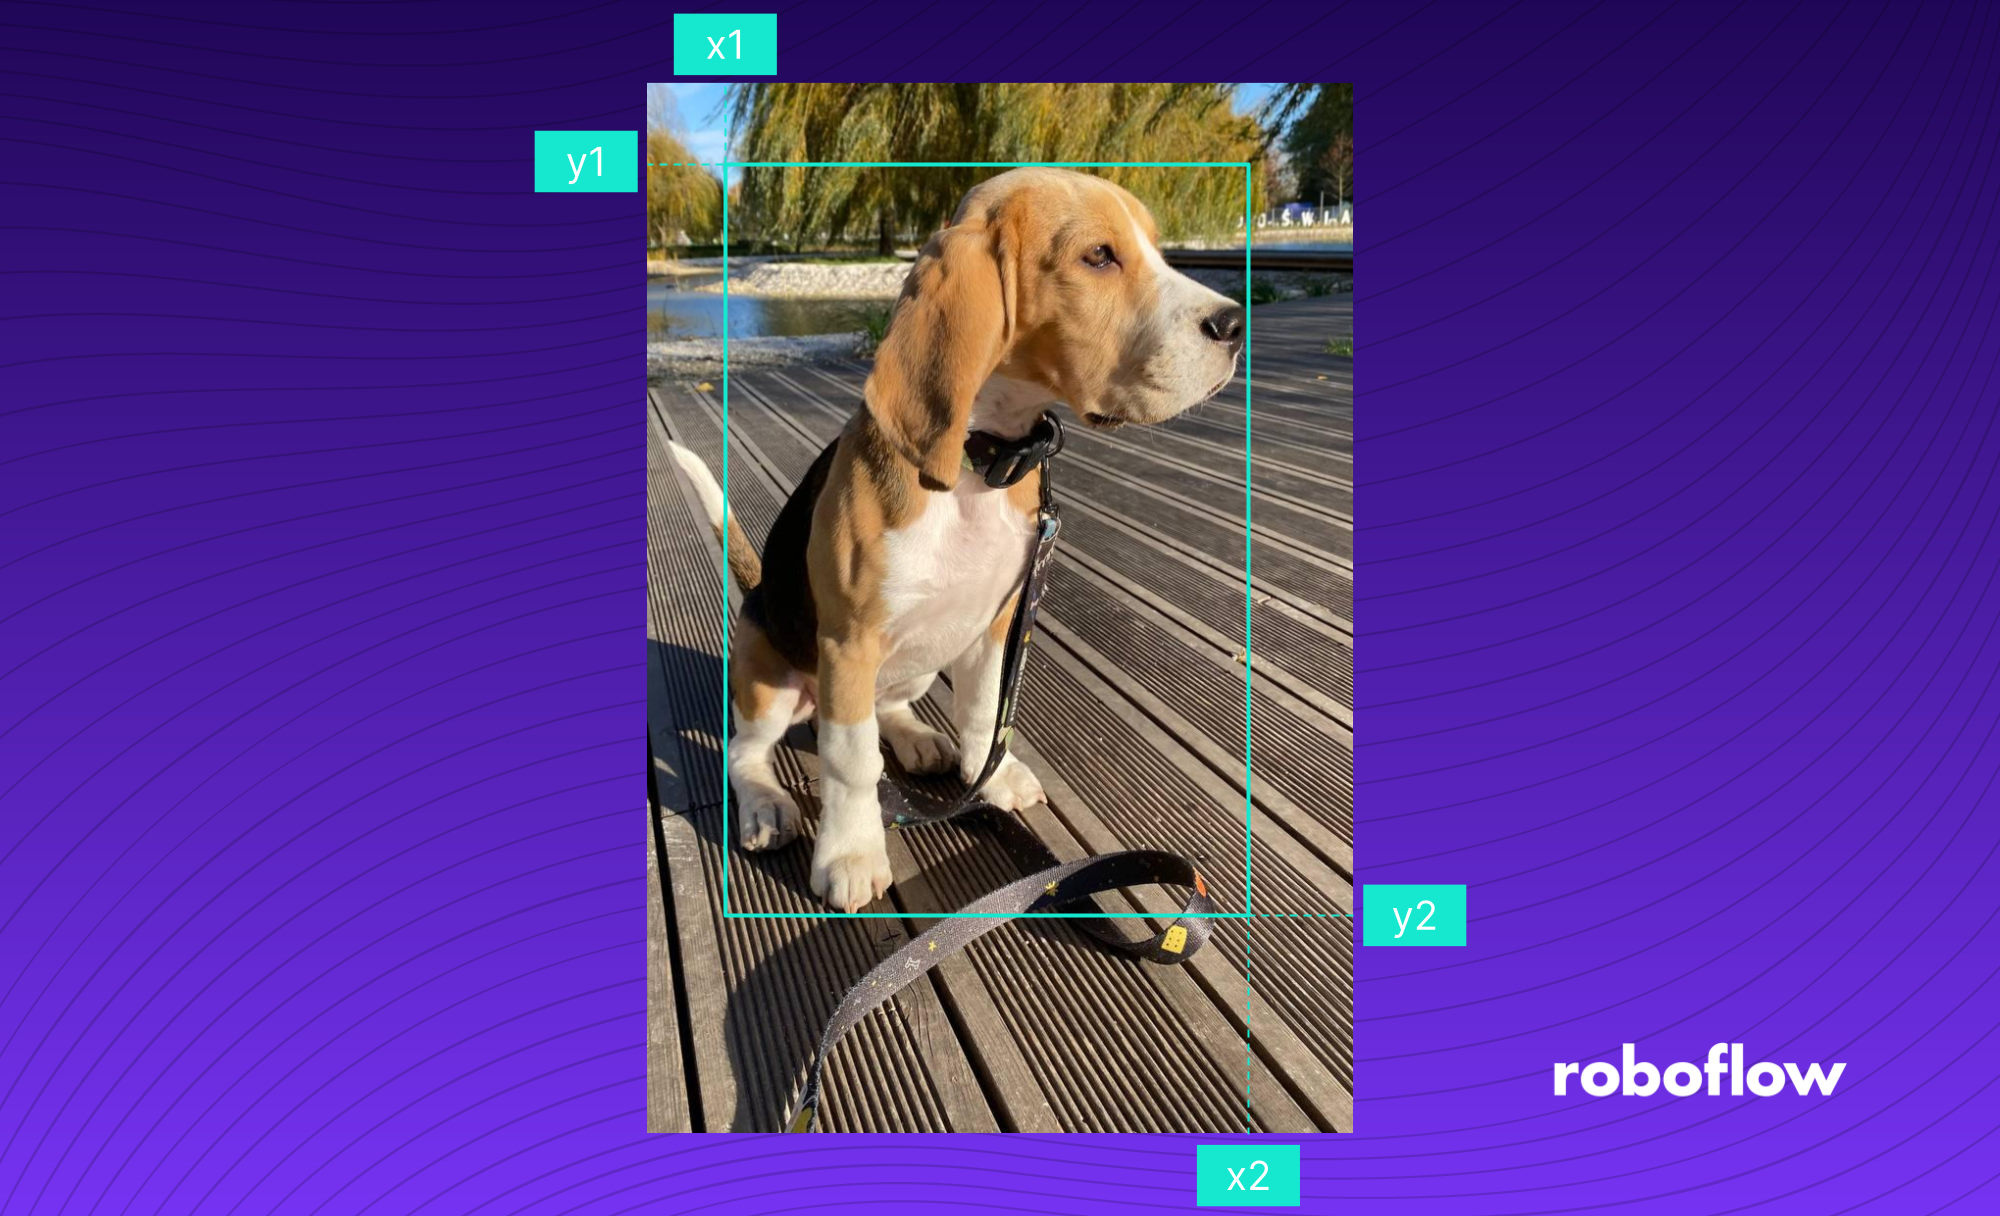
In practice, the bounding boxes predicted in the X1, X2, Y1, Y2 coordinates are sure to be off (even if slightly) from the ground truth label. We know that we should count a bounding box prediction as incorrect if it is the wrong class, but where should we draw the line on bounding box overlap?
The Intersection over Union (IoU) provides a metric to set this boundary at, measured as the amount of predicted bounding box that overlaps with the ground truth bounding box divided by the total area of both bounding boxes.
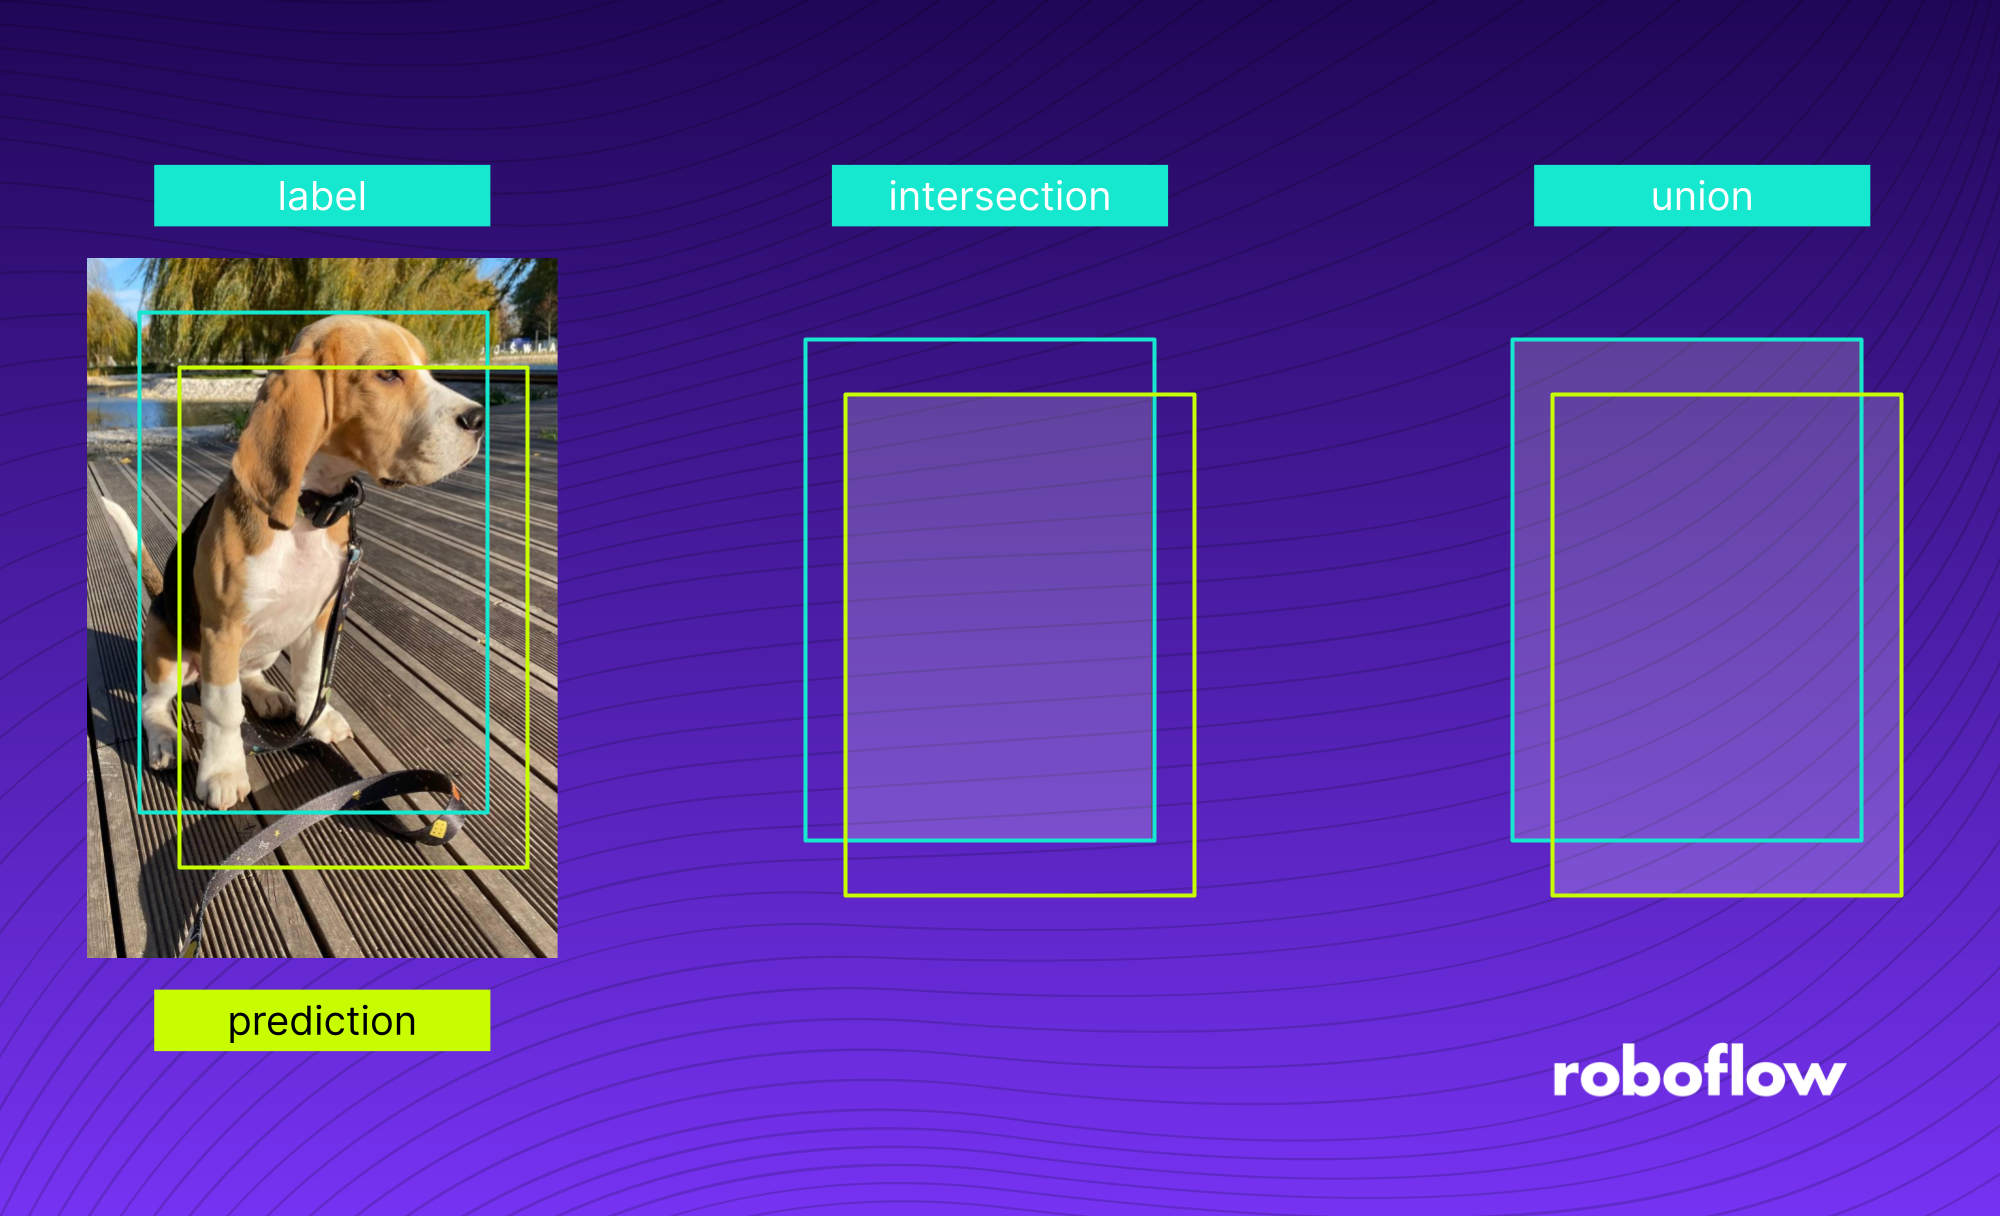
Picking the right single threshold for the IoU metric seems arbitrary. One researcher might justify a 60 percent overlap, and another is convinced that 75 percent seems more reasonable. So why not have all of the thresholds considered in a single metric? Enter mAP.
Drawing mAP precision-recall curves
In order to calculate mAP, we draw a series of precision recall curves with the IoU threshold set at varying levels of difficulty.
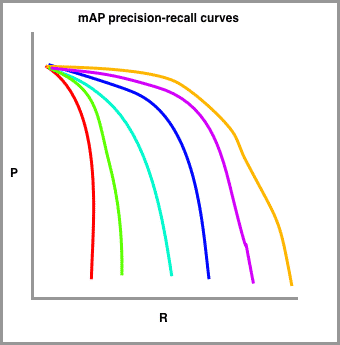
In my sketch, red is drawn with the highest requirement for IoU (perhaps 90 percent) and the orange line is drawn with the most lenient requirement for IoU (perhaps 10 percent). The number of lines to draw is typically set by challenge. The COCO challenge, for example, sets ten different IoU thresholds starting at 0.5 and increasing to 0.95 in steps of .05.
Almost there!
Finally, we draw these precision-recall curves for the dataset split out by class type.
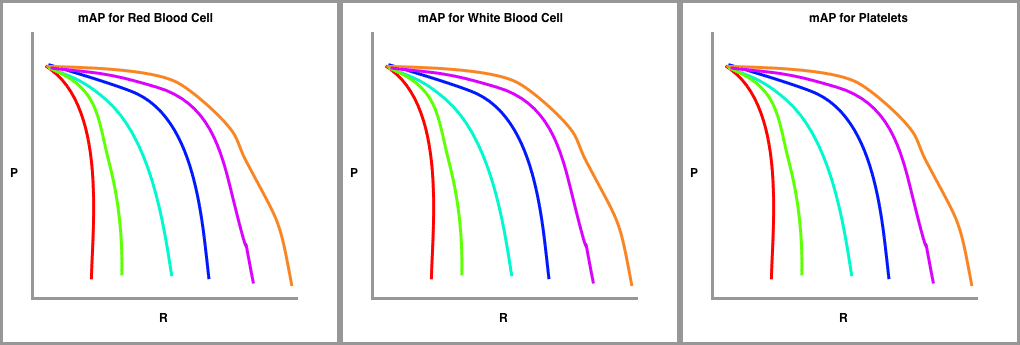
The metric calculates the average precision (AP) for each class individually across all of the IoU thresholds. Then the metric averages the mAP for all classes to arrive at the final estimate.
The mAP Formula: How to Calculate mAP
The first thing you need to do when calculating the Mean Average Precision (mAP) is to select the IoU threshold. We can choose a single value, for example, 0.5 (mAP@0.5), or a range, for example, from 0.5 to 0.95 with 0.05 increments (mAP@0.5:0.95). In the latter case, we calculate the mAP for each range value and average them.
Increasing the IoU threshold results in more restricted requirements - detections with lower IoU values will be considered false - and thus, the mAP value will drop.
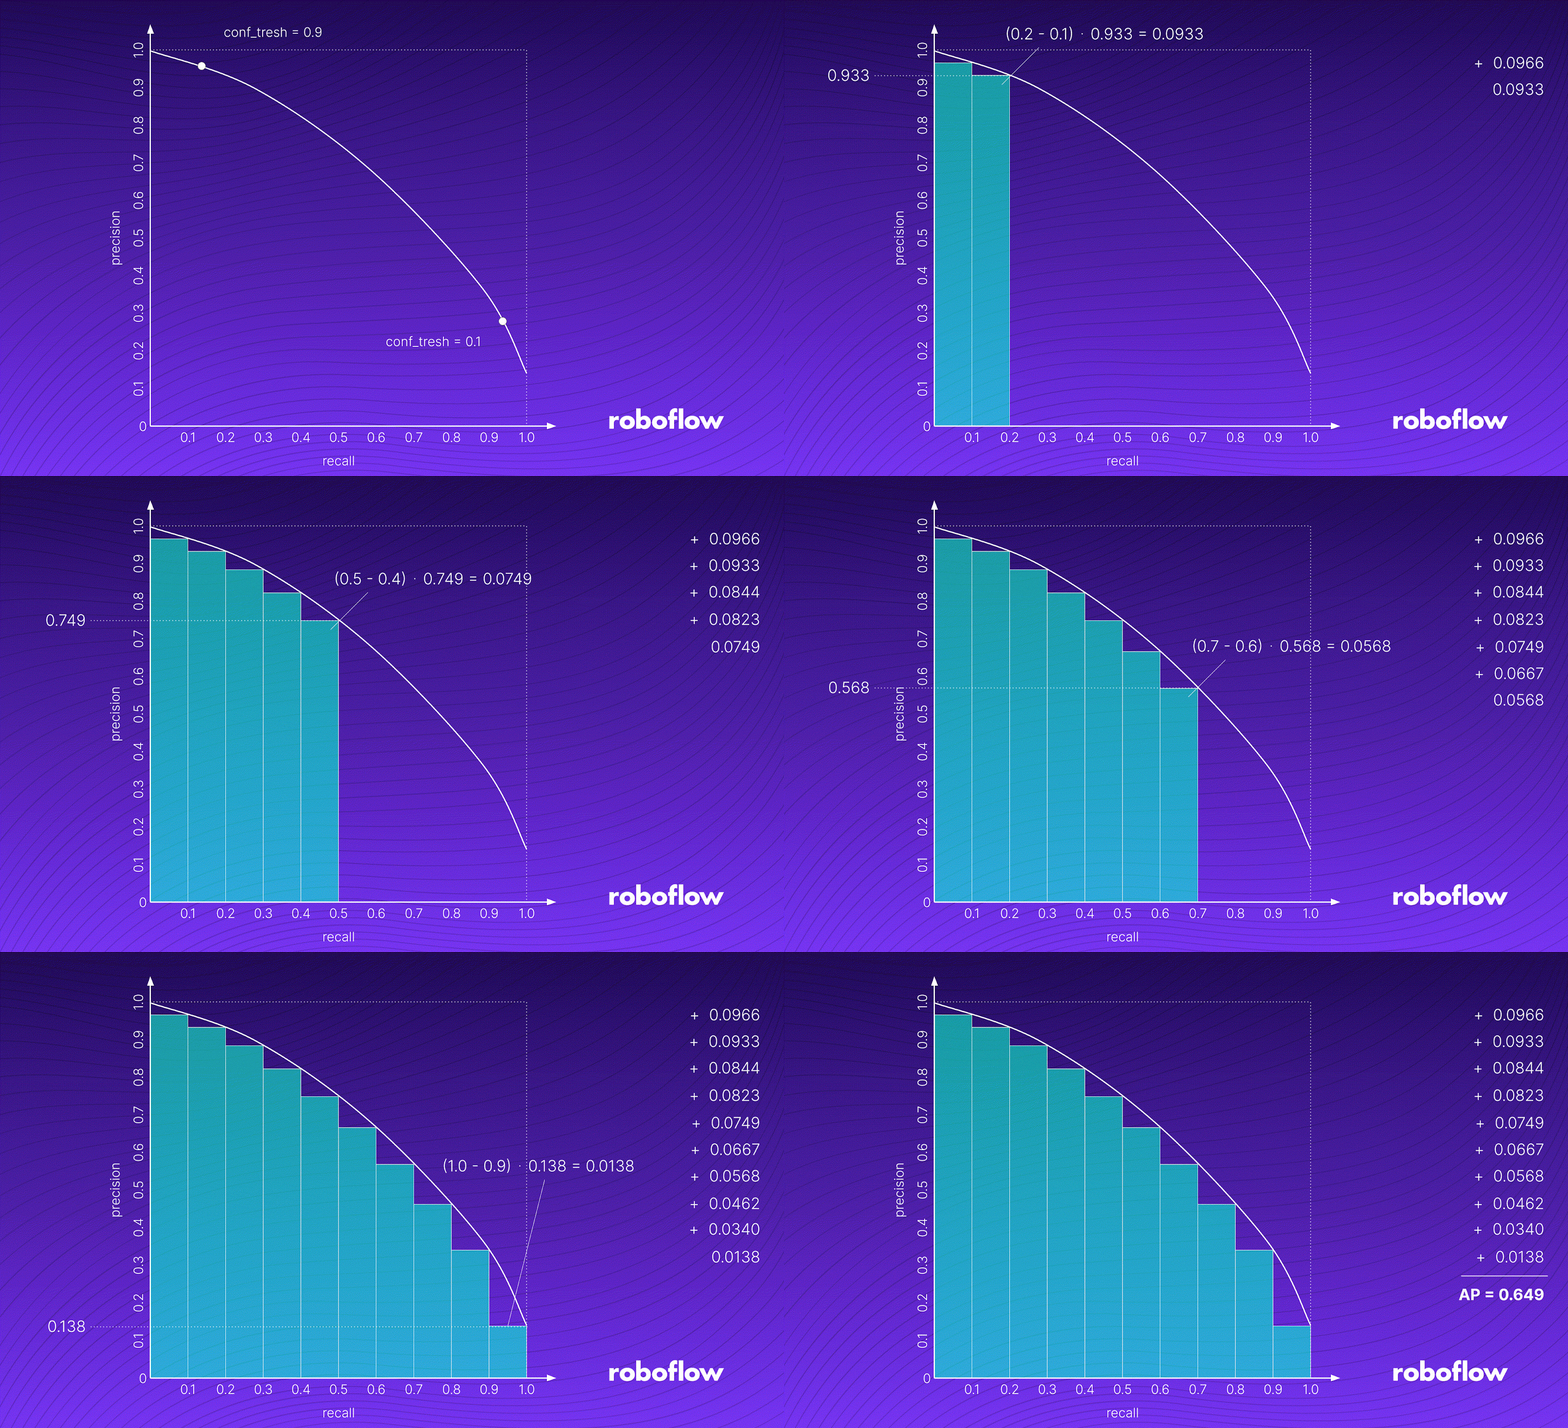
The image above shows the process of calculating an example AP value. First, we take a detection group and draw its PR curve. We do this by iteratively decreasing the confidence threshold from 1.0 to 0.0, calculating Precision [P] and Recall [R] for a given threshold value, and plotting the points on a graph.
AP is equal to the area of the green figure under the graph. It is calculated as the weighted mean of precisions achieved at each threshold, with the increase in recall from the previous threshold used as the weight.
The second thing we need to do is divide our detections into groups based on the detected class. We then compute the Average Precision (AP) for each group and calculate its mean, resulting in an mAP for a given IoU threshold.
If you are training locally, calculate mAP using the Roboflow Supervision package:
import supervision as sv
from rfdetr import RFDETRSmall
from PIL import Image

model = RFDETRsmall (pretrain_weights=output/checkpoint_best_regular.pth")

mean_average_precision = sv.MeanAveragePrecision.benchmark(dataset=sv.DetectionDataset.from_coco(images_directory_path="dataset/test", annotations_path=dataset/test/_annotations.coco.json"), callback=lambda image: model.predict(Image.fromarray(image), threshold=0.5))

print(f"mAP50: {mean_average_precision.map50:.3f}")
print(f"mAP50:95 {mean_average_precision.map50_95:.3f}")
The MeanAveragePrecision.benchmark method runs inference on every image in the test set and computes the final mAP score automatically. If you are using Roboflow Train, all of this is handled automatically with no evaluation code needed.
Using Mean Average Precision in Practice
To see mAP in action, we will train RF-DETR Small on the blood cell detection dataset using Roboflow Train. The dataset contains annotated images across three classes: RBC, WBC, and Platelets. Roboflow Train handles the entire training pipeline in the cloud with no local setup required.
Step 1: Create a Project
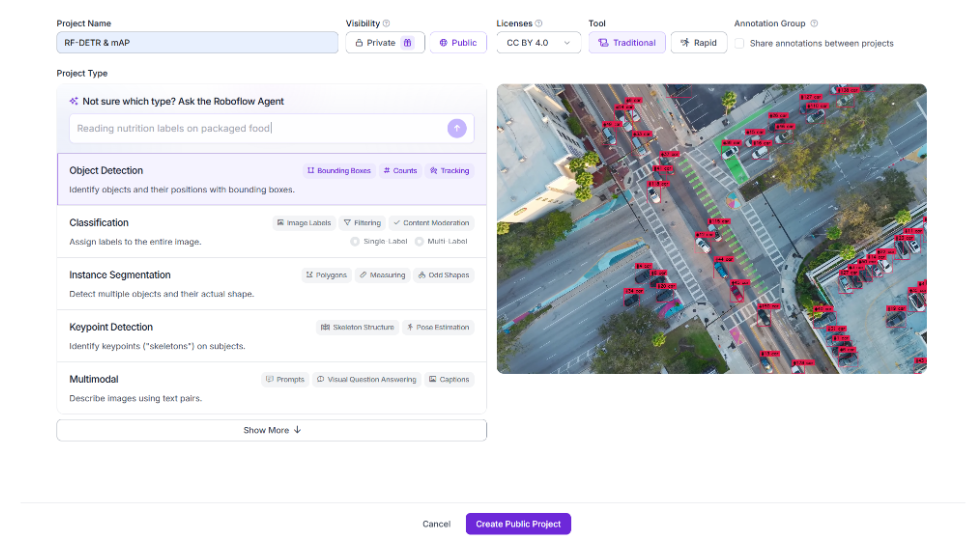
Go to the Roboflow app and create an account if you do not have one. Once logged in, look for Projects in the left sidebar and click Create New Project. Give your project a name and select Object Detection as the project type.
Step 2: Import the Dataset
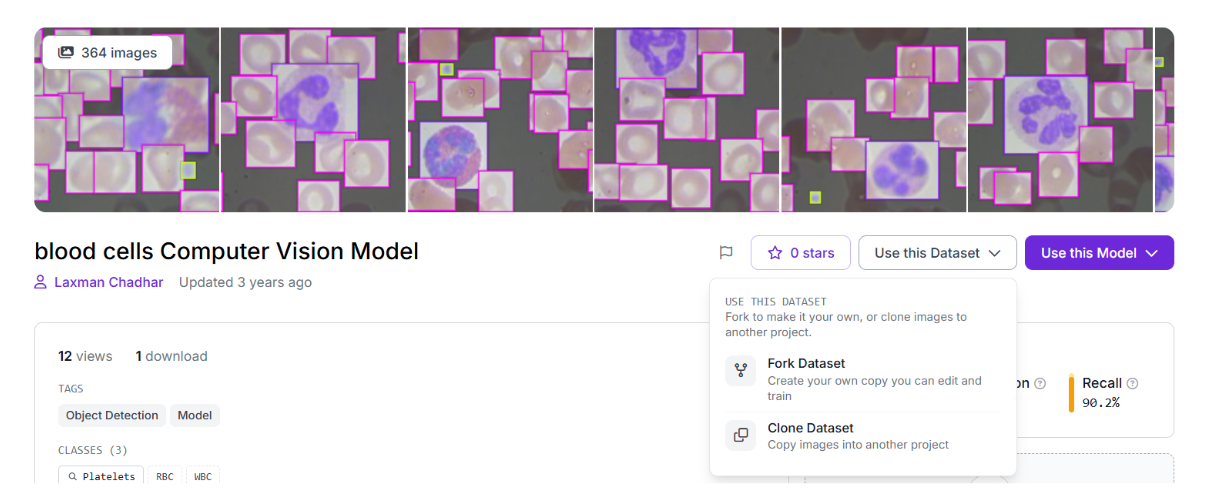
Once inside your project you will see an Upload screen. On the right side there is a Search on Roboflow Universe box. Type blood cell in the search field and press the arrow.

Select the blood cell dataset from the results. Click Use Dataset and select Fork Dataset. Make sure the dataset has annotations before forking.
Step 3: Start Training
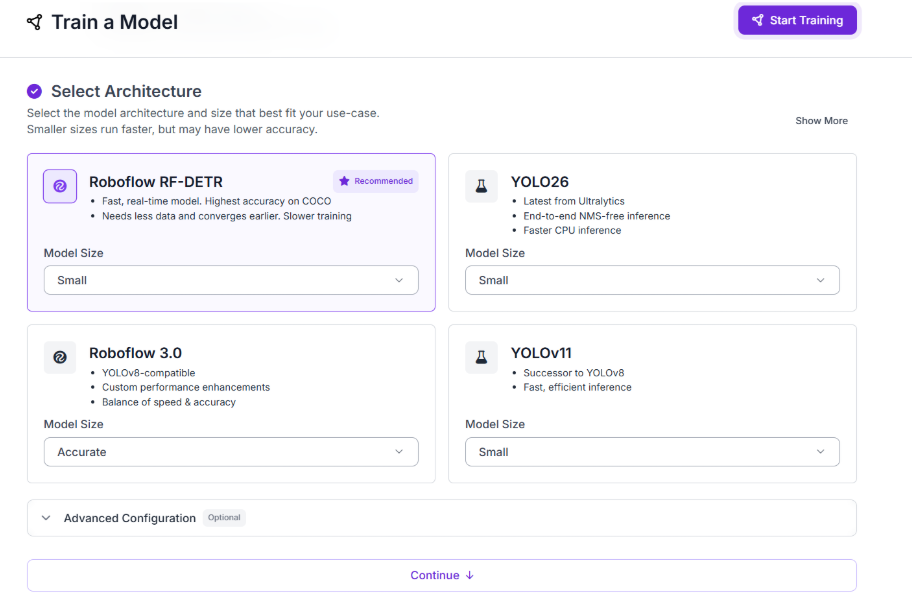
Inside your project, click Custom Training. Select Roboflow RF-DETR Small as the model, give your dataset version a name, and click Start Training. Roboflow provisions a GPU, runs the full training job, and logs every metric automatically. No local hardware needed at any point.
Step 4: Monitor Training
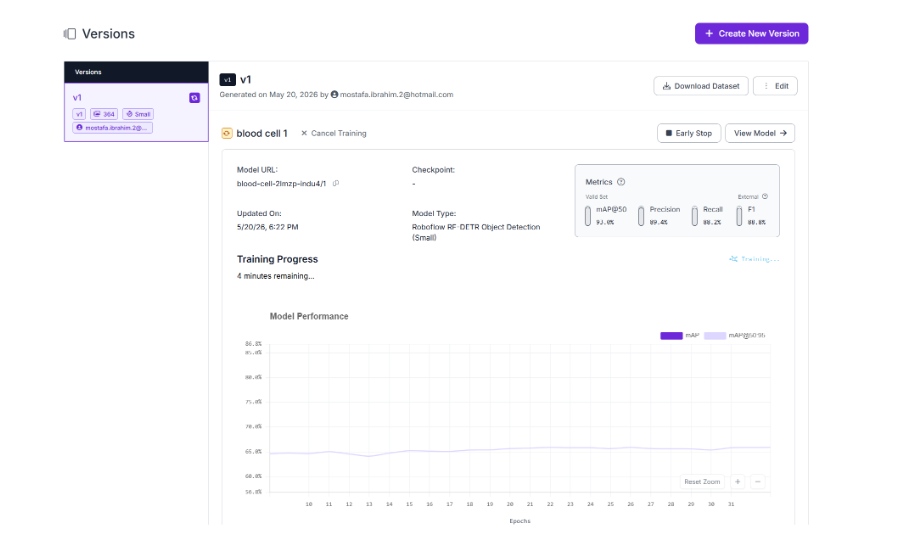
Head to the Models section in the left sidebar. Select your model and watch the training progress update in real time. Roboflow logs mAP, loss, precision, and recall after every epoch so you can see exactly how your model is improving.
Step 5: Read Your mAP Results
When training completes Roboflow displays a full metrics panel showing mAP50, mAP50:95, F1, Precision, Recall, loss curves, and per-class AP breakdown. Everything you need to evaluate your model is in one place, without writing a single line of evaluation code.
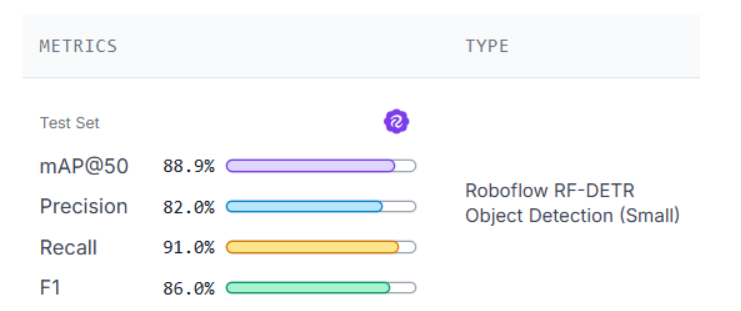
The per-class breakdown shows how the model performs on each class individually. WBC scores the highest at 97.0% mAP50 because white blood cells are large and visually distinct. RBC scores 89.0%, close to the overall average. Platelets score the lowest at 81.0%, reflecting the difficulty of detecting and localizing small objects precisely.

Roboflow also provides a Production Metrics Explorer that shows how precision, recall, and F1 shift across every confidence threshold for each class, helping you find the optimal confidence setting for your use case.
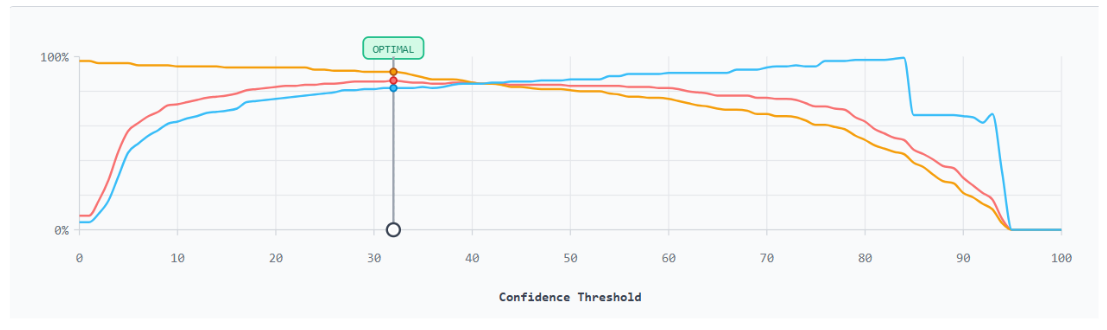
This curve shows how precision, recall, and F1 shift as the confidence threshold changes. The optimal point sits at 32%, where F1 peaks. Beyond that, recall drops while precision stays relatively stable until the model stops detecting altogether.
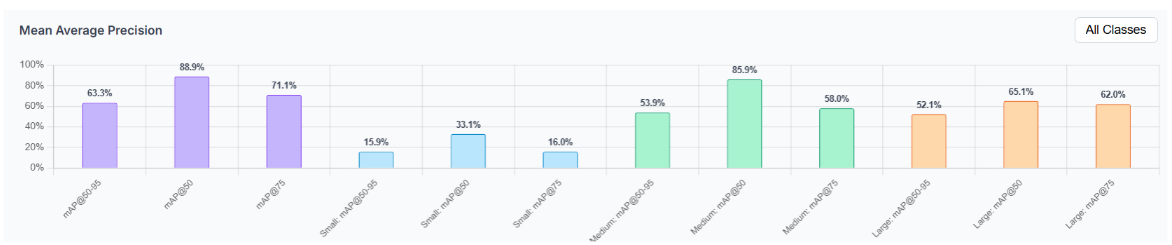
The mAP breakdown by object size reveals where the model struggles most. Small objects score only 33.1% mAP50, reflecting how difficult it is to localize tiny objects like Platelets precisely. Medium objects score the highest at 85.9% mAP50, covering most RBC detections. The gap between mAP50 (88.9%) and mAP50:95 (63.3%) confirms the model finds objects reliably but struggles with exact box placement as the IoU requirement tightens.
How to Calculate mAP Conclusion
mAP is the standard metric the computer vision community relies on to evaluate and compare object detection models. Understanding every component gives you the tools to interpret your results honestly and make informed decisions about where to improve.
To improve your mAP, start with your data. More annotated images, tighter bounding boxes, and better class balance will move the needle more than any hyperparameter change. Roboflow Annotate and Roboflow Universe are good starting points for both.
Further reading:
- How to Train RF-DETR on a Custom Dataset
- RF-DETR: A SOTA Real-Time Object Detection Model
- What is Precision and Recall in Computer Vision
- How to Evaluate a Computer Vision Model
Additional mAP Information
What is mAP used for?
mAP is used to compare the performance of computer vision models. mAP gives computer vision developers a single primary metric on which to compare that encompasses both the precision and recall of a model. Later comparisons may be made on other metrics to better evaluate a model.
What does a high mAP mean?
A high mAP means that a model has both a low false negative and a low false positive rate. The higher the mAP, the more precise and the higher the recall is for your model. Computer vision engineers aim to improve mAP as they build models.


Cite this Post
Use the following entry to cite this post in your research:
Jacob Solawetz. (May 1, 2026). What is Mean Average Precision (mAP) in Object Detection?. Roboflow Blog: https://blog.roboflow.com/mean-average-precision/