
This article was contributed to the Roboflow blog by Abirami Vina.
When you are building computer vision systems, there are several metrics you can use to evaluate the effectiveness of a system.
One widely-used metric is F1 score. F1 score combines precision and recall into a single value. A model’s F1 score is especially useful when false positives and negatives must be avoided.
For example, think about a medical imaging system used for diagnosing diseases. False positives could lead to unnecessary treatments, causing stress and potential harm to patients, while false negatives might result in missed crucial treatments. A high F1 score tells us that the model effectively identifies true cases with few errors and can be used in medical settings.
In this article, we'll explore the F1 score, how it’s calculated, its significance for your computer vision model, and its strengths and limitations in real-world applications. Let's get started!
An Introduction to Precision and Recall
Before we go in-depth into the F1 score, we need to learn about precision and recall. To understand their formulas, let’s introduce a confusion matrix. A confusion matrix summarizes the results of the model’s predictions on a set of data, comparing the predicted labels to the actual labels.
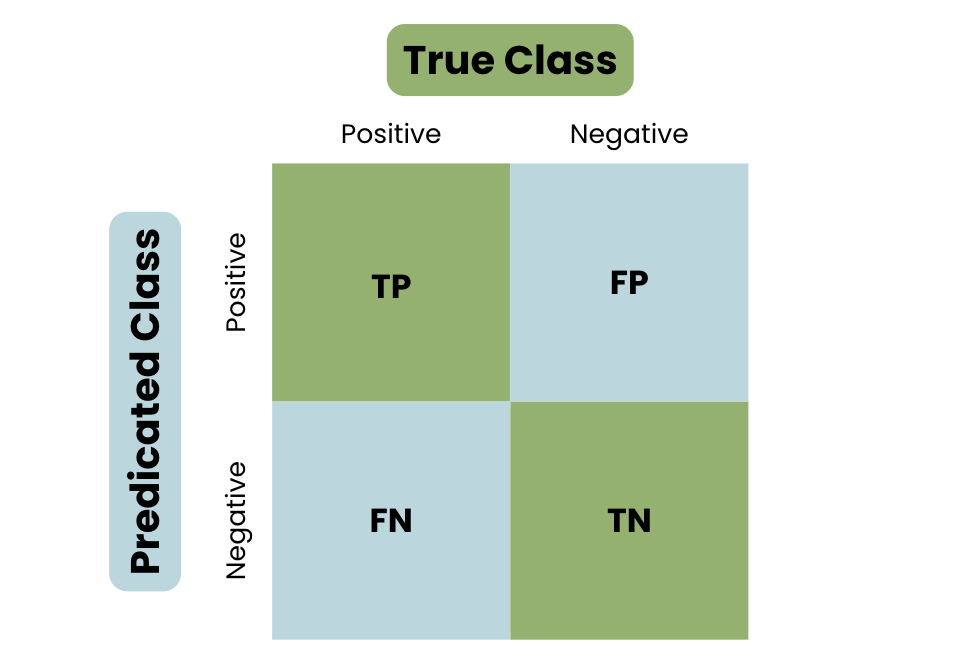
The four components of a confusion matrix are:
- True Positive (TP): The number of instances correctly predicted as positive by the model.
- False Positive (FP): The number of instances incorrectly predicted as positive by the model.
- True Negative (TN): The number of instances correctly predicted as negative by the model.
- False Negative (FN): The number of instances incorrectly predicted as negative by the model.
Precision measures how accurate a model is at identifying positive cases. It focuses on the proportion of correctly identified positive objects (like an apple in an image) and avoids false positives (mistakenly identifying an orange as an apple). This helps evaluate the model's overall ability to distinguish relevant objects from irrelevant ones.
Here is the formula for calculating Precision:
Precision = True Positives (TP) / (True Positives (TP) + False Positives (FP))
Recall, on the other hand, focuses on how well a model captures all the positive cases. It considers both correctly identified positive objects (like finding all apples in an image) and those the model missed (like failing to detect an apple). When evaluating missing positive instances, like detecting a thief using a security system, a model’s recall should be high.
Here is the formula for calculating Recall:
Recall = True Positives (TP) / (True Positives (TP) + False Negatives (FN))
Now that we’ve understood precision and recall, let’s dive into the F1 score metric.
What is an F1 Score?
An F1 score is a valuable metric for assessing a model's performance because it incorporates the trade-off between precision and recall. The basic concept of the F1 Score is that it’s the measure of the harmonic mean of both precision and recall. The value of the F1 Score lies between 0 and 1, with one being the best.
The formula for F1 score is:
F1 Score = 2 * (Precision * Recall) / (Precision + Recall)
Calculate F1 Score For Your Model
Now that we’ve learned what the F1 Score is, let’s learn how to compute it step by step with an example.
Binary Classification
Step 1: You are creating a computer vision model to determine if an image has an apple or an orange in it. You have a model and want to evaluate its performance using the F1 score. You pass 15 images with apples and 20 images with oranges to the model. From the given 15 apple images, the algorithm predicts 9 pictures as the orange ones, and from the 20 orange images - 6 pictures as the apple ones.
Step 2: Let’s consider apple images as the positive class and orange images as the negative ones.
- Out of 15 Apple images (P), 9 were predicted as oranges. So only 15 - 9 = 6 predictions were correct. True Positive (TP) = 6.
- Even though 9 were predicted as oranges, they had apples on them. So, False Negative (FN) = 9
- Similarly, out of 20 Orange images (N), only 20 - 6 = 14 predictions were correct. True Negative (TN) = 14.
- Even though 6 were predicted as apples, they had oranges on them. So, False Positive (FP) = 6
Step 3: Let’s put this data into a confusion matrix to visualization it better.
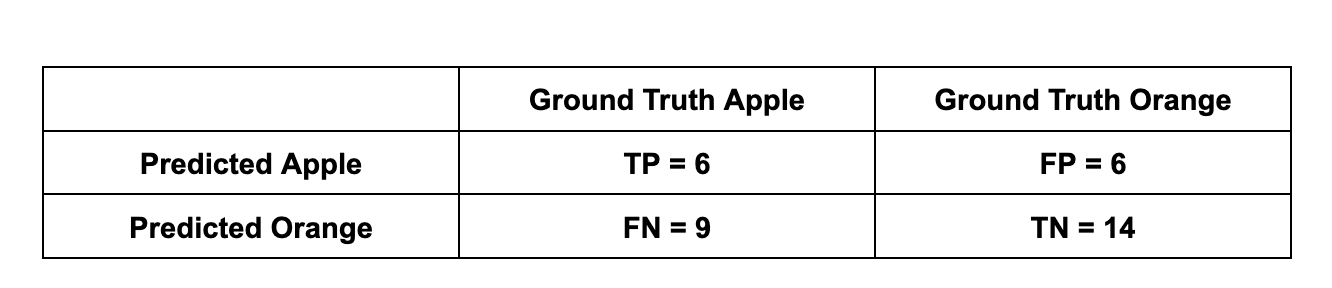
Step 4: Now, let’s calculate the precision and recall values.
Precision = (TP) / (TP + FP) = (6) / (6 + 6) ~ 0.5
Recall = (TP) / (TP + FN) = (6) / (6 + 9) ~ 0.4
Step 5: Using the values calculated above, compute the F1 Score.
F1 score = 2 * (Precision * Recall) / (Precision + Recall) = 2 * (0.5 * 0.4) / (0.5 + 0.4) ~ 0.44
We have arrived at an F1 score of 0.44 for the model. This is for binary classification.
Now, let’s take a look at an example of calculating the F1 score for multiclass scenarios. There are three approaches to calculating the F1 score for a multiclass case: Macro, Micro, and Weighted. We’ll go through each.
Multiclass Classification
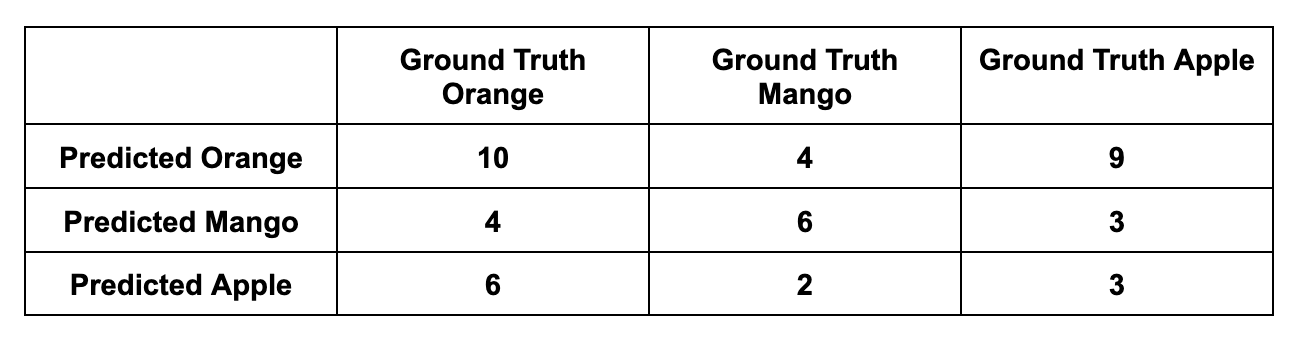
Let’s add another class to our example: Mangoes. Let’s say you pass 15 images with apples, 20 images with oranges, and 12 images with mangoes to the model. The predictions are as follows:
- 15 apple images: 9 as oranges, 3 as mangoes, and 15 - 9 - 3 = 3 as apples.
- 20 orange images: 6 as apples, 4 as mangoes, and 20 - 6 - 4 = 10 as oranges.
- 12 mango images: 4 as oranges, 2 as apples, and 12 - 4 - 2 = 6 as mangoes.
Macro F1 Score
Macro F1 score is a way to study the multiclass classification as a whole. To calculate the Macro F1 score, you can compute the Macro Precision and the Macro Recall and then use the F1 score formula. This approach treats all the classes equally as it aims to see the bigger picture and evaluate the algorithm’s performance across all the classes in one value.
Let’s see how it is calculated:
Orange Precision: 10 / (4 + 9 + 10) ~ 0.43
Mango Precision: 6 / (4 + 3 + 6) ~ 0.46
Apple Precision: 3 / (6 + 2 + 3) ~ 0.27

Macro Precision score: (Orange Precision + Mango Precision + Apple Precision) / 3 = (0.43 + 0.46 + 0.27) / 3 ~ 0.386

Orange Recall: 10 / (4 + 6 + 10) ~ 0.5
Mango Recall: 6 / (4 + 2 + 6) ~ 0.5
Apple Recall: 3 / (9 + 3 + 3) ~ 0.2

Macro Recall score: (Orange Recall + Mango Recall + Apple Recall) / 3 = (0.5 + 0.5 + 0.2) / 3 ~ 0.4

Macro F1 score =
2 * (Macro Precision * Macro Recall) / (Macro Precision + Macro Recall) = 2 * (0.386 * 0.4) / (0.386 + 0.4) ~ 0.392
Micro F1 Score
Unlike the Macro F1 score, the Micro F1 score studies individual classes. To calculate it, you can compute Micro Precision and Micro Recall and then use the F1 score formula. The Micro F1 score will combine the contributions of all classes to calculate the average metric.
Let’s see how this one is calculated:
Micro Precision score: (TP Orange + TP Mango + TP Apple) / ((TP + FP) Orange + (TP + FP) Mango + (TP + FP) Apple) = (10 + 6 + 3) / ((4 + 9 + 10) + (4 + 3 + 6) + (6 + 2 + 3)) ~ 0.4

Micro Recall score: (TP Orange + TP Mango + TP Apple) / ((TP + FN) Orange + (TP + FN) Mango + (TP + FN) Apple) = (10 + 6 + 3) / ((4 + 6 + 10) + (4 + 2 + 6) + (9 + 3 + 3)) ~ 0.404

Micro F1 score = 2 * (Micro Precision * Micro Recall) / (Micro Precision + Micro Recall) = 2 * (0.4 * 0.404) / (0.4 + 0.404) ~ 0.401
Weighted F1 Score
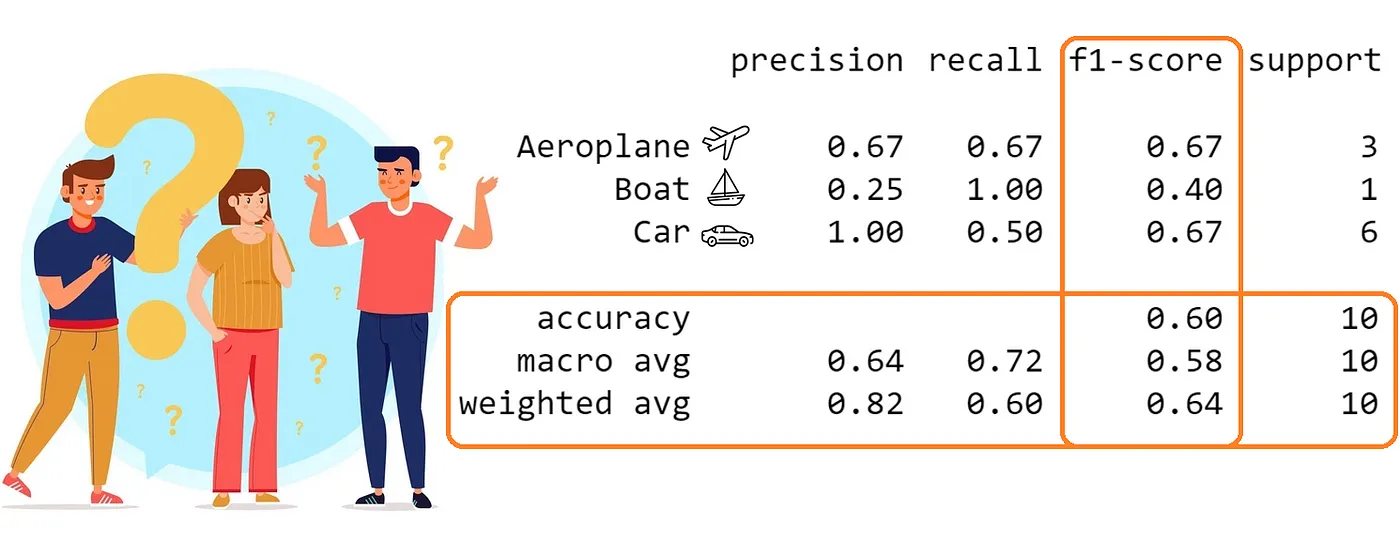
The weighted F1 score calculates the F1 score for each class independently, but when it averages them, it uses a weight that depends on the number of true instances (support) for each class.
Let’s see how the weighted F1 score is calculated:
Step #1: Calculate Precision and Recall for each class
Orange:
Precision = TP / (TP + FP) = 10 / (10 + 4 + 9) = 10 / 23 ≈ 0.435
Recall = TP / (TP + FN) = 10 / (10 + 4 + 6) = 10 / 20 = 0.5
Mango:
Precision = TP / (TP + FP) = 6 / (6 + 4 + 3) = 6 / 13 ≈ 0.462
Recall = TP / (TP + FN) = 6 / (6 + 4 + 2) = 6 / 12 = 0.5
Apple:
Precision = TP / (TP + FP) = 3 / (3 + 6 + 2) = 3 / 11 ≈ 0.273
Recall = TP / (TP + FN) = 3 / (3 + 9 + 3) = 3 / 15 = 0.2
Calculate the F1 score for each class:
Orange:
F1 = 2 * (Precision * Recall) / (Precision + Recall) = 2 * (0.435 * 0.5) / (0.435 + 0.5) ≈ 0.465
Mango:
F1 = 2 * (Precision * Recall) / (Precision + Recall) = 2 * (0.462 * 0.5) / (0.462 + 0.5) ≈ 0.480
Apple:
F1 = 2 * (Precision * Recall) / (Precision + Recall) = 2 * (0.273 * 0.2) / (0.273 + 0.2) ≈ 0.231
Calculate the Weighted F1 Score with true instances(support) of each class:
Support for Orange = 20
Support for Mango = 12
Support for Apple = 15
Weighted F1 = (F1_Orange * Support_Orange + F1_Mango * Support_Mango + F1_Apple * Support_Apple) / (Support_Orange + Support_Mango + Support_Apple)
Weighted F1 = (0.465 * 20 + 0.480 * 12 + 0.231 * 15) / (20 + 12 + 15) = (9.3 + 5.76 + 3.465) / 47 ≈ 18.525 / 47 ≈ 0.394
Advantages and Limitations of F1 Score
Since the F1 Score is a balanced metric, it is perfect for imbalanced datasets, where one class of observations significantly outweighs the other. In such cases, accuracy alone can be misleading, as a model that simply predicts the majority class can achieve a high accuracy score. The F1 score, by considering both precision and recall, provides a more robust evaluation metric.
Another advantage of using the F1 Score is that it can be used to compare and choose models that strike the right balance between precision and recall, depending on the specific requirements of the application. For example, in a fraud detection system, precision may be more important, as false positives can be costly. On the other hand, in a spam email classification system, the recall may be more important, as missing positive instances can have severe consequences.
Here are some limitations that also need to be considered when calculating the F1 score for a model:
- Unequal Cost of Errors: The F1 score assumes equal importance for precision and recall. This might not be ideal in situations where some mistakes are far more critical than others.
- Limited Information: It provides a single value, which can be a drawback. It doesn't reveal details about the distribution of errors (e.g., how many false positives vs. negatives).
- Ignores True Negatives: This metric focuses on correctly classifying positive instances and capturing all relevant ones. However, it doesn't consider true negatives, which can be important in some scenarios where identifying irrelevant cases is crucial.
Conclusion
The F1 score lets you understand a computer vision model’s performance beyond it’s basic accuracy. By balancing precision and recall, it grants a clearer picture of a model's real-world effectiveness. So, while the F1 score might not be the only metric on your dashboard, it's a powerful tool for unlocking deeper insights into your model's true capabilities.
See Also
- Learn more about precision and recall in machine learning.
- An article on Mean Average Precision (mAP) in object detection.
- A guide on how to evaluate computer vision models with CVevals.