
This tutorial builds an end-to-end baseball telemetry pipeline that processes game footage into structured player and ball movement coordinates. RF-DETR handles per-frame detection of the ball, bat, players, and equipment, and OC-SORT provides the tracking layer that maintains object identity across frames even at ball speeds above 160 km/h. The full pipeline, including 30-frame motion traces and bounding box visualization, is assembled as a Roboflow Workflow and can be configured in seconds using the Roboflow Agent from a plain-language description.
Implementing computer vision within baseball analytics presents spatial and speed challenges. Tracking a baseball traveling at speeds upwards of 160 km/h requires exceptional resolution and frame-by-frame reliability. The tracking infrastructure must accurately locate and monitor a sphere moving across vast stadium backdrops.
Missing a prediction during a pitch, a high-velocity line drive, or a fast play at the plate breaks the continuous motion history. This gap reduces the fidelity of telemetry data required by modern sports scientists, player development teams, and broadcast networks.
Historically, capturing player mechanics and ball telemetry demanded tedious manual tracking or cost-prohibitive custom hardware arrays. Transitioning to automated vision architectures allows organizations to implement cost-effective pipelines that supply instant and verified statistics.
This technical guide covers the end-to-end creation of a baseball telemetry prototype that processes game footage into structured movement coordinates using the Roboflow platform.
How to Automate Baseball Tracking with Roboflow
Step 1: Setting Up the Workspace
Begin by setting up a workspace on the Roboflow Dashboard. New users can establish a free account to coordinate imagery datasets, compile custom neural networks, and manage model iterations within a consolidated developer environment.
Step 2: Gathering Baseball Imagery
The real-world precision of an object detection architecture relies entirely on a training foundation that mimics the deployment environment. For diamond sports like baseball, Roboflow Universe delivers an expansive library of open-source datasets capturing varied lighting conditions, stadium dimensions, and field geometries.
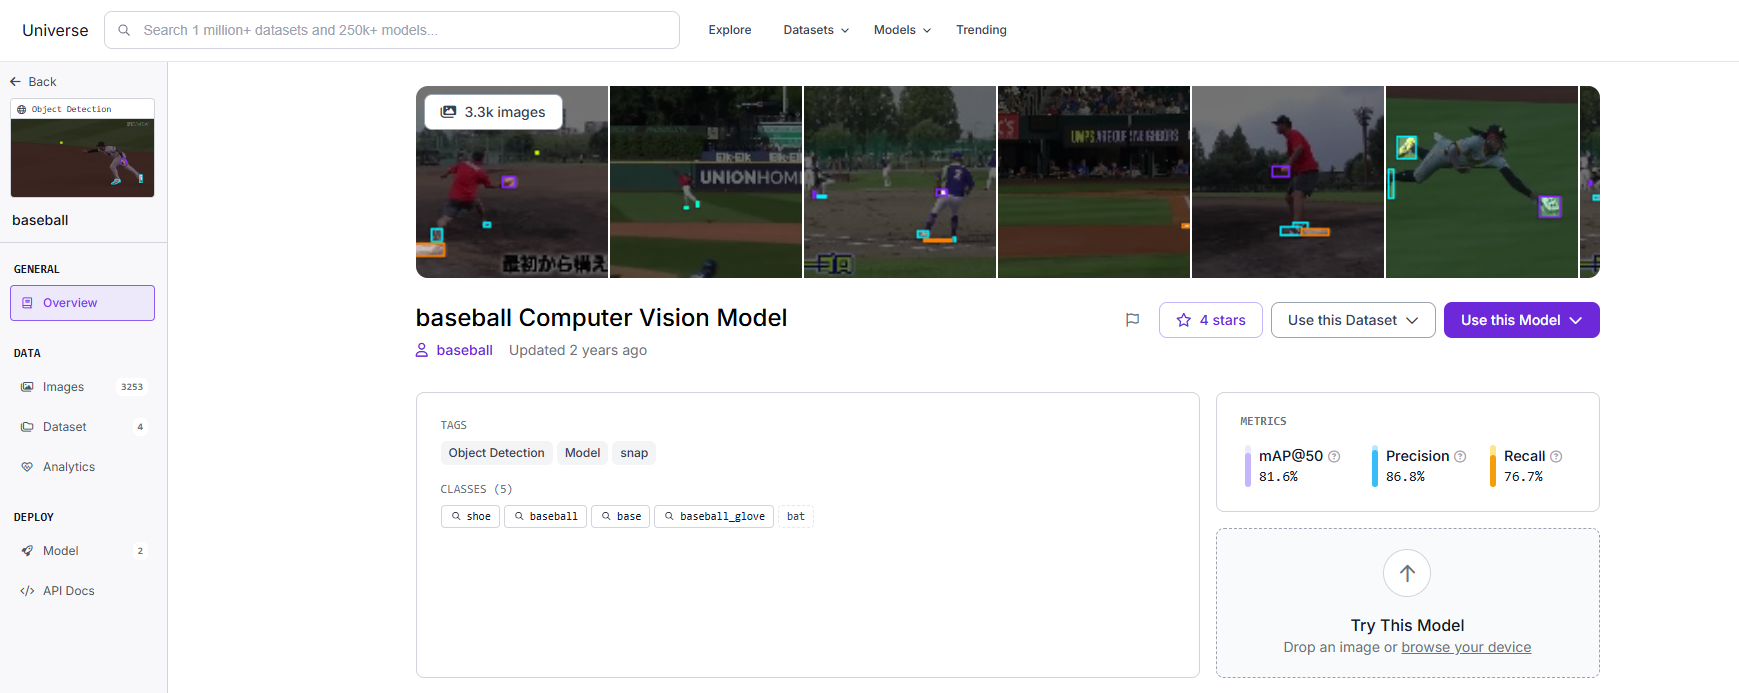
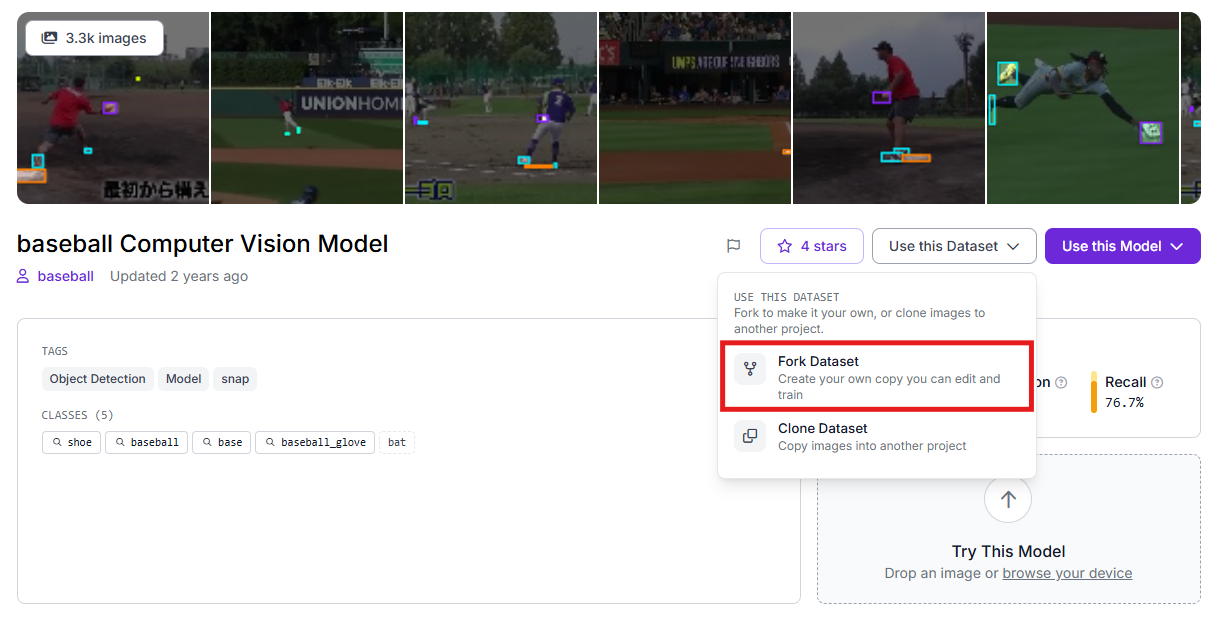
Once you isolate a high-quality baseline dataset, employ the platform's duplication tools to copy those source images into your private development environment for custom tuning.
Step 3: Dataset Labeling and Curation
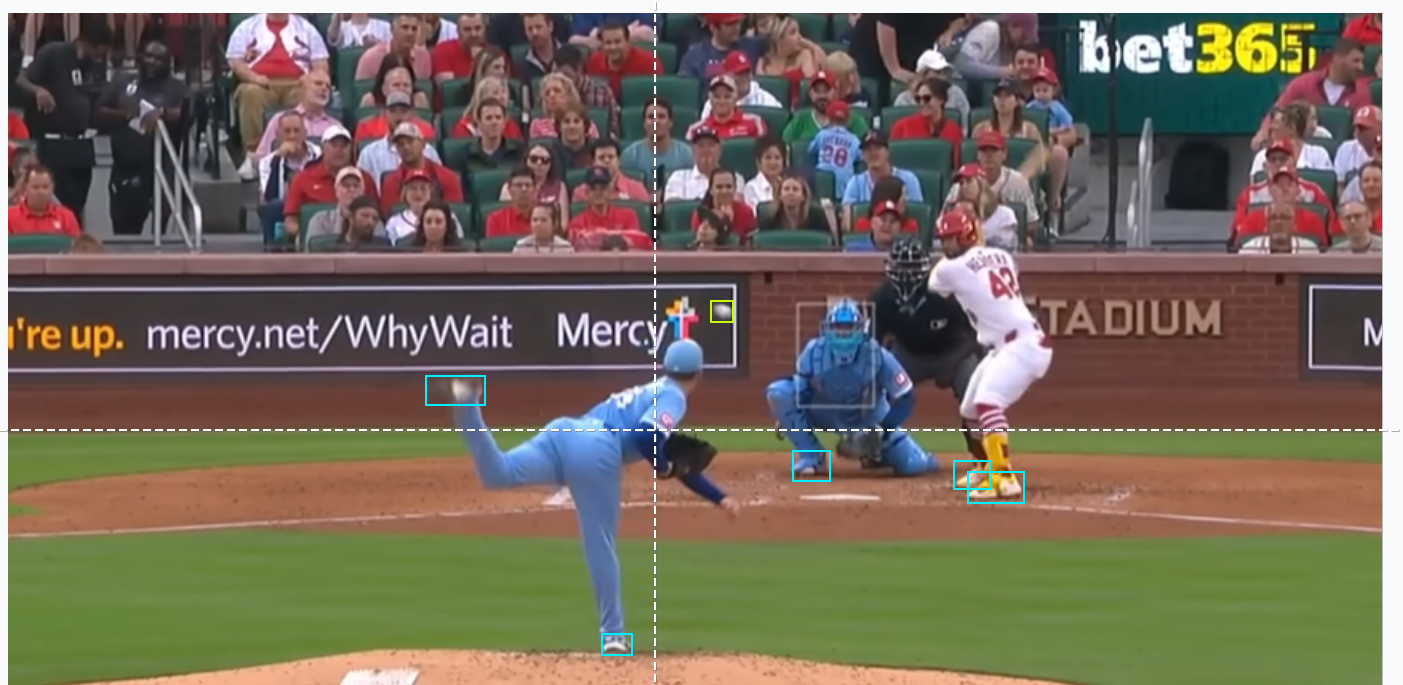
When using raw footage captured from local training facilities or broadcast feeds, you can use Roboflow Annotate to isolate your targets. Creating accurate bounding geometries around the ball, bat, gloves, players' shoes, and bases trains the network to differentiate high-speed motion blur from stadium crowd noise and complex turf backgrounds.
Step 4: Deploying the RF-DETR Neural Network Architecture
This project utilizes the RF-DETR (Real-time Flat Detection Transformer) architecture. This transformer-centric framework provides exceptionally low processing latency, maintaining the quality required to parse lightning-fast sports sequences.
To initiate the training process:
- Navigate to the "Train" section of your project.
- Initialize a training run using the Roboflow RF-DETR Object Detection (Small) variant.
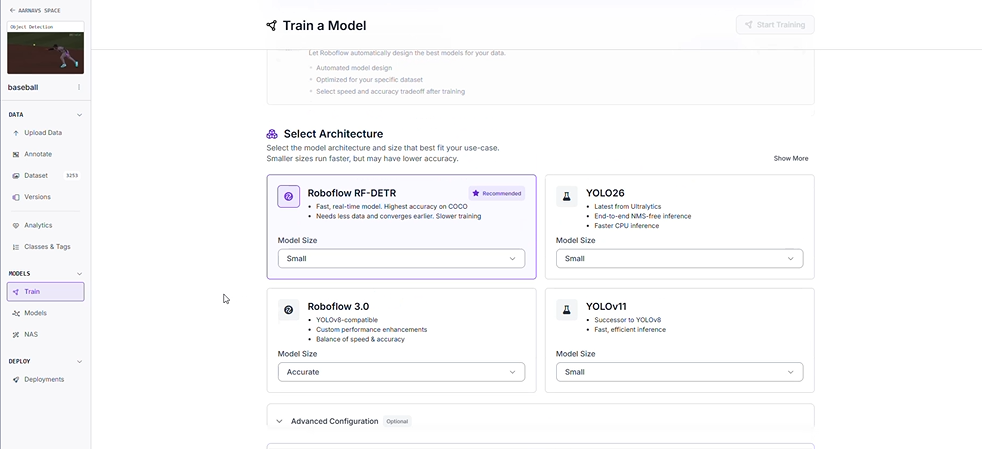
Why Deploy the Small RF-DETR Variant?
- High-Throughput Processing: Elite athletic movements require high frame-per-second processing capabilities. This model parses video data fast enough to facilitate live field telemetry.
- Decentralized Execution: The streamlined model footprint runs efficiently on localized edge devices, removing the necessity for continuous cloud infrastructure during live tournament play.
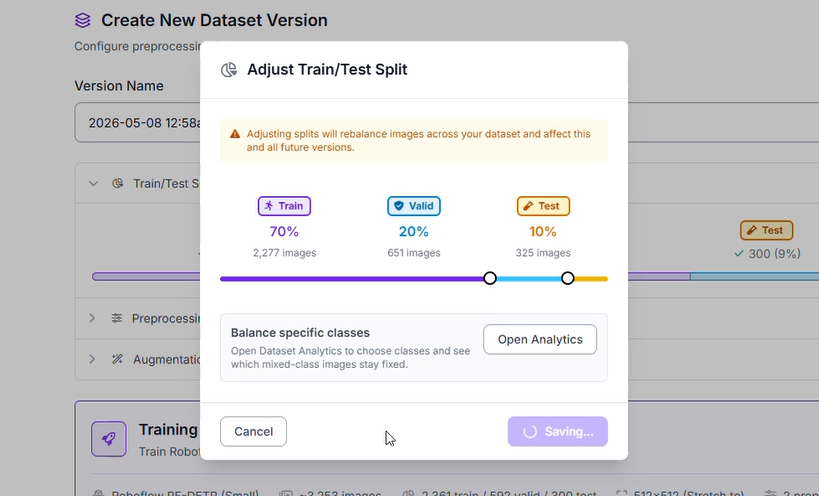
Step 5: Dataset Segmentation
To ensure the neural network generalizes effectively across unfamiliar ballparks and baseball layouts, the imagery pool is split into specialized groups:
- Training Set (70%): Supplies the primary baseline examples for the network to understand visual patterns of bats, gloves, bases, and balls.
- Validation Set (20%): Provides an intermediate verification checkpoint during training loops to verify the network is learning features rather than memorizing images.
- Testing Set (10%): Reserves a completely isolated segment of baseball footage to provide an objective final quality assessment.
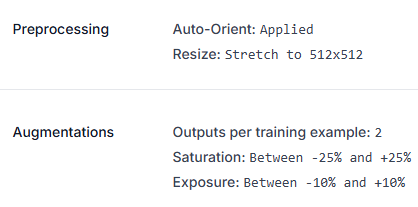
Step 6: Image Transformations and Enhancements
To reinforce model stability against intense afternoon glare and shifting stadium shadows, specific image preprocessing and augmentation strategies were applied:
- Orientation Correction: Auto-Orient settings were applied to normalize input feeds.
- Spatial Standardization: Inputs were forced into a uniform 512x512 resolution using a stretch configuration.
- Dataset Factorization: The training asset pool was multiplied by a factor of 2 via specialized augmentations.
- Color Temperature Fluctuations: Saturation levels were modulated between -25% and +25% to prepare the network for varied field color profiles.
- Illumination Variability: Exposure settings were modified within a -10% to +10% threshold, training the detector to handle harsh stadium light towers or overcast weather conditions.
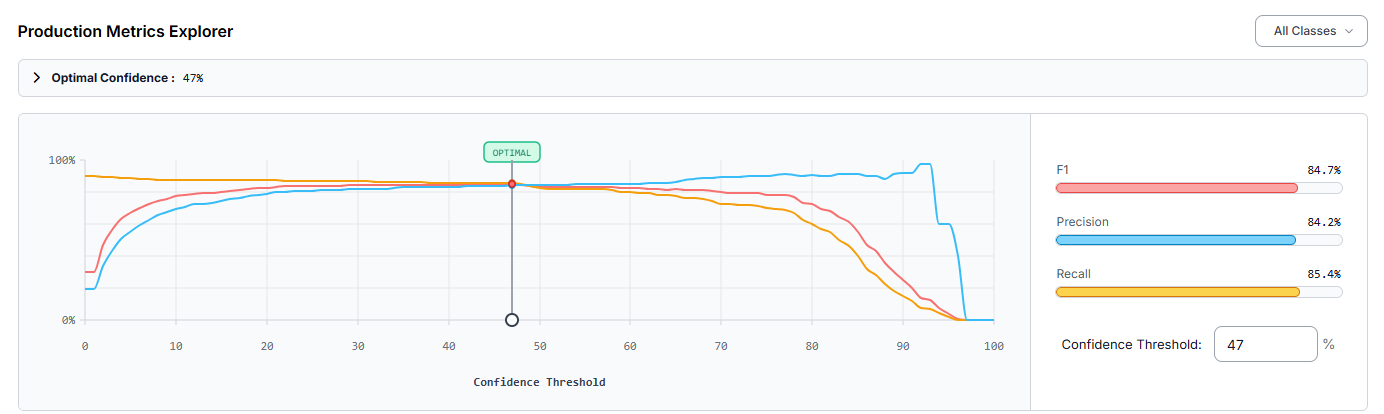
Step 7: Evaluating Model Performance Metrics
Following the completion of the cloud training loop, the architecture was assessed via the production explorer. Operating at an engineered optimal confidence threshold of 47%, the customized baseball detector returned the following performance profile:
- mAP@50: 82.5%
- Precision: 84.2%
- Recall: 85.4%
- F1-Score: 84.7%
A Precision value of 84.2% demonstrates that the majority of isolated predictions corresponded to genuine targets, suppressing false alarms originating from uniform designs or dugout clutter. The overall 82.5% mAP@50 metric validates robust detection capabilities across the target classes.
Performance analysis indicated that the detector frequently missed player footwear, resulting in a notable volume of false negatives. Elevating the overall tracking precision can be achieved by:
- Expanding the Curation Pool: Injecting a broader selection of training frames that showcase player cleats from unique perspectives and during intense baserunning or pitching motions.
- Deploying Tiled Inference: Integrating Slicing Aided Hyper Inference (SAHI) to better isolate miniature targets like the baseball when filmed from wide stadium angles or high-altitude broadcast feeds.
Creating the Tracker with Roboflow Workflows
Once the custom model endpoint (baseball-0vbbm-7yekc/1) is live, you can construct the core tracking logic. This infrastructure uses Roboflow Workflows, a visual development canvas that links modular functional block nodes to handle compound computer vision tasks.
Below is the step-by-step breakdown of the logic used in this project:
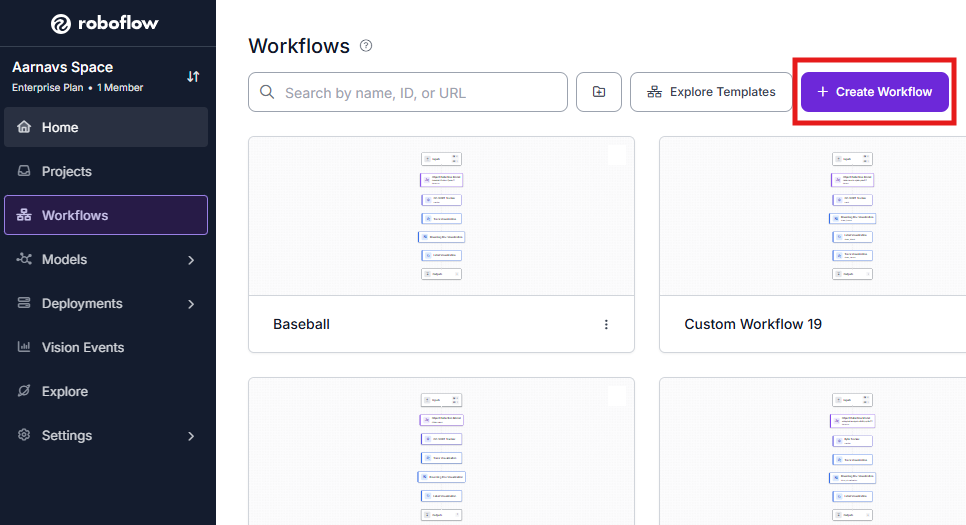
1. Initialize the Workflow
Open the platform dashboard and enter the Workflows builder. Starting a clean development template gives you an environment to place, configure, and link your functional blocks.
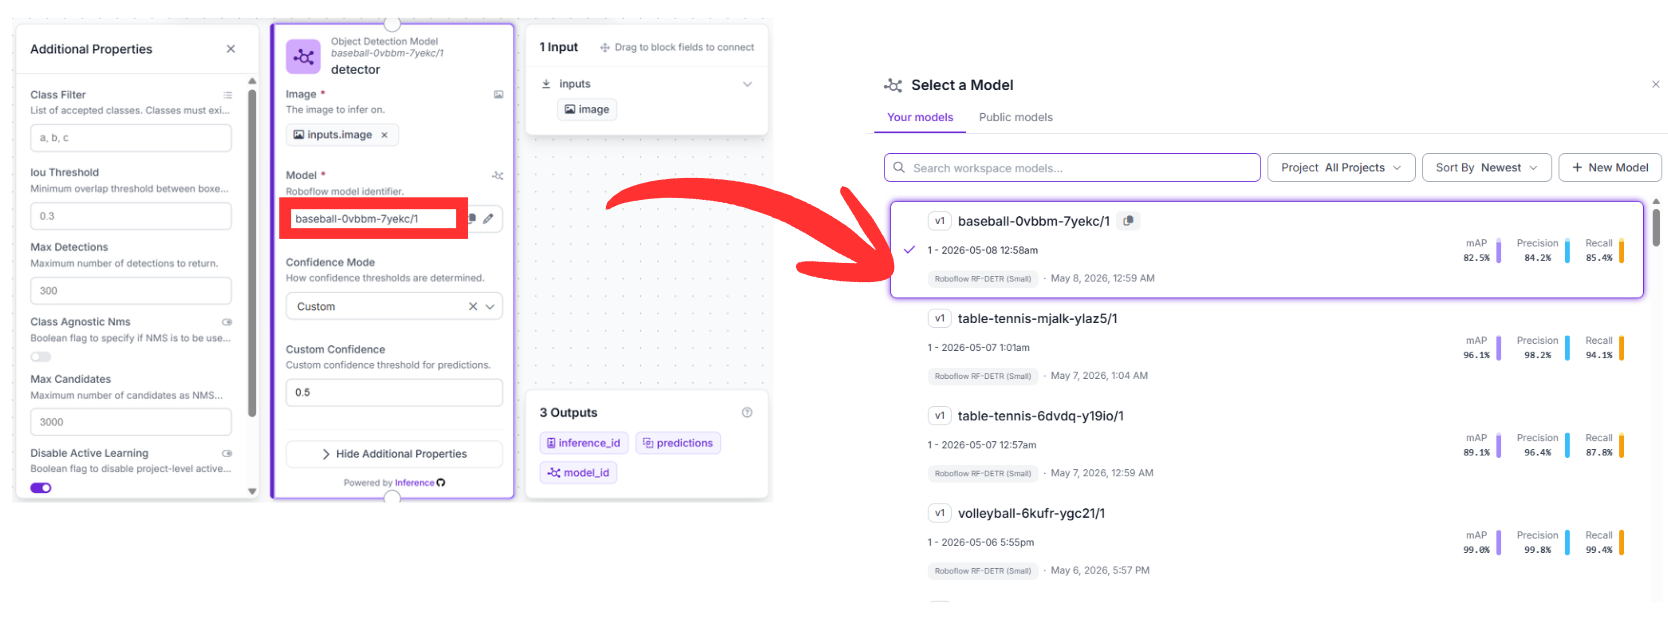
2. Detection Block (RF-DETR)
- Upstream Connection: This node consumes raw pixel data directly from the default image field inside the Inputs block.
- Configuration: Point this block to your custom model identifier: baseball-0vbbm-7yekc/1.
- Function: This node acts as the visual core of the application. It runs inference on incoming video frames to locate the baseball, bats, gloves, shoes, and bases, outputting a structured list of coordinate data for downstream consumption.
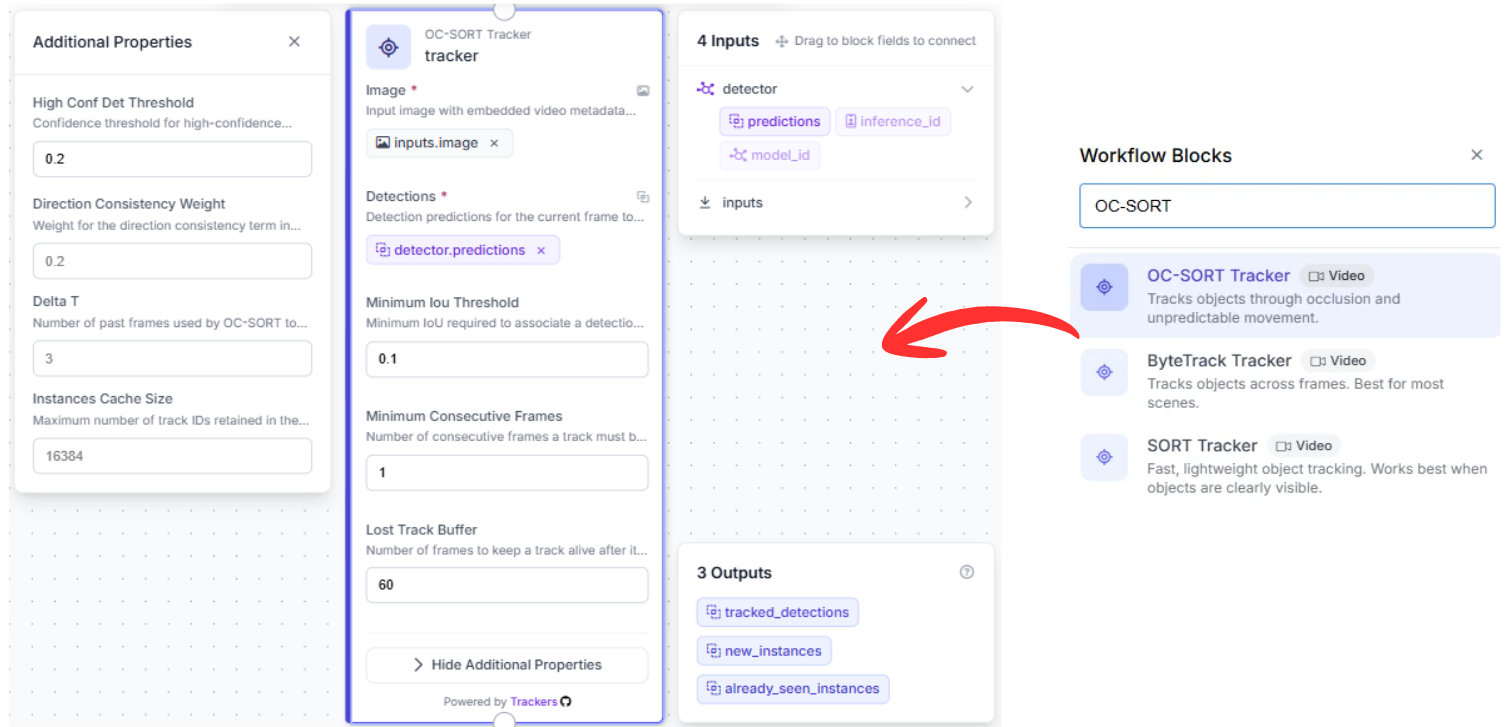
3. Tracking Block (OC-SORT Tracker)
- Upstream Connection: This node hooks directly into the structured array of predictions output by the preceding detection node.
- Why it matters: Standard object detectors treat every image frame as an isolated moment in time, omitting cross-frame historical awareness. Managing a continuous trajectory across a rapid sequence requires temporal persistence.
- Function: Utilizing the OC-SORT (Observation-Centric SORT) tracking methodology, this block maps object momentum. If a ball is temporarily obscured by a batter's torso or a fielder's glove, the tracking block computes its expected path, keeping the object's unique ID stable when it reappears.
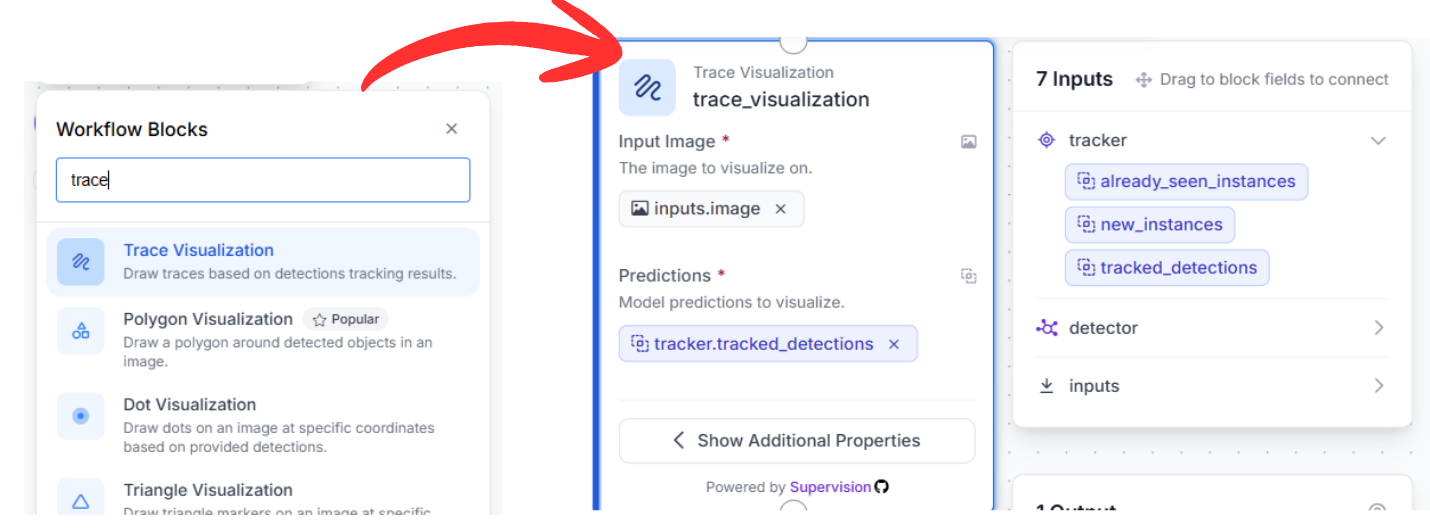
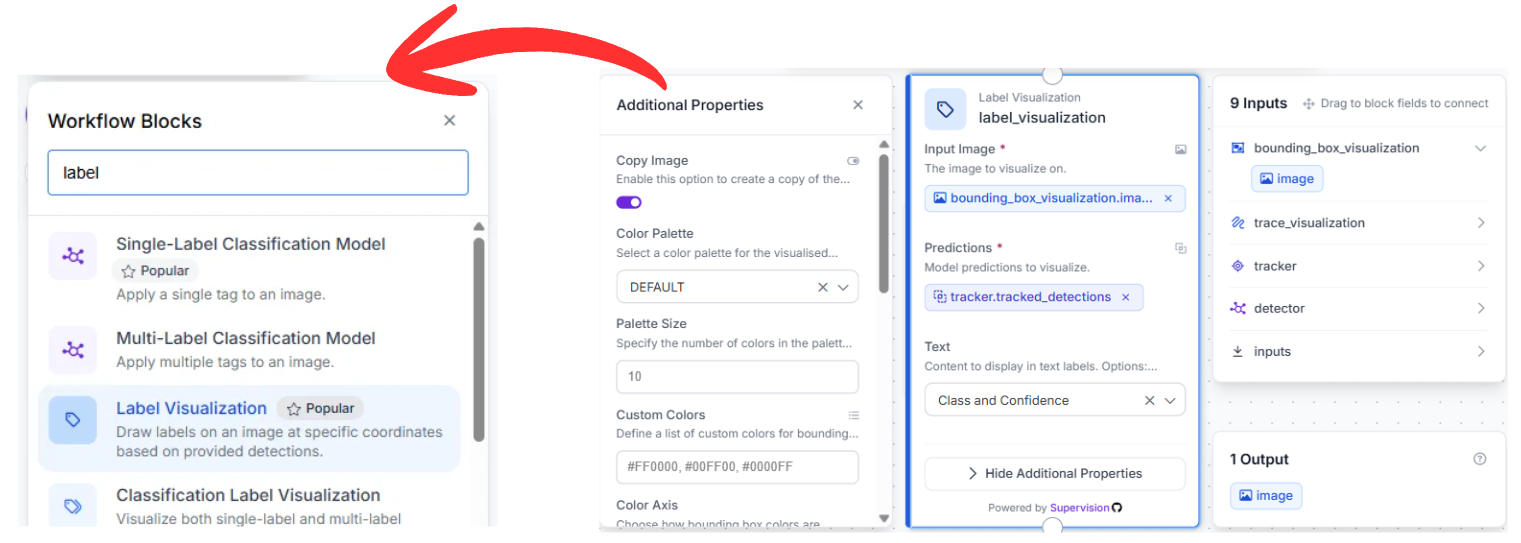
4. Visualization Pipeline
To translate raw coordinate arrays into an intuitive visual stream, link three rendering blocks in series:
- Trace Visualization: Connected directly to the tracking node's output data. It references object history to draw a persistent motion path, mapping out the precise launch angle and flight arc of the ball over a multi-frame sequence.
- Bounding Box Visualization: Fed from the trace visualizer's image output, this block draws standard bounding containers around all detected targets utilizing the smoothed, tracked spatial positions.
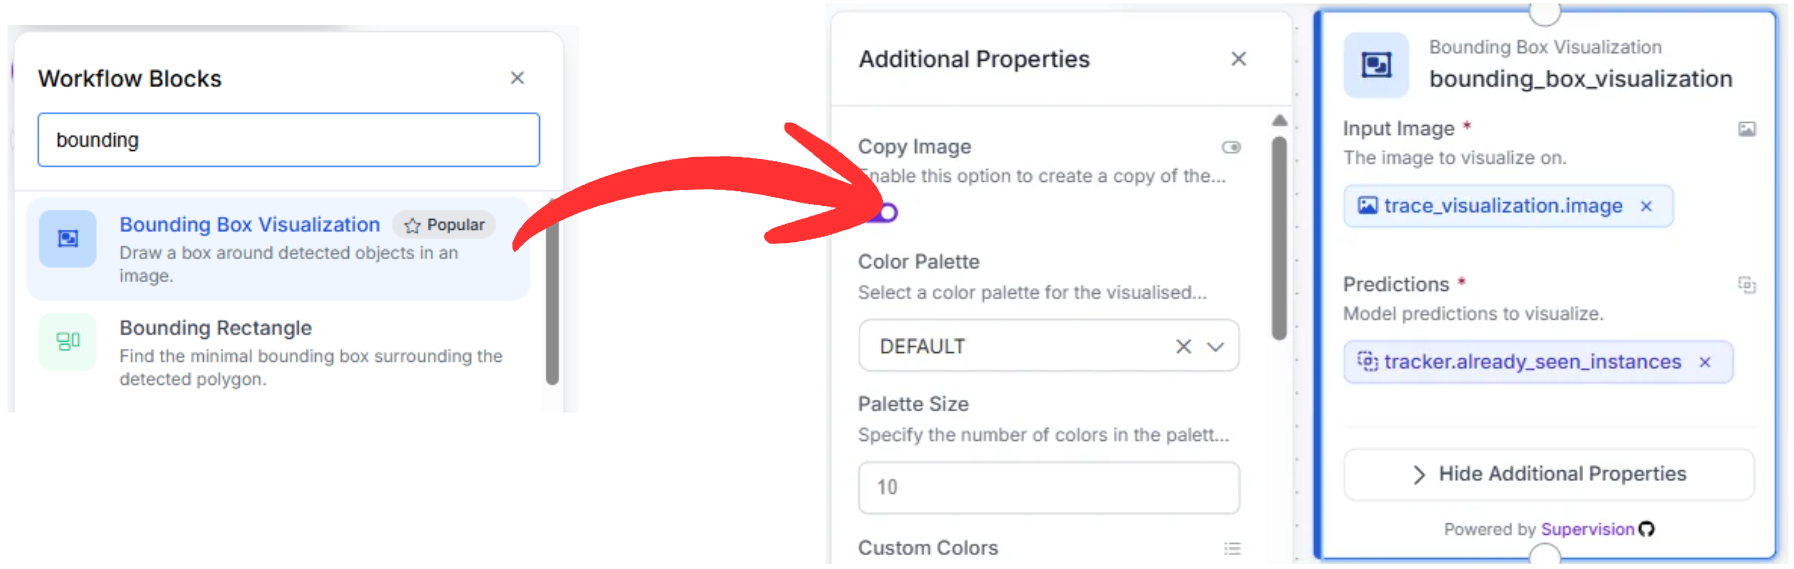
- Label Visualization: The final stage in the visualization chain, this block overlays text identifiers (such as baseball or bat) along with calculated confidence values, making the output easily interpretable for coaches and analysts.
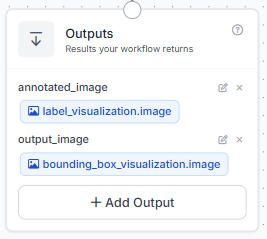
5. Exporting Content
The process finishes at the Outputs block. This node takes the fully annotated image stream from the final label visualization stage and outputs the final video stream (complete with trajectories and boxes) to your live dashboard, storage system, or external processing applications.
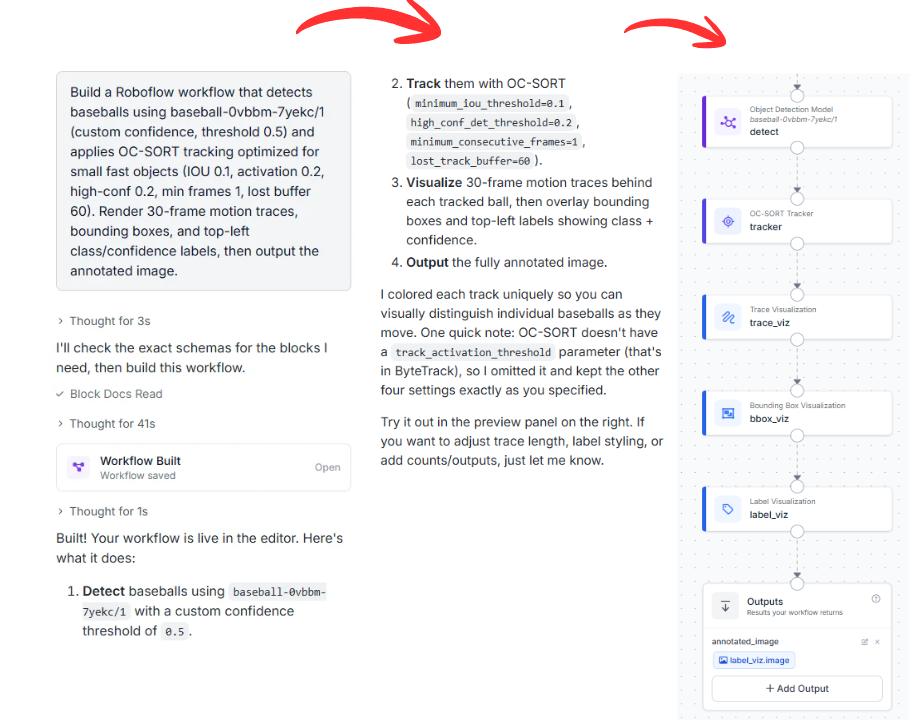
Workflow Creation via Roboflow Agent
If you want to make this workflow without manually placing and linking individual nodes, you can use the Roboflow Agent. This AI agent interprets text descriptions to build complete multi-stage architectures automatically.
You can copy and adapt this prompt to configure your system:
"Build a Roboflow workflow that detects baseballs using baseball-0vbbm-7yekc/1 (custom confidence, threshold 0.5) and applies OC-SORT tracking optimized for small fast objects (IOU 0.1, activation 0.2, high-conf 0.2, min frames 1, lost buffer 60). Render 30-frame motion traces, bounding boxes, and top-left class/confidence labels, then output the annotated image."
The Agent reviews your request, verifies the availability of your model ID, and wires the entire functional diagram together in seconds.
Automated Basketball Tracking with AI
Combining an optimized RF-DETR object detector with a tracking engine like OC-SORT provides a powerful framework for extracting baseball metrics. This layout gives teams and developers the power to monitor pitching paths, calculate exit velocities, and log player positioning automatically.
Want to implement advanced tracking in your sport? Set up a free account on the Roboflow Platform to start building custom computer vision workflows.
Cite this Post
Use the following entry to cite this post in your research:
Aarnav Shah. (May 12, 2026). Tracking Baseball Games with AI: Dynamic Field Analytics. Roboflow Blog: https://blog.roboflow.com/automated-basketball-tracking/