
This tutorial builds an automated soccer formation analysis pipeline that combines RF-DETR for player detection with Gemini 2.5 Pro to interpret spatial player positions and estimate the most likely tactical formation from a single broadcast image. The same detection layer can extend to full-match tracking by adding ByteTrack for persistent player IDs across frames, and the post includes worked code, a Roboflow Workflows implementation, and guidance on extending to heatmaps and top-down pitch homography for richer tactical output.
Modern sports analytics AI systems use computer vision to convert match footage into structured information that coaches, analysts, and product teams can use. Common use cases include player detection, player tracking, ball tracking, tactical formation analysis, zone coverage, event detection, and performance monitoring.
These workflows are already used across sports. For example, PlayVision uses computer vision to turn basketball footage into advanced analytics and reports for teams, while Fletcher Sports used Roboflow-powered vision AI to control camera coverage across tennis courts at major tournaments, including the US Open.
This tutorial focuses on one specific use case: soccer formation analysis from a single broadcast image. Instead of tracking players across an entire match, the workflow detects visible players in one frame and uses a Vision Language Model to estimate the most likely tactical structure.
What Is Sports Analytics AI?
Sports analytics AI is the application of machine learning and computer vision to athletic environments, allowing teams to automate the extraction of player telemetry, tactical formations, and performance metrics from raw video.
Architecting a Sports Analytics AI Pipeline
Most sports analytics systems follow the same general pattern: visual data is collected, players and objects are detected, positions are tracked or structured, and higher-level analytics are generated from those spatial signals.
RF-DETR provides the spatial grounding layer used by the downstream analytics pipeline.
Gemini 2.5 Pro then interprets the visible player arrangement and estimates the most likely formation in the image.
In a full sports analytics pipeline, this detection stage could also connect to tracking blocks such as ByteTrack, which assign persistent IDs to players across video frames. Roboflow’s American football tracking tutorial follows that pattern by combining RF-DETR detection with tracking to transform video into structured player movement data.
Example: Soccer Formation Analysis from Match Images with Roboflow
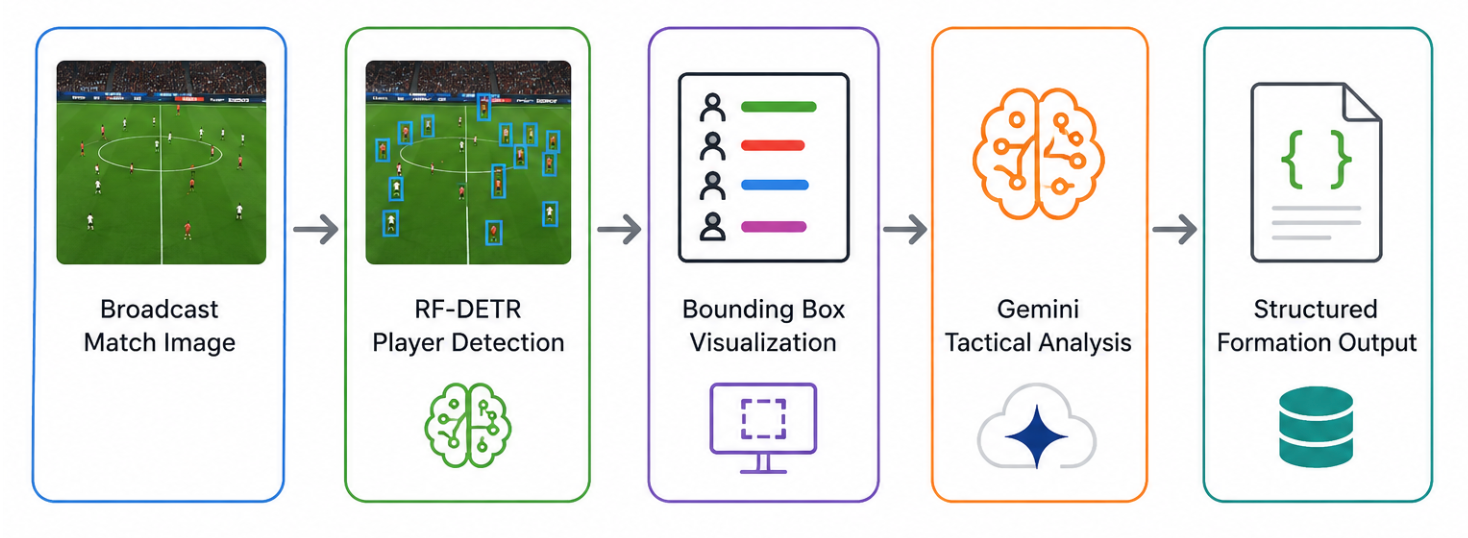
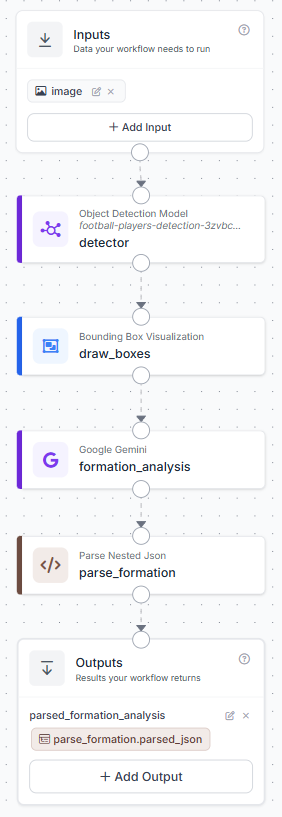
This tutorial demonstrates how to build an automated soccer formation analysis workflow that combines Roboflow’s RF-DETR model with Gemini 2.5 Pro visual reasoning. Here's the workflow we will build.
You’ll train a custom player detection model, deploy it through Roboflow Workflows, and integrate a Vision Language Model that reads player bounding boxes from a broadcast match image and estimates the most likely tactical formation.
Unlike traditional formation classification systems, this workflow does not rely on formation labels. The dataset only contains player detection annotations, so the VLM acts as a reasoning and verification layer that interprets visible player positioning rather than predicting from supervised tactical classes.
The final workflow returns a structured JSON output containing the estimated formation, attacking direction, confidence level, and tactical reasoning for both teams.
Step 1: Prepare the Dataset
We’ll use a soccer player detection dataset from Roboflow Universe containing annotated broadcast match images. The dataset focuses on object localization rather than tactical labeling, with classes such as:
- player
- goalkeeper
- referee
- ball
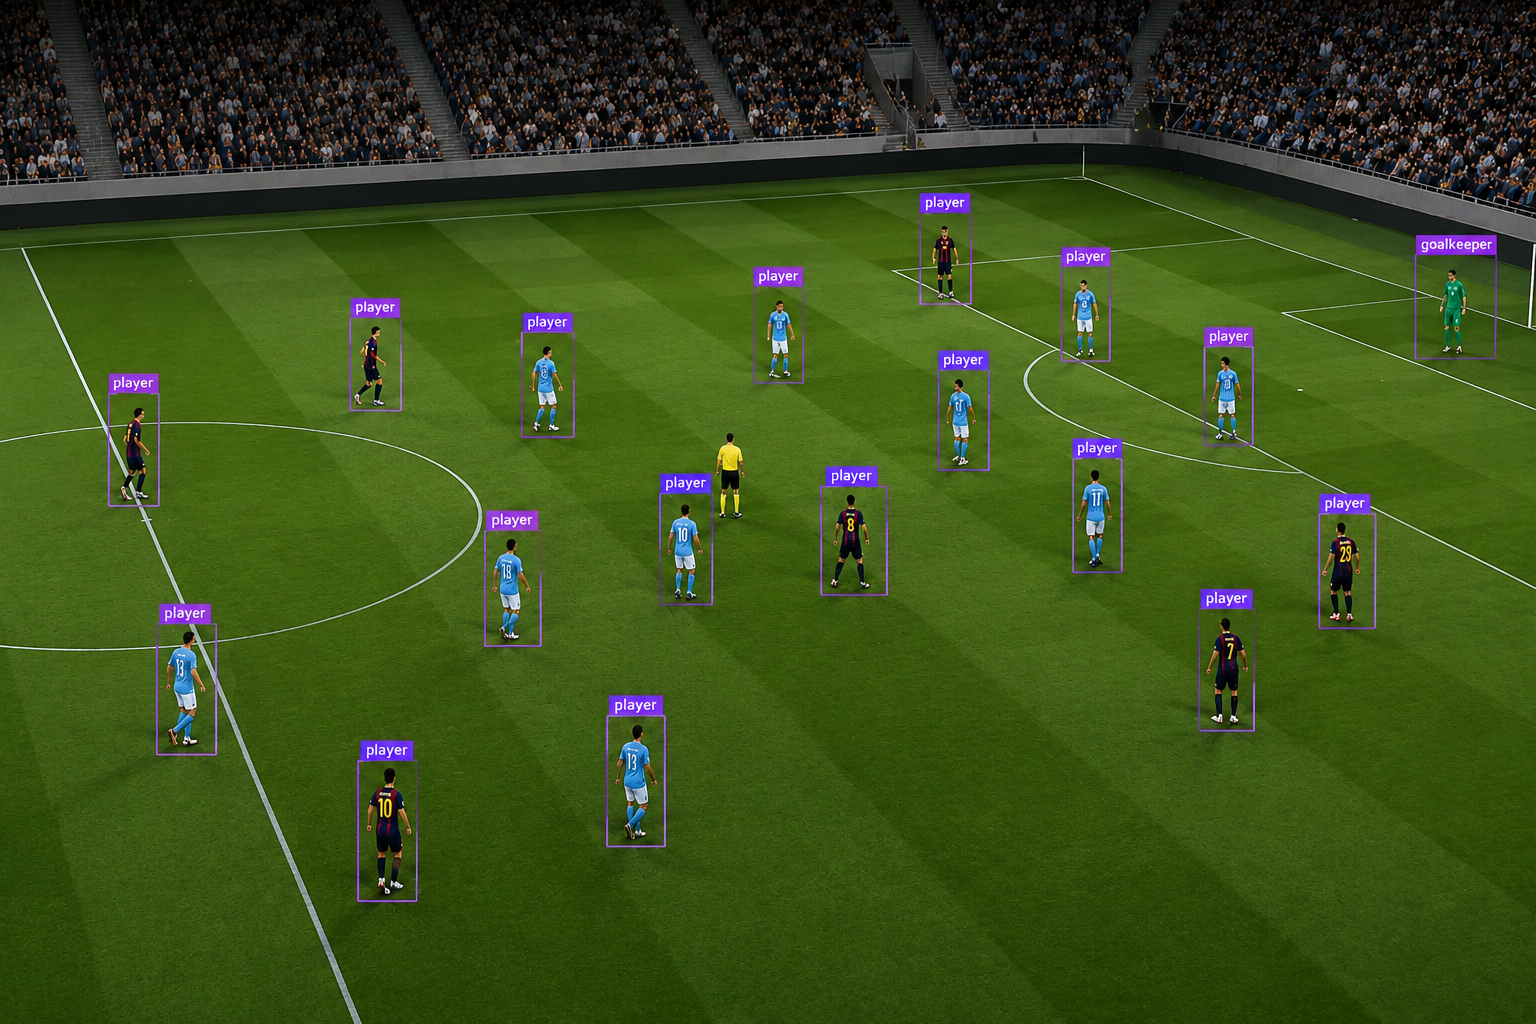
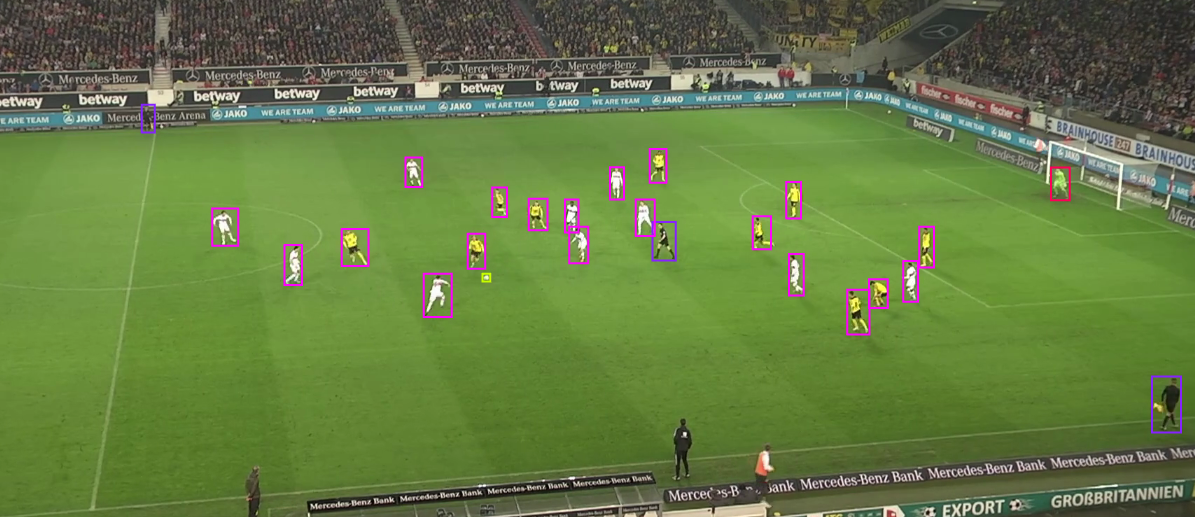
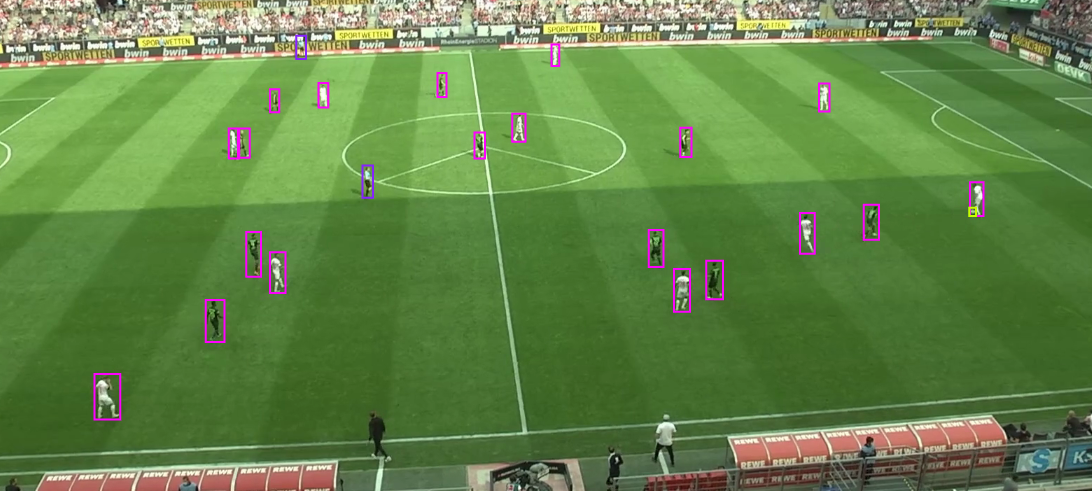
The images capture wide broadcast camera angles across different stadiums, lighting conditions, and match environments. This variation is important because player spacing and visibility change significantly depending on camera zoom level, pitch lighting, and crowd background complexity. Here are examples of the detection targets:
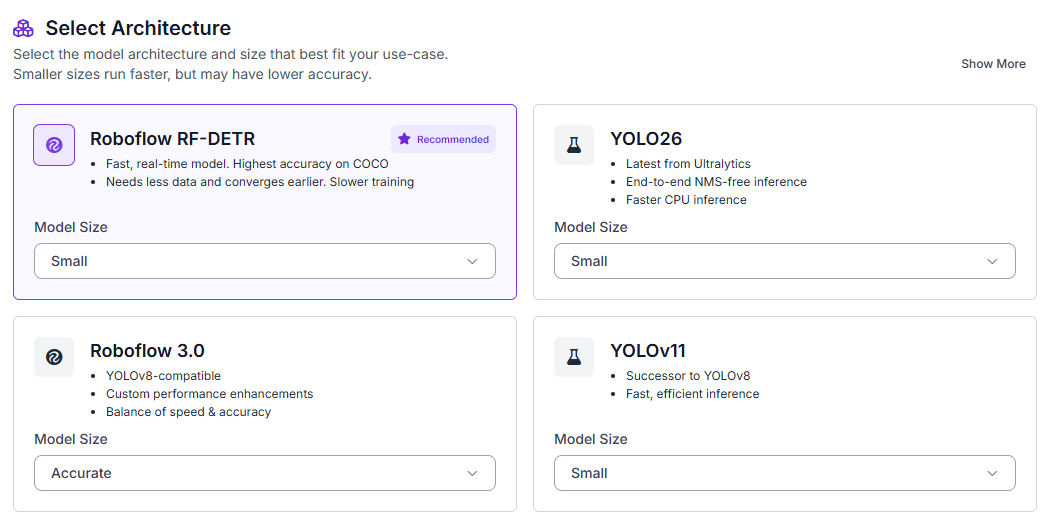
Start by navigating to the Train tab in your Roboflow project, then select Custom Training. From the available architectures, choose Roboflow RF-DETR and set the model size to Small.
Once the model architecture is selected, Roboflow will prompt you to generate a dataset version before starting the training job. Configure a 70/15/15 split for training, validation, and testing directly inside the version generation screen.
Enable preprocessing steps such as:
- Auto-orientation
- Resize preprocessing (512×512)
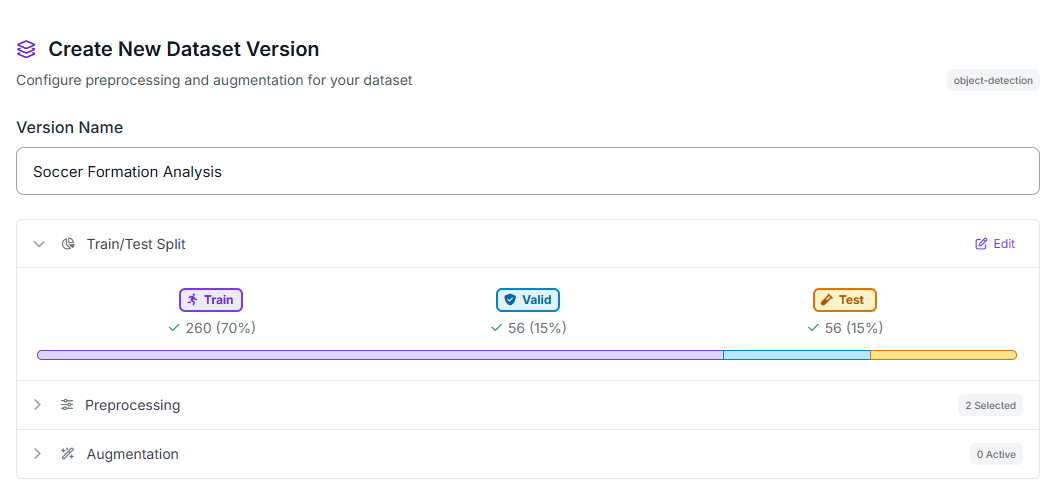
These preprocessing steps help normalize broadcast soccer footage captured under different camera zoom levels and stadium environments while ensuring a consistent input resolution for RF-DETR training.
Step 2: Train the RF-DETR Model
After configuring the training job and generating the dataset version, Roboflow will begin training the RF-DETR model on the annotated soccer images.
During training, RF-DETR learns to localize players, goalkeepers, referees, and the ball from the labeled bounding boxes in the dataset. Unlike supervised tactical classification systems, the model is not trained to recognize formations such as 4-3-3 or 4-4-2. Instead, it provides the spatial information used by the downstream tactical analysis stage.
Step 3: Evaluate Metrics
Once training completes, review your model’s detection performance metrics. Our RF-DETR Small model achieved strong results on this soccer player detection task:
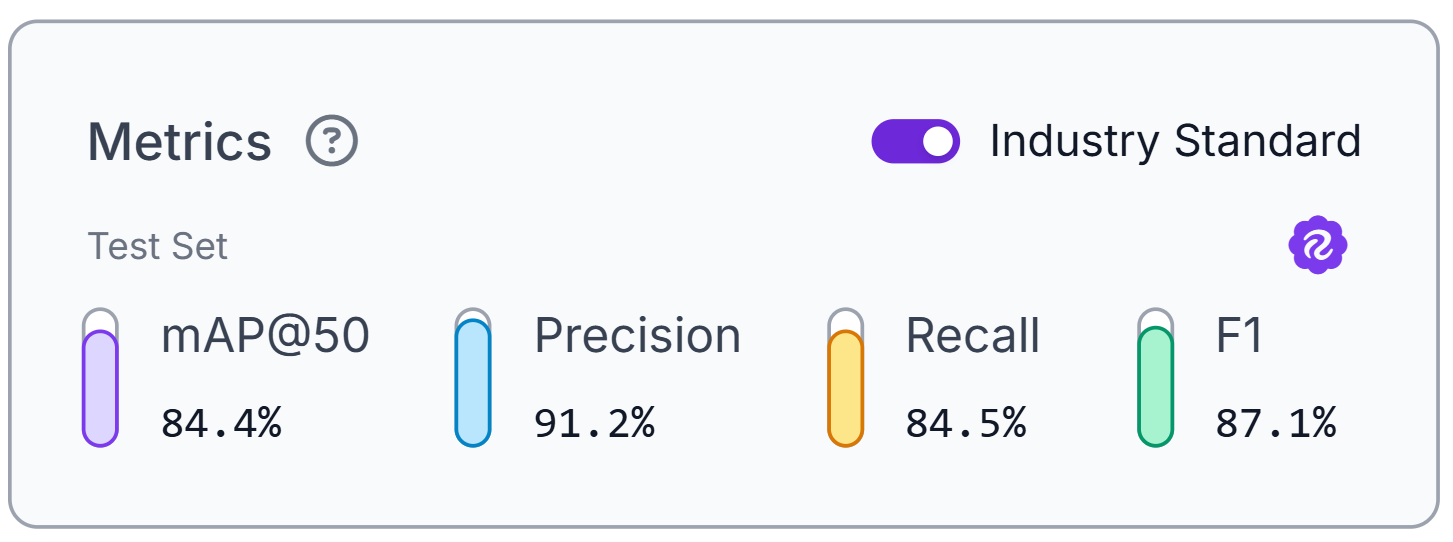
The model achieved 84.4% mAP@50, alongside 91.2% precision, 84.5% recall, and an 87.1% F1 score. These balanced metrics indicate reliable player localization across wide broadcast match images.
High recall helps ensure players are not missed, while strong precision reduces false detections that could distort formation estimates. These metrics evaluate detection quality only; tactical interpretation is performed later inside the workflow.
Step 4: Deploy to Workflows
After validating your model’s performance, deploy it as an interactive workflow. Roboflow Workflows provides a visual interface for building computer vision pipelines that combine object detection and multimodal reasoning.
Our final workflow connects four processing blocks: the RF-DETR model detects players, goalkeepers, referees, and the ball, a bounding box visualization block annotates the frame, a Gemini 2.5 Pro VLM block analyzes the tactical structure from the annotated image, and a custom Parse Nested JSON block structures the response into machine-readable outputs.
To create the workflow, click Try Workflows when viewing your trained model’s deployment options. From the template gallery, select Detect and Visualize as the starting point.
Step 5: Configure the VLM Block
Add a Google Gemini block to transform the annotated soccer image into tactical formation analysis. Click the “+” button, search for “Google Gemini,” and select the block.
Configure the block with these settings:
- Image: Pass the annotated image from the bounding box visualization block
- Model: Gemini 2.5 Pro
- Task Type: Open Prompt
- Temperature: 0.3
Prompt:
Analyze the annotated soccer image using player positions, field orientation, and visible goal locations.

First determine:
- which direction each team is attacking
- Which goal each team is defending

Then estimate the most likely formation for each team separately.

Do not treat mirrored team structures as identical.
Use field progression, defensive depth, attacking width, and goal proximity to distinguish attacking and defending shapes.

Choose only from:
4-3-3, 4-4-2, 4-2-3-1, 3-5-2, 5-3-2, 3-4-3, unknown.

Return only valid JSON:
{
  "team_1": {
    "attacking_direction": "",
    "formation": "",
    "confidence": "",
    "reason": ""
  },
  "team_2": {
    "attacking_direction": "",
    "formation": "",
    "confidence": "",
    "reason": ""
  }
}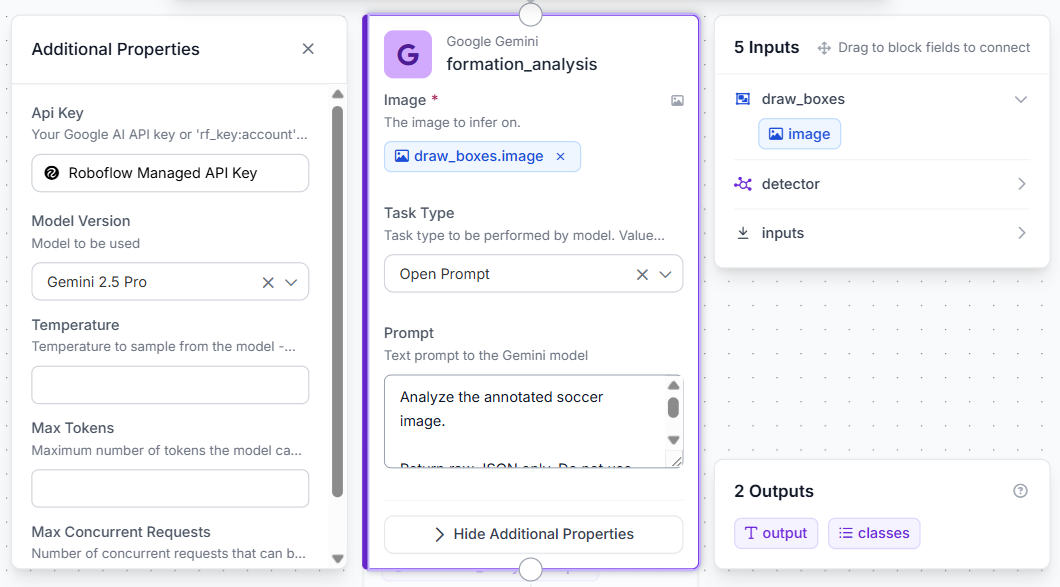
Gemini receives the annotated image produced by the detector and estimates the most likely tactical structure based on visible player spacing, field orientation, and team organization.
Step 6: Parse the Formation Output
Add a custom Parse Nested JSON block after the Gemini analysis block to convert the raw VLM response into a structured dictionary format.
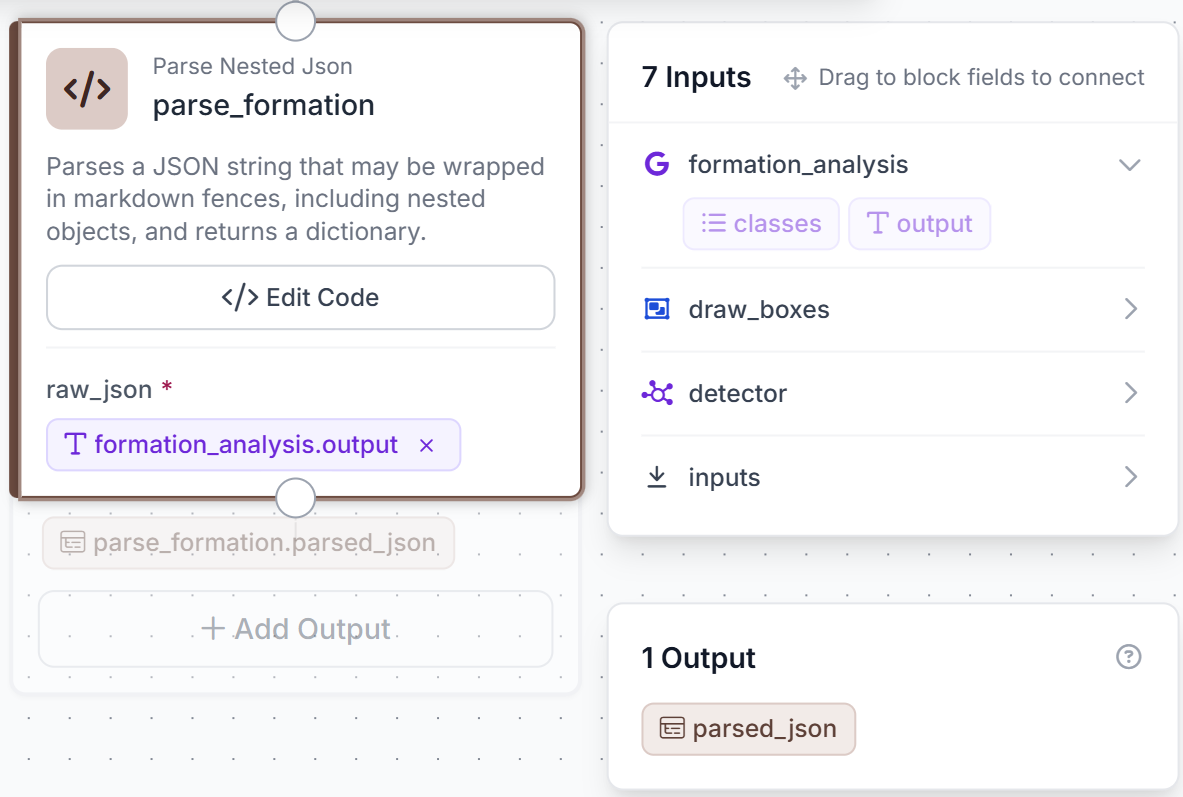
Connect the formation_analysis.output field to the raw_json input of the parser block. Configure the block to return a single dictionary output named parsed_json.
The parser is designed to handle Gemini responses that may occasionally include markdown JSON fences while still extracting the nested tactical fields correctly. This ensures the workflow produces stable, structured outputs even when the VLM formatting varies slightly between responses.
Use the following Python code inside the parser block:
import json
import re

def run(self, raw_json):
   text = str(raw_json).strip()

   match = re.search(r"```json\s*([\s\S]*?)\s*```", text)
   if match:
       text = match.group(1).strip()

   try:
       data = json.loads(text)
       return {"parsed_json": data}

   except Exception as e:
       return {
           "parsed_json": {
               "error": str(e),
               "raw": text
           }
       }
The parser converts the Gemini response into structured tactical outputs containing:
- attacking direction
- estimated formation
- confidence level
- tactical reasoning
for both detected teams. These structured outputs can later be exported, visualized, or integrated into downstream analytics systems.
Step 7: Test the Workflow
Click Run in the top-right corner to validate the workflow. Upload a broadcast soccer image that contains a visible tactical structure, ideally one showing both teams across a wide section of the pitch.
Within seconds, the workflow returns a structured tactical analysis describing the likely formation, attacking direction, confidence level, and reasoning for each team.
A representative output looks like:
{
"team_1": {
"attacking_direction": "right",
"formation": "4-3-3",
"confidence": "Medium",
"reason": "Players form a visible back four, midfield trio, and wide attacking line."
},
"team_2": {
"attacking_direction": "left",
"formation": "4-4-2",
"confidence": "Medium",
"reason": "The team appears compact defensively with two organized banks of four."
}
}
Because the system reasons from a single frame rather than a labeled tactical dataset, outputs should be treated as formation estimates rather than verified tactical classifications. Wide tactical camera angles generally produce the most reliable results, while cropped transition frames or set-piece situations may increase uncertainty in the VLM output.
Translating Detections into Coaching Insights with Sports Analytics AI
The real value of sports analytics comes from transforming detections into information that coaches and analysts can act on. While the primary workflow in this tutorial focuses on single-image formation analysis, we built a second workflow to demonstrate how detections and tracking IDs can be converted into measurable analytics.
The second workflow applies the same RF-DETR soccer detector to a short broadcast video clip. Rather than sending detections to Gemini, the workflow connects the detector to a Byte Tracker block that assigns persistent IDs to players across frames. Those tracked detections are then passed into a Heatmap Visualization block that accumulates player locations over time.
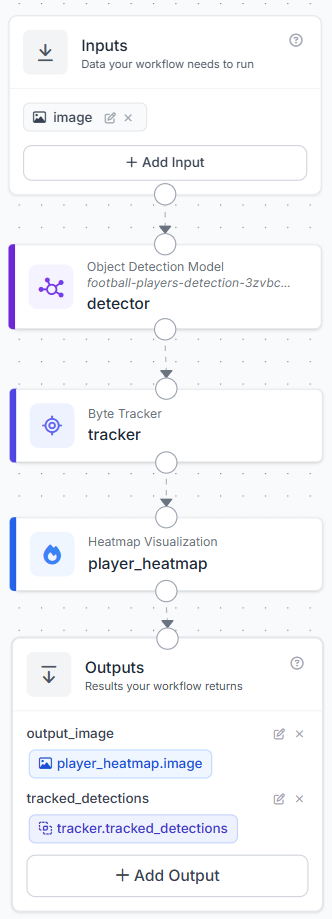
The resulting heatmap highlights the regions of the pitch occupied most frequently during the analyzed sequence. Coaches and analysts can use this information to study positional discipline, identify preferred operating areas, evaluate zone coverage, and monitor how the team shape changes throughout a phase of play.
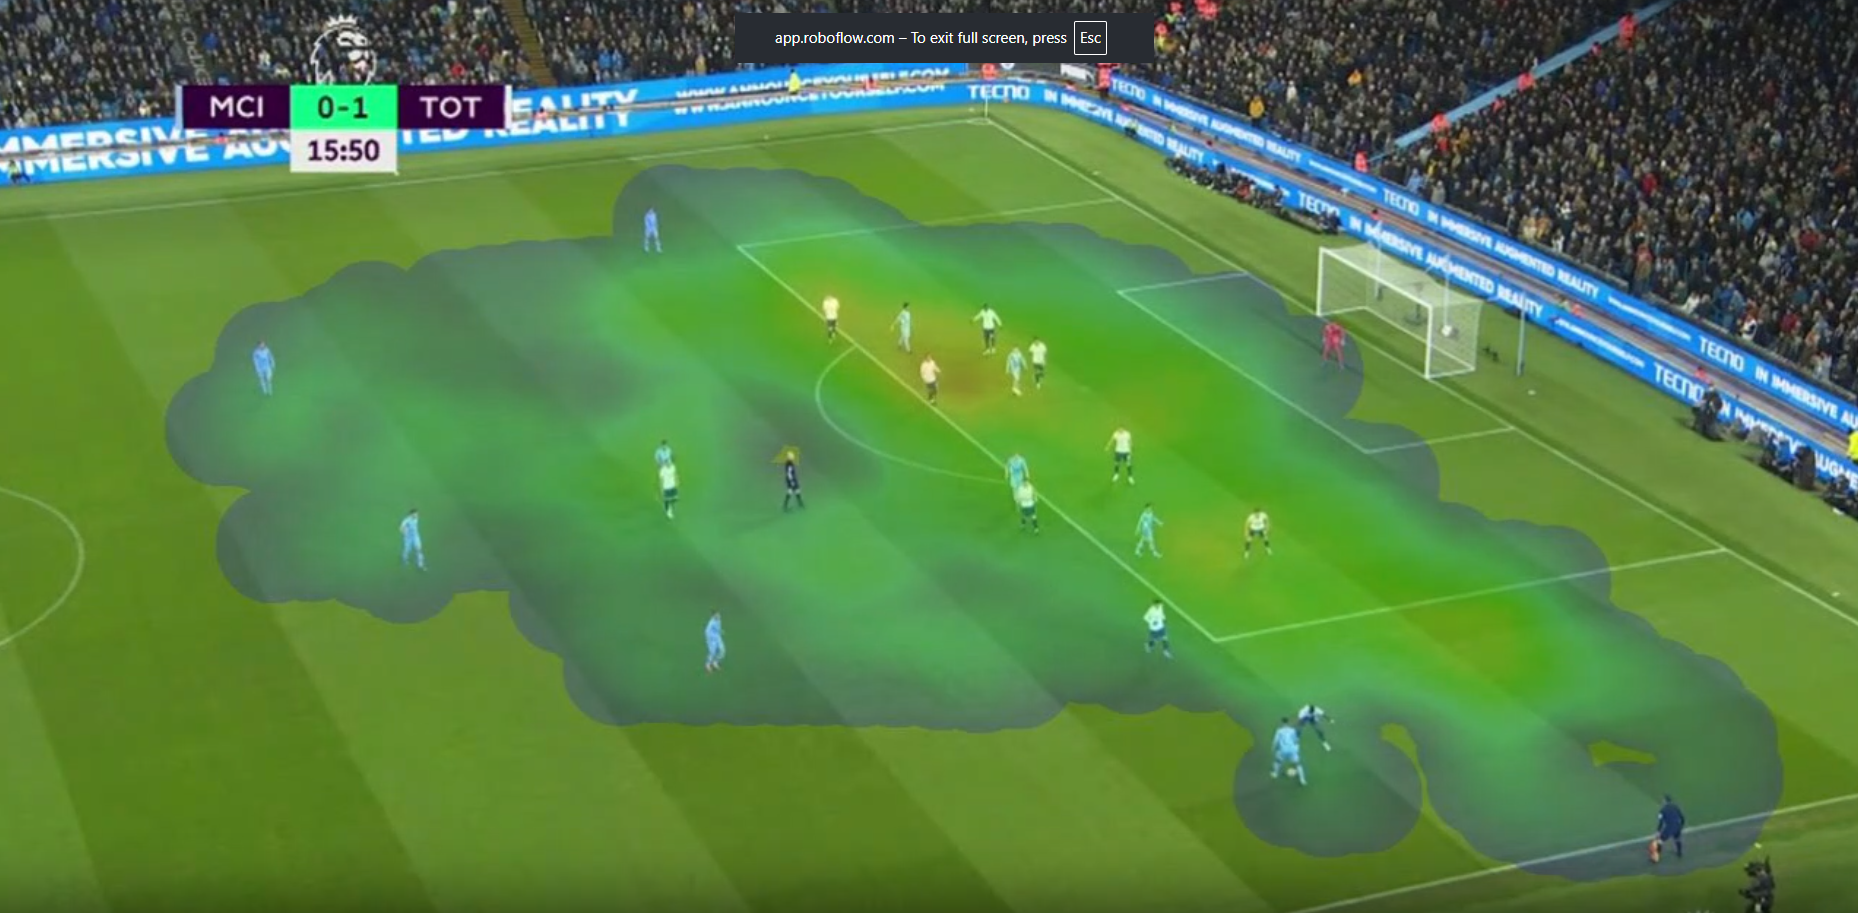
This workflow demonstrates how raw detections become coaching insights. Bounding boxes identify player locations, tracking IDs connect those detections across frames, and the accumulated coordinates produce a heatmap that summarizes player movement patterns. Similar pipelines can be extended to measure defensive compactness, analyze spatial coverage, or track tactical changes throughout a match.
Because heatmap generation depends on stable player coordinates, wide broadcast angles or top-down pitch views generally produce more reliable results than rapidly moving camera shots.
You can fork a sports dataset from Roboflow Universe or build a real-time tracking pipeline in Roboflow Workflows to explore similar analytics on your own footage.
Sports Analytics AI Conclusion
For production deployment, consider extending the workflow with team-color clustering, top-down pitch homography mapping, or multi-frame temporal analysis. By chaining these models together, you can extract highly accurate player telemetry and build robust optical tracking systems without relying on expensive, stadium-installed hardware arrays. As the role of machine learning in sports continues to expand, transforming raw video into automated broadcast analysis will become the baseline for elite tactical planning.
Further reading:
Cite this Post
Use the following entry to cite this post in your research:
Mostafa Ibrahim. (Jun 1, 2026). Sports Analytics AI with Roboflow. Roboflow Blog: https://blog.roboflow.com/sports-analytics-ai/