

You can automate P&ID symbol detection: an RF-DETR model trained on 3,800 annotated diagrams reaches 99.2% mAP@50 across 11 symbol classes, from gate valves to instrument tags. This tutorial builds the full pipeline in Roboflow Workflows, adding GLM-OCR to read instrument identifiers like FT 1702, the first step toward engineering drawing digitization.
Why P&ID Symbol Detection Matters
P&ID symbol detection uses computer vision to locate and classify the valves, instruments, and connection symbols on Piping and Instrumentation Diagrams, the drawings that describe how equipment, piping, and control systems are arranged in an industrial process. Engineers rely on these drawings for design reviews, commissioning, operations, maintenance, and safety analysis, and a single sheet can carry hundreds of small symbols and identifiers. Reviewing them by hand is slow on one drawing and doesn't scale across an archive of thousands.
The stakes are higher than tedium. A review of studies from the chemical and nuclear sectors found that roughly 20% to 50% of incidents and accidents had at least one root cause in erroneous design. A design problem is rarely an obvious structural failure. It's a missing valve, a misplaced instrument, or a misunderstood control relationship, exactly the kind of detail that hides on sheet 47 of 300.
Computer vision cannot judge whether a P&ID is safe or correctly engineered. It can locate and classify symbols consistently, count diagram elements, and extract instrument text, which turns a static drawing into something searchable: the first step of engineering drawing digitization.
In this tutorial, we train an RF-DETR model to detect 11 classes of P&ID symbols and deploy it in Roboflow Workflows, with GLM-OCR reading the text inside detected instrument regions. The finished workflow returns an annotated diagram with symbol boxes and class labels plus a clean list of extracted instrument text, a working foundation for P&ID search, review, and digitization.
Step 1: Prepare the P&ID Dataset
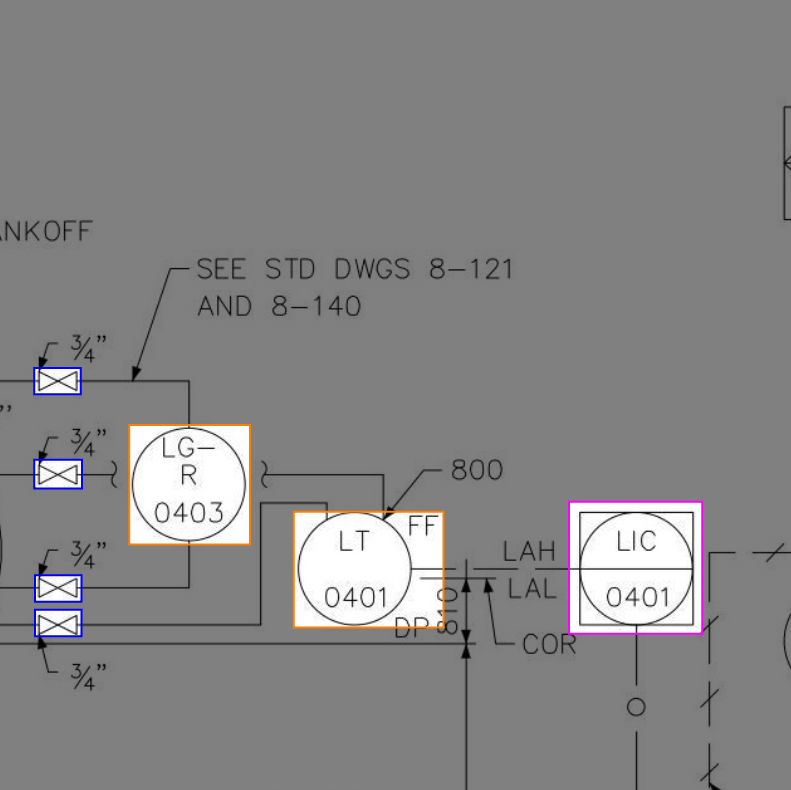
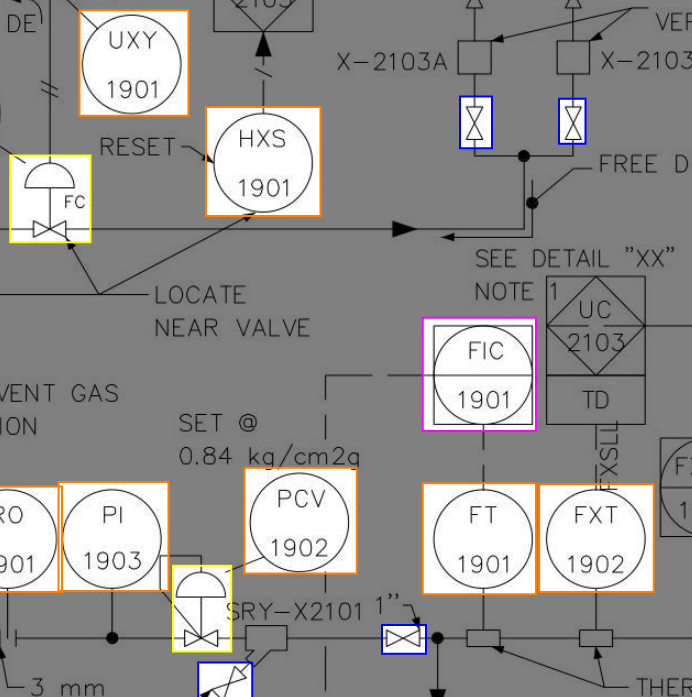
For this tutorial, we use the PID Symbols Computer Vision Dataset from Roboflow Universe. The dataset contains approximately 3,800 annotated images and 11 object detection classes:
- Butterfly valve
- Check valve
- Control valve
- Gate valve
- Globe valve
- Heat exchanger
- Instrument DCS
- Instrument tag
- Page connection
- Three-way valve
- Utility connection
The classes cover several valve types alongside equipment, instrumentation, and diagram-connection symbols. This makes the dataset suitable for demonstrating multi-class symbol detection, although it does not represent every symbol that may appear in production P&IDs.
Examples from the dataset:
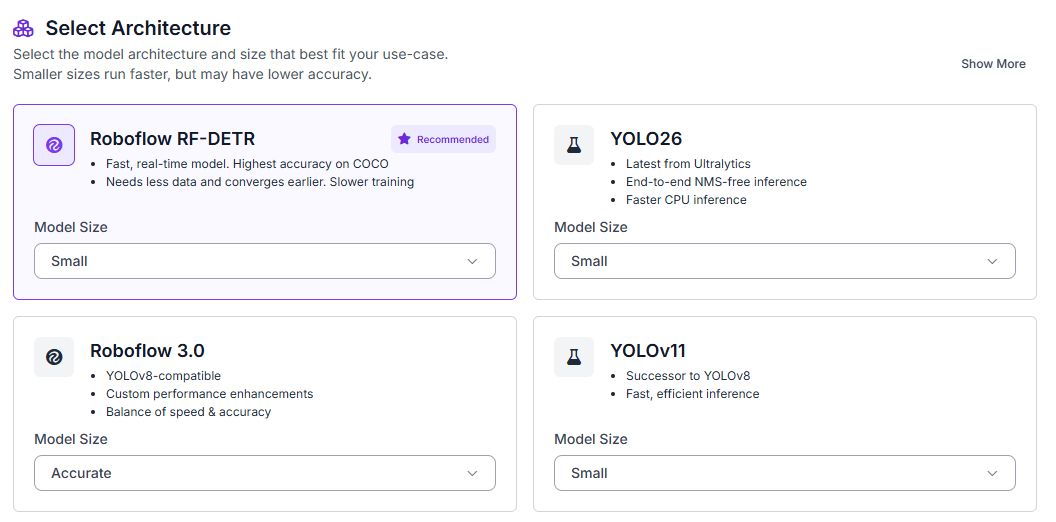
Fork the dataset into your Roboflow workspace. Open the Train tab, select Custom Training, choose RF-DETR, and set the model size to Small.
Generate a new dataset version and configure a 70/15/15 split for training, validation, and testing.
Enable:
- Auto-orientation
- Resize to 512 × 512
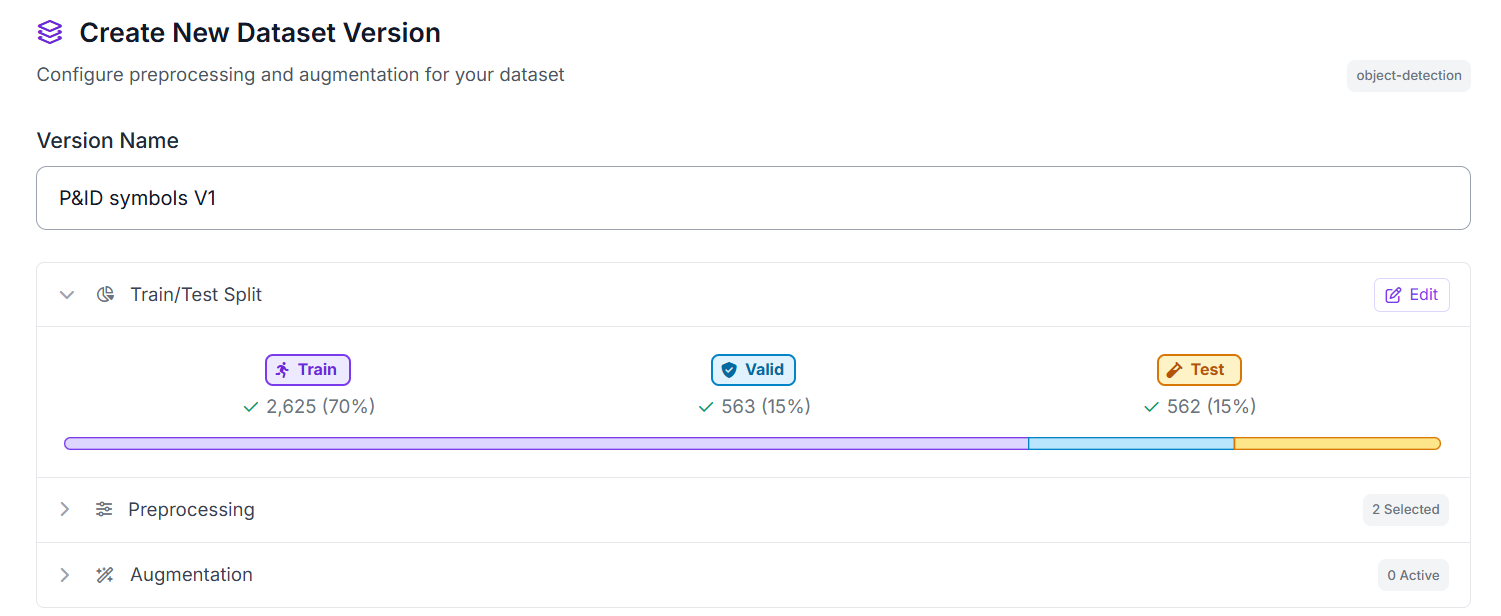
These preprocessing steps ensure that all images have a consistent orientation and resolution, providing standardized inputs for RF-DETR training.
After configuring the dataset version and training settings, start training the RF-DETR Small model. Roboflow will track the run and save the best-performing model for deployment.
Step 2: Evaluate Model Performance
Our RF-DETR Small model achieved strong results on the P&ID symbol detection task.
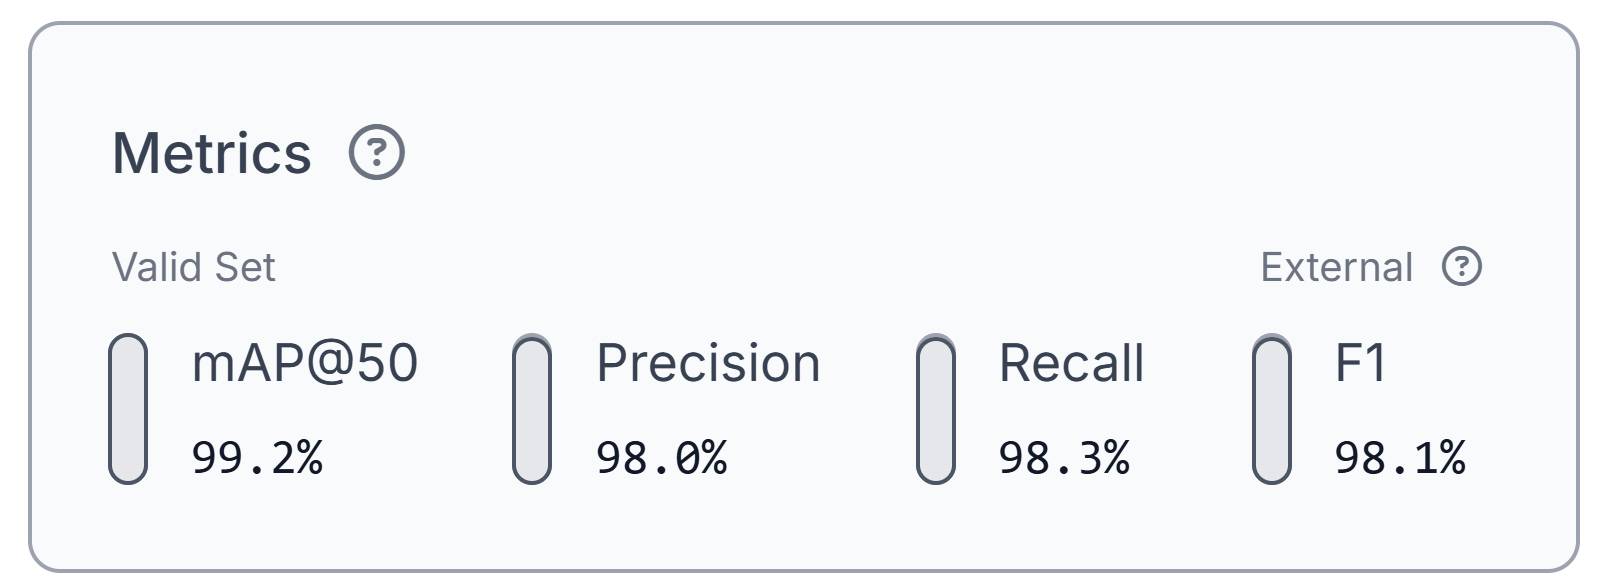
The model achieved 99.2% mAP@50, 98.0% precision, 98.3% recall, and a 98.1% F1 score on the validation set. These results show that the model can detect and classify the 11 P&ID symbol classes with strong overall consistency.
The precision and recall scores are closely balanced, indicating that the model produces few false detections while also locating most annotated symbols. This is important for the OCR branch because missed instrument detections would prevent those regions from being cropped and read.
These metrics reflect performance on the validation split of this dataset. Before deployment, the model should also be tested on drawings from the target environment, where scan quality, resolution, symbol conventions, fonts, and diagram density may differ.
The reported metrics evaluate only the RF-DETR detection stage. In the next section, Roboflow workflows will use the detections to annotate the drawing, filter instrument-related regions, and extract their text with GLM-OCR.
Step 3: Deploy the Model to Roboflow Workflows
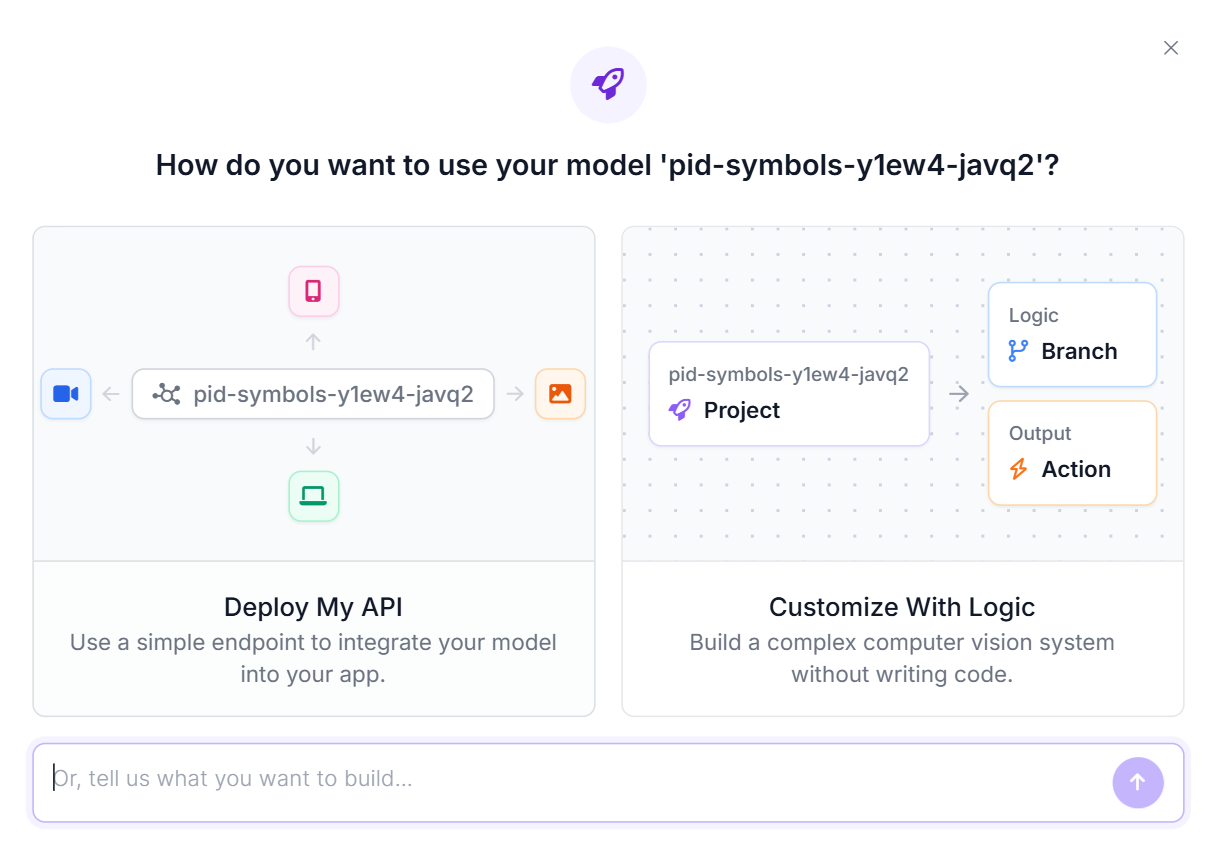
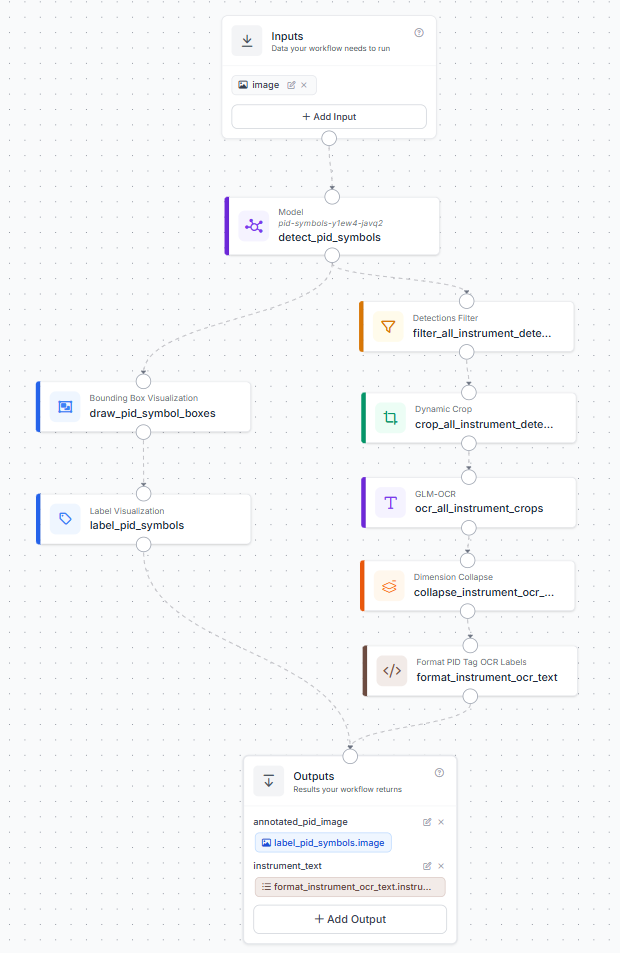
After training, open the model and select Deploy Model. Choose Customize With Logic to open the Workflow editor with the trained model connected to an image input. Here's the workflow we'll build.
The workflow has two branches. The first branch visualizes every detected P&ID symbol. The second branch filters instrument-related detections, crops those regions, and runs OCR on each crop.
Step 4: Visualize the Detected Symbols
Connect the model predictions to a Bounding Box Visualization block. Use the original input image as the image source so the boxes are drawn directly over the P&ID.
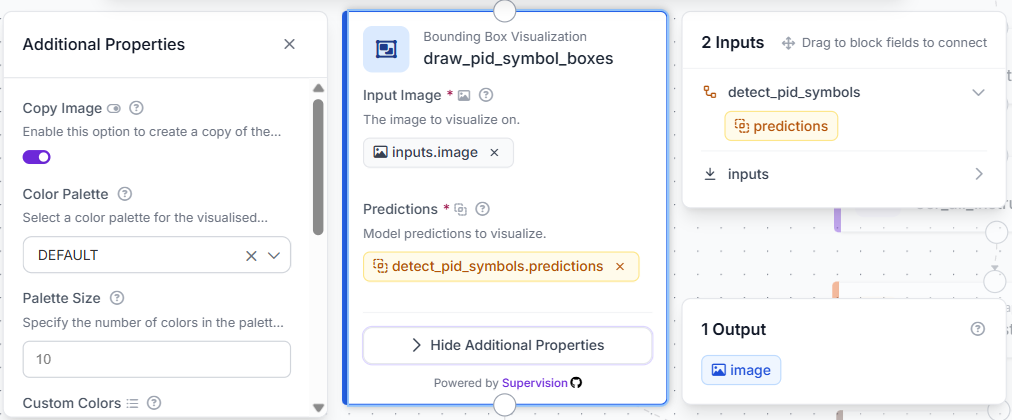
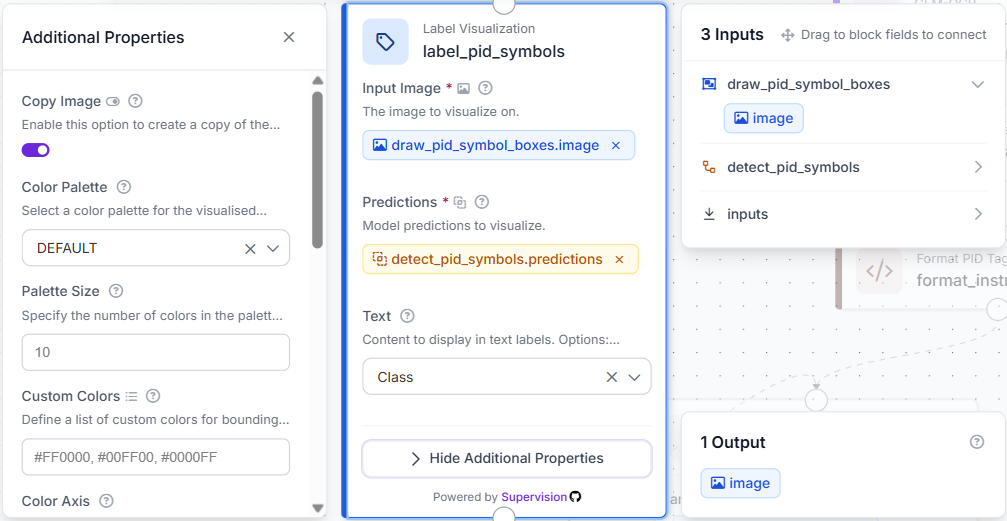
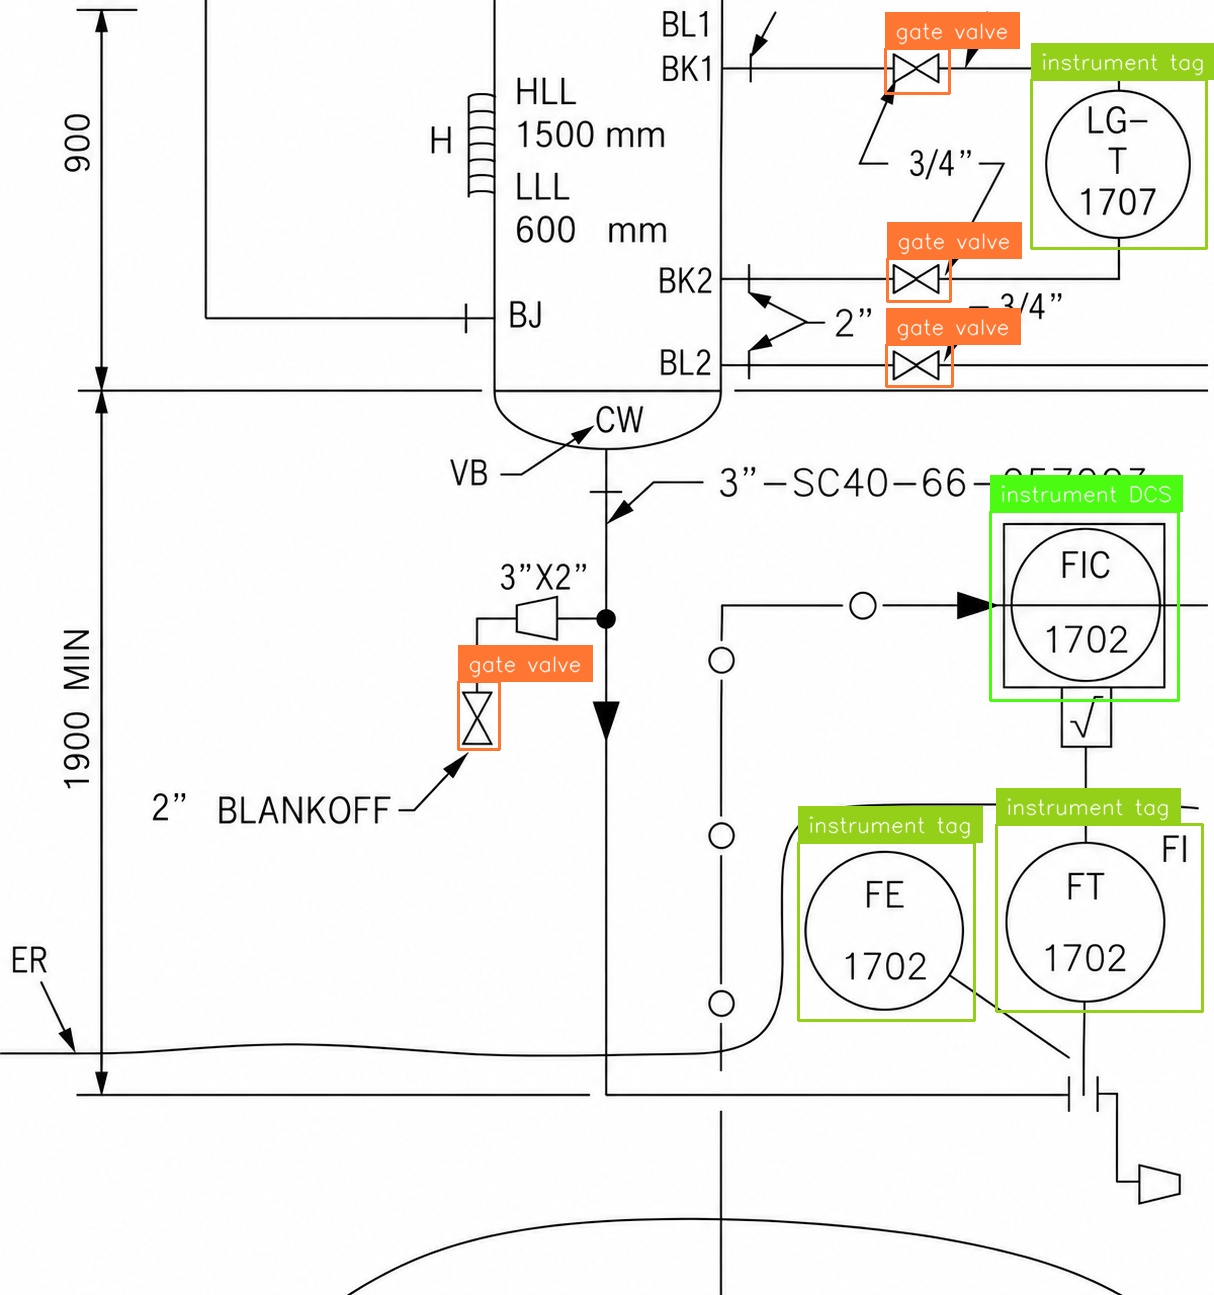
Next, connect the boxed image to a Label Visualization block and pass the original model predictions into the predictions input. Configure the label text to display the class name and use a compact text scale. This produces an annotated image containing the detected symbol locations and labels such as gate valve, heat exchanger, instrument tag, or page connection.
Step 5: Filter and Crop Instrument Regions
Create a second branch from the model predictions and add a Detections Filter block. Configure the filter to keep only:
- instrument tag
- instrument DCS
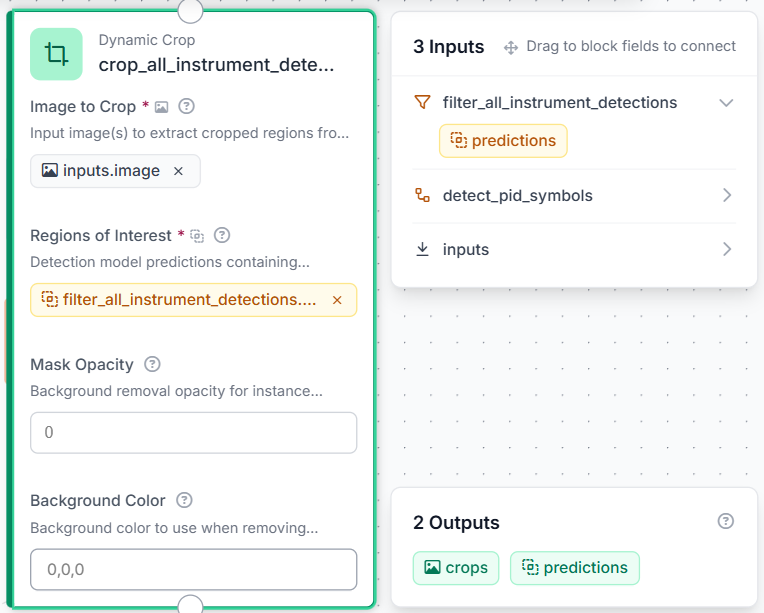
These are the regions most likely to contain identifiers or other useful instrument text. Filtering before OCR prevents the text-recognition model from processing every valve and connection symbol in the drawing.
Connect the filtered detections and the original image to a Dynamic Crop block. The block creates one crop for each matching detection. Using the original image rather than the annotated output ensures that bounding boxes and labels do not obscure the text sent to OCR.
Step 6: Read Instrument Text with GLM-OCR
Connect the crops to a GLM-OCR block and use the text-recognition task. The OCR block processes each crop independently and returns the text it can read.
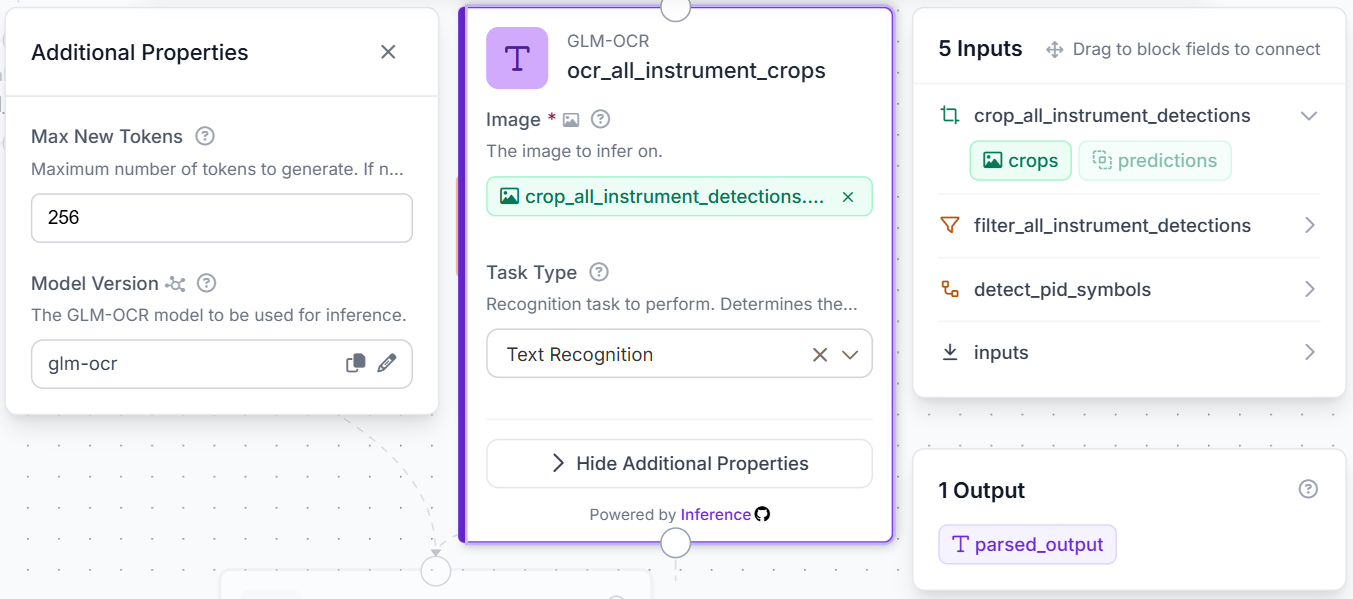
P&ID identifiers may include values such as FT 1702, FIC 1702, or LG-T 1707. Because instrument text is often small or arranged across multiple lines, the raw OCR output may contain line breaks, repeated spaces, or nested results.
Add a Dimension Collapse block after OCR to combine the per-crop outputs into one list.
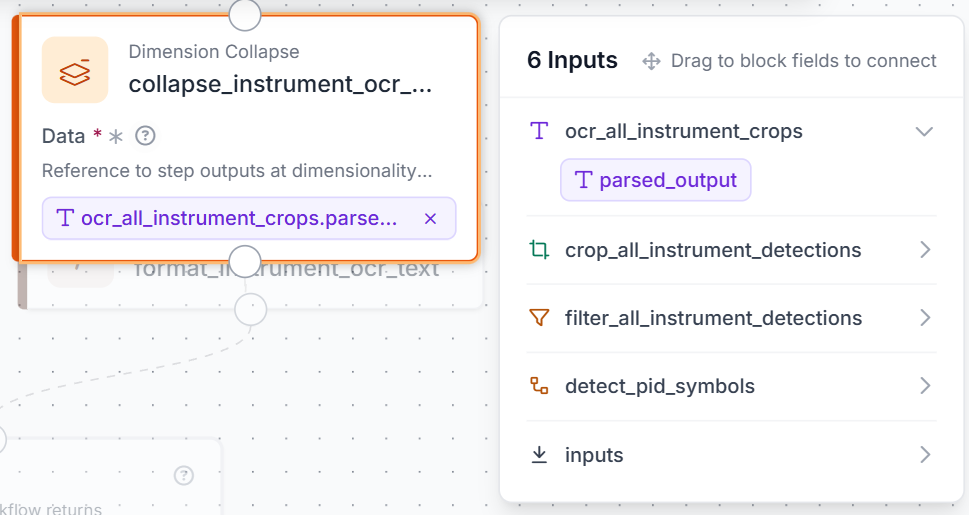
Then connect the collapsed results and filtered detections to the custom Format PID Tag OCR Labels block. The block converts each OCR result into a clean single-line string while preserving one output position for every filtered detection. Blank or missing OCR results are returned as unreadable, preventing later tags from being applied to the incorrect detections.
The code used:
def run(self, tag_detections, ocr_text):
    def to_items(value):
        if value is None:
            return []
        if isinstance(value, np.ndarray):
            return to_items(value.tolist())
        if isinstance(value, (list, tuple)):
            return list(value)
        return [value]

    def clean_one_line(value):
        if value is None:
            return ""
        if isinstance(value, np.ndarray):
            return clean_one_line(value.tolist())
        if isinstance(value, dict):
            parts = []
            for v in value.values():
                s = clean_one_line(v)
                if s:
                    parts.append(s)
            return " ".join(parts)
        if isinstance(value, (list, tuple, set)):
            parts = []
            for v in value:
                s = clean_one_line(v)
                if s:
                    parts.append(s)
            return " ".join(parts)
        s = str(value)
        s = s.replace("```json", " ").replace("```", " ")
        s = " ".join(s.replace("\r", " ").replace("\n", " ").replace("\t", " ").split())
        if s.lower() in ["none", "null", "[]", "{}"]:
            return ""
        return s

    raw_items = to_items(ocr_text)
    cleaned_texts = [clean_one_line(item) for item in raw_items]

    detection_count = len(tag_detections) if tag_detections is not None else 0
    if detection_count == 0:
        return {"instrument_text": []}

    output_text = []
    for i in range(detection_count):
        text = cleaned_texts[i] if i < len(cleaned_texts) else ""
        output_text.append(text if text else "unreadable")

    return {"instrument_text": output_text}
The custom block preserves OCR order, converts blank results to unreadable, and returns only instrument_text without modifying the detections.
Step 7: Configure the Workflow Outputs
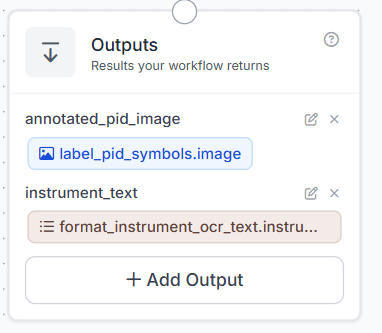
Configure two outputs:
- annotated_pid_image: the P&ID image with symbol bounding boxes and class labels
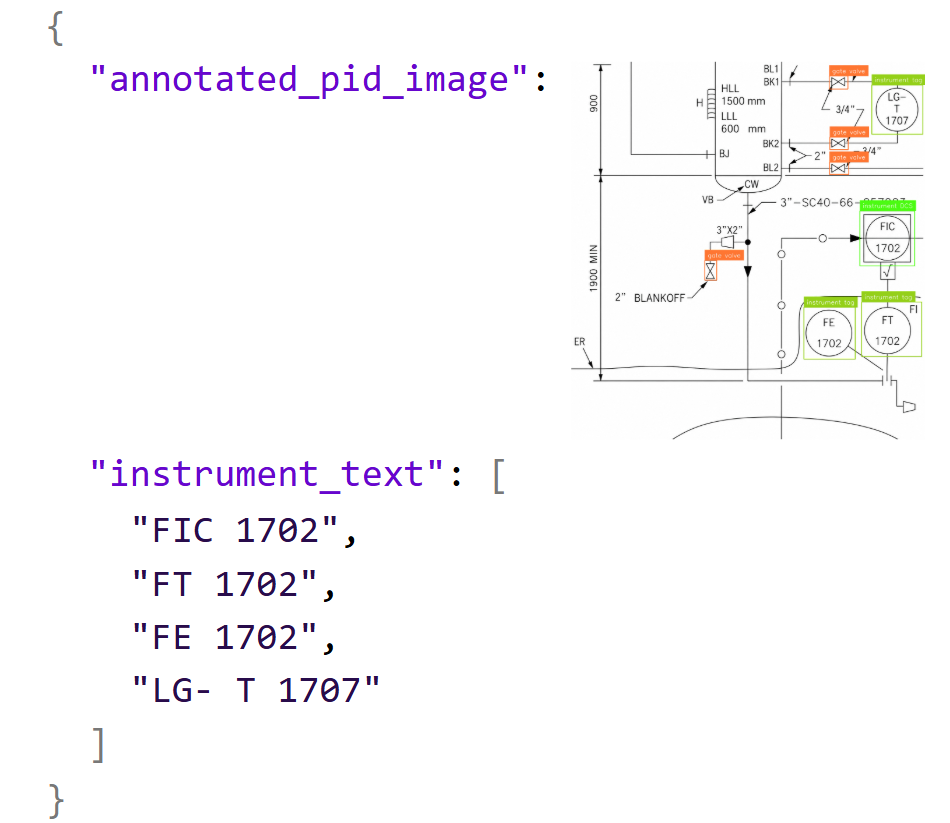
- instrument_text: the cleaned list of text extracted from the instrument tag and instrument DCS regions
This separation keeps the visual output readable while still returning machine-readable text that can be passed to another application, saved in a database, or compared with an equipment register.
Step 8: Test the Workflow
Click Run in the Workflow editor and upload a P&ID image. The model first detects all supported symbols. The visualization branch draws the boxes and labels, while the OCR branch processes only the detected instrument regions.
Review both outputs. Confirm that symbols are localized correctly and that OCR results match the text visible inside the corresponding instrument regions. Common failure cases include low-resolution scans, faint text, overlapping diagram lines, uncommon fonts, and crops that cut off part of an identifier.
The final output contains:
- An annotated drawing with detected P&ID symbols
- A list of recognized instrument text
Limitations and Ways to Improve the System
The model recognizes only the 11 classes represented in the training dataset. Pumps, tanks, compressors, additional instrument types, and many other common P&ID elements are outside its current vocabulary. Symbol conventions can also differ between organizations, industries, and drafting standards.
Object detection identifies individual elements but does not reconstruct the logic of the drawing. It does not determine which pipe connects to which valve, whether a control loop is complete, or whether the design is correct. Those tasks would require additional methods such as line detection, OCR across the full drawing, symbol-to-line association, and graph construction.
OCR quality depends heavily on crop resolution and text clarity. Performance can be improved by adding padding around instrument crops, training with higher-resolution image tiles, cleaning scans, or validating extracted tags against known naming patterns. For production use, results should remain subject to engineering review.
From Symbol Detection to Engineering Drawing Digitization
The workflow can be extended by counting detections by class, exporting symbol coordinates, or matching OCR text against an asset database. A downstream application could use the results to build searchable drawing indexes, compare revisions, or flag unreadable instrument tags for manual review.
A more advanced pipeline could combine symbol detection, full-page OCR, line tracing, and graph analysis to infer relationships between equipment and instruments. This would move the system from symbol detection toward structured P&ID digitization, but it would require substantially more data and validation.

Use Roboflow Agent
Roboflow Agent can assemble this Workflow from a prompt instead of block-by-block wiring. Describe the two branches in plain language ("visualize every detection with boxes and labels, then filter to instrument tag and instrument DCS, crop each one, and read the text with GLM-OCR") and Agent generates the connected blocks for you to review in the editor.
It's most useful for exactly the parts of this pipeline that are fiddly to wire by hand: the detections filter, the dynamic crop fed from the original image rather than the annotated one, and the dimension collapse after OCR. When your symbol set grows, ask Agent to add the new classes to the filter or swap in a retrained model, and it edits the Workflow in place.
Engineering Drawing Digitization Conclusion
In this tutorial, we trained an RF-DETR model to detect 11 P&ID symbol classes and deployed it in Roboflow Workflows. The workflow annotates detected symbols and uses GLM-OCR to extract text from instrument tags and instrument DCS regions.
Combining object detection with targeted OCR provides more useful output than symbol detection alone while keeping the pipeline focused and interpretable. The result can support P&ID indexing, document review, and digitization, but it should be used as an engineering aid rather than as an automated safety or compliance decision system.
Further reading


Cite this Post
Use the following entry to cite this post in your research:
Mostafa Ibrahim. (Aug 4, 2026). P&ID Symbol Detection for Engineering Drawing Digitization. Roboflow Blog: https://blog.roboflow.com/pid-symbol-detection/