
In Canadian oil and gas operations, regulators require companies to identify and notify landowners whose property falls within a proposed pipeline's consultation area, a task that traditionally meant manually digitizing house locations one by one in ArcGIS. This guest post by Douglas Long describes replacing that manual workflow with a computer vision model trained on satellite imagery to automatically detect structures, using Roboflow for dataset preparation and augmentation and both Roboflow Train and RF-DETR for model training. The trained model integrates back into ArcGIS via the Roboflow Inference API, automating the first-pass structure detection across any new land area that needs to be surveyed.
The below is a guest post by Douglas Long, a full stack developer in Calgary, Canada. Douglas previously worked in oil and gas.
In the oil and gas industry, providing advanced notification for the development of energy infrastructure is a regulatory requirement. New pipelines can overlap with private landowner property. In Canada, the specific notification varies by province, in general, the industry has to inform and consult all those "whose rights may be directly and adversely affected by the proposed applications."
That then results in the following three courses of action:
- The company will likely interpret whom to inform and consult based on the minimum consultation and notification requirements that the Alberta Energy Regulator has established.
- The company must have a face-to-face meeting or phone call with landowners in the required consultation area.
- The company must provide an information package and relevant Alberta Energy Regulator information and obtain confirmation of nonobjection from certain people depending on the type of project.
A Manual Process Absent Computer Vision
For a prior project on which I worked, I had to manually "digitize" the geographic points on all the locations of houses using Google Maps. The house points were added into a single data layer that oil and gas companies could use for the risk avoidance workflow described above when acquiring licenses to fracture or drill
The traditional workflow for this process involved doing the following:
- Identify the region to be mapped with ArcGIS (ArcMap)
- Create a shape file dataset of the homes
- Add a satellite image service to the map
- Manually pan around the areas of interest, identifying points of interests, and placing points down on all houses that would require notifications
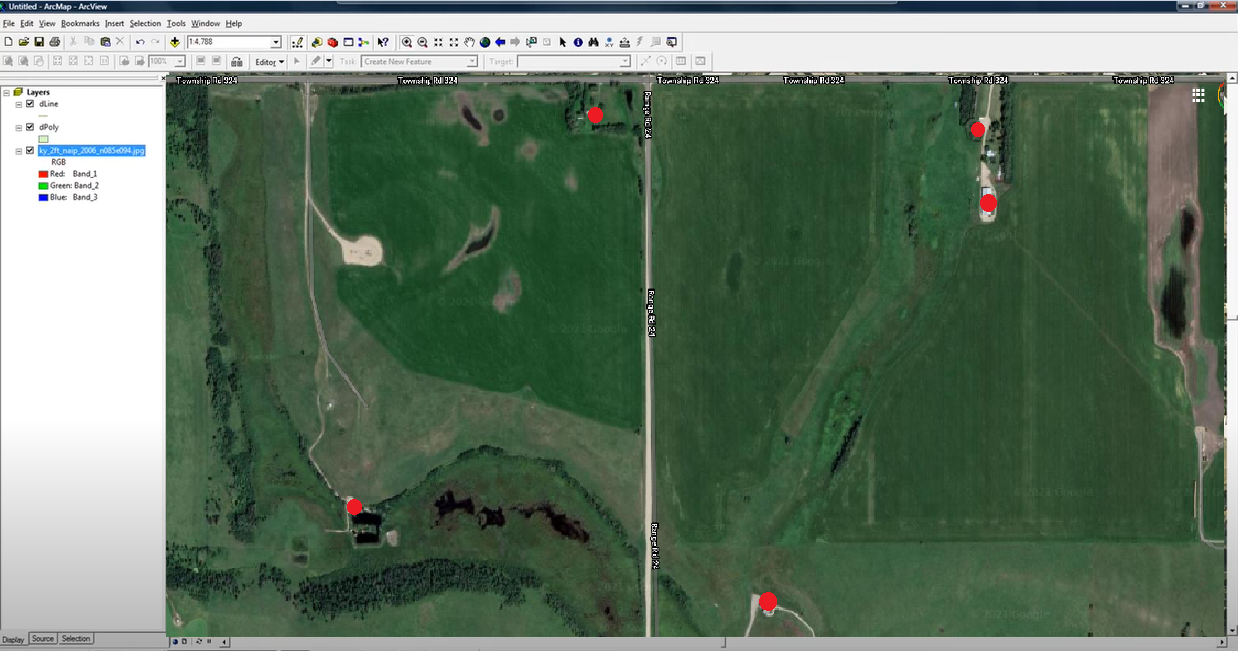
Red dotes like those above denote the points that had to be manually placed and saved. The points were effectively digitized in this workflow using ArcMap.
Reinventing the Workflow with Computer Vision
Computer vision enables the process for notifying affected homeowners to be reimagined in a means that creates significantly greater accuracy and improves efficiency along the way. Specifically, instead of manually panning across tens of thousands of land area and relying on the human eye to identify any structure of potential interest, we can develop and deploy a computer vision model that identifies homes within a given region that we then need to notify.
Let's tech a step-by-step technical look at an example of how would work. The process of creating and deploying a computer vision model for structure identification generally follows four steps:
- Source relevant images of structures in a given region
- Annotate the images to teach the model what it is we want to look for in them
- Train the model
- Deploy the model so we can use it to automate structure detections in a new region
(Note: because I can't use the exact dataset from the given company in the below example, I've pulled images from an area in North Dakota.)
Setup
You'll need a few specific Python packages we'll use: earthengine-api, geetools, and we'll use Roboflow for data management.
Acquiring Data
We have to decide what it is we want to detect and collect data of those objects. For this example, we're going to be detecting homes in a rural areas. As noted, the dataset we're going to use for this public example is of an area in North Dakota.
For collecting images from Google Maps, the folks over at Roboflow have written an excellent tutorial on the step-by-step for how to use Google Earth Engine and Python to export images:

Select an Area
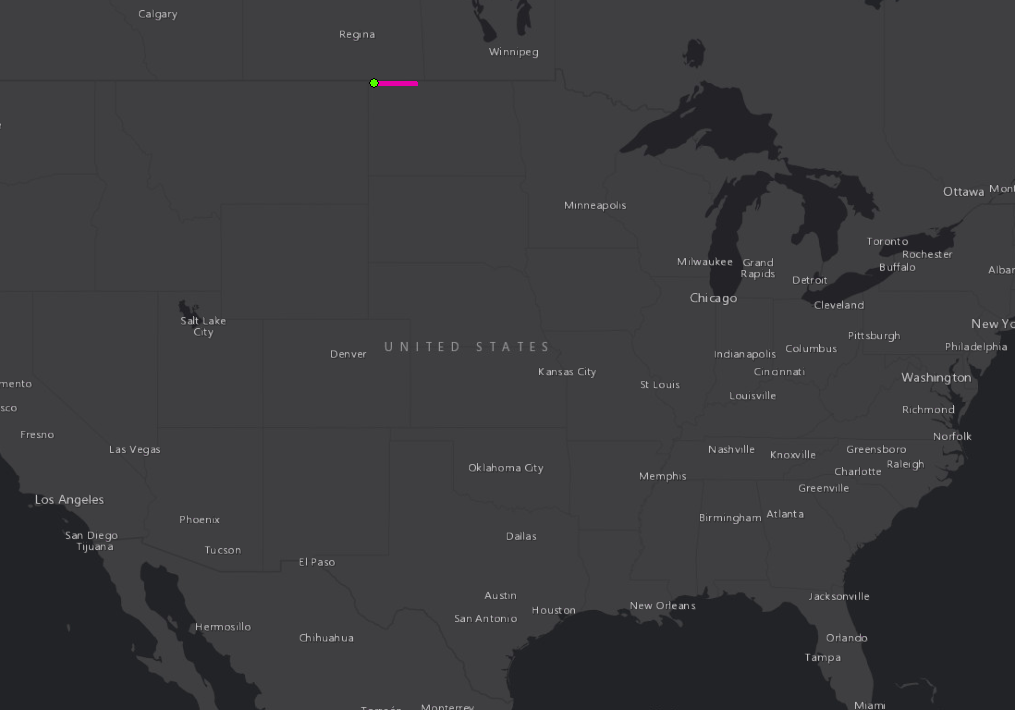
I chose the surrounding area of Fortuna North Dakota – roughly ~225 km x ~4 km
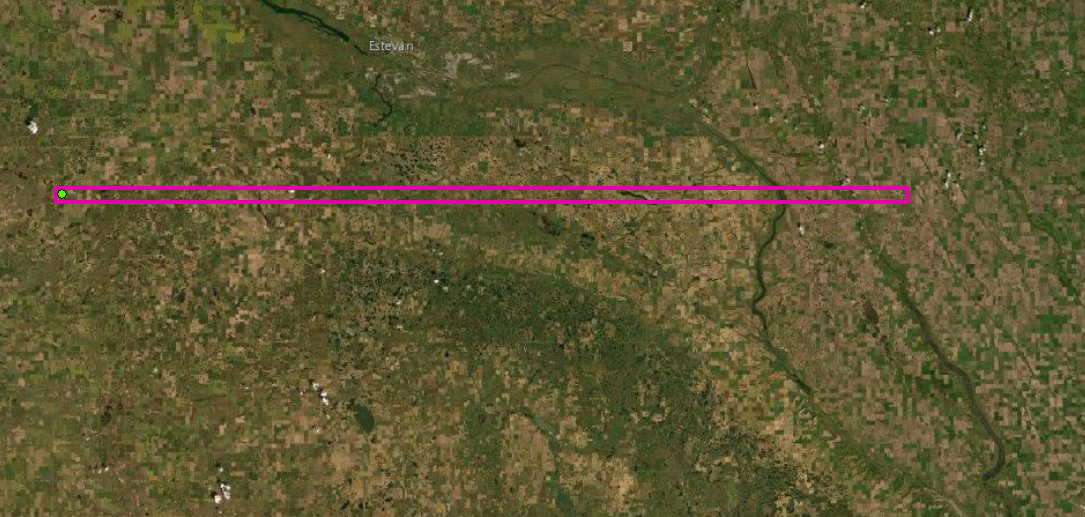
The exact (x,y) coordinates I pulled are:
x = -103.775817
y = 48.9101549
For context, here's an overview map of what the area looks like:
Exporting the Images
Once we have the area selected, we need to export the images so we can use them to annotate and build a computer vision model.
I used a Google Colab notebook outlined in the above post on exporting images from Google Earth Engine: https://colab.research.google.com/drive/1HCkhkV47thWhq6XY79erMVM-Y2Bkp2Jb?usp=sharing
(Note: the export process takes a long time, so my suggestion: kick it off, go have a beer, and sleep on it.)
Preparing Image Data and Annotation
At this stage, we have our images for our geographic area of interest. At this step, we need to format the images properly and annotate them before training a model.
Formatting Images
The images come exported as geoTiffs, which are spatially referenced. And, in my case, the raw file size of all the output images as about 2 GB. We need the images to be PNG or JPEG. I converted to PNG – be sure that when you convert the images, you specify to set 8_BIT_UNSIGNED. (In my case, I used ESRI (ArcGIS) to convert. There are many tools out there, and this was the one available to me.)
Annotating Images
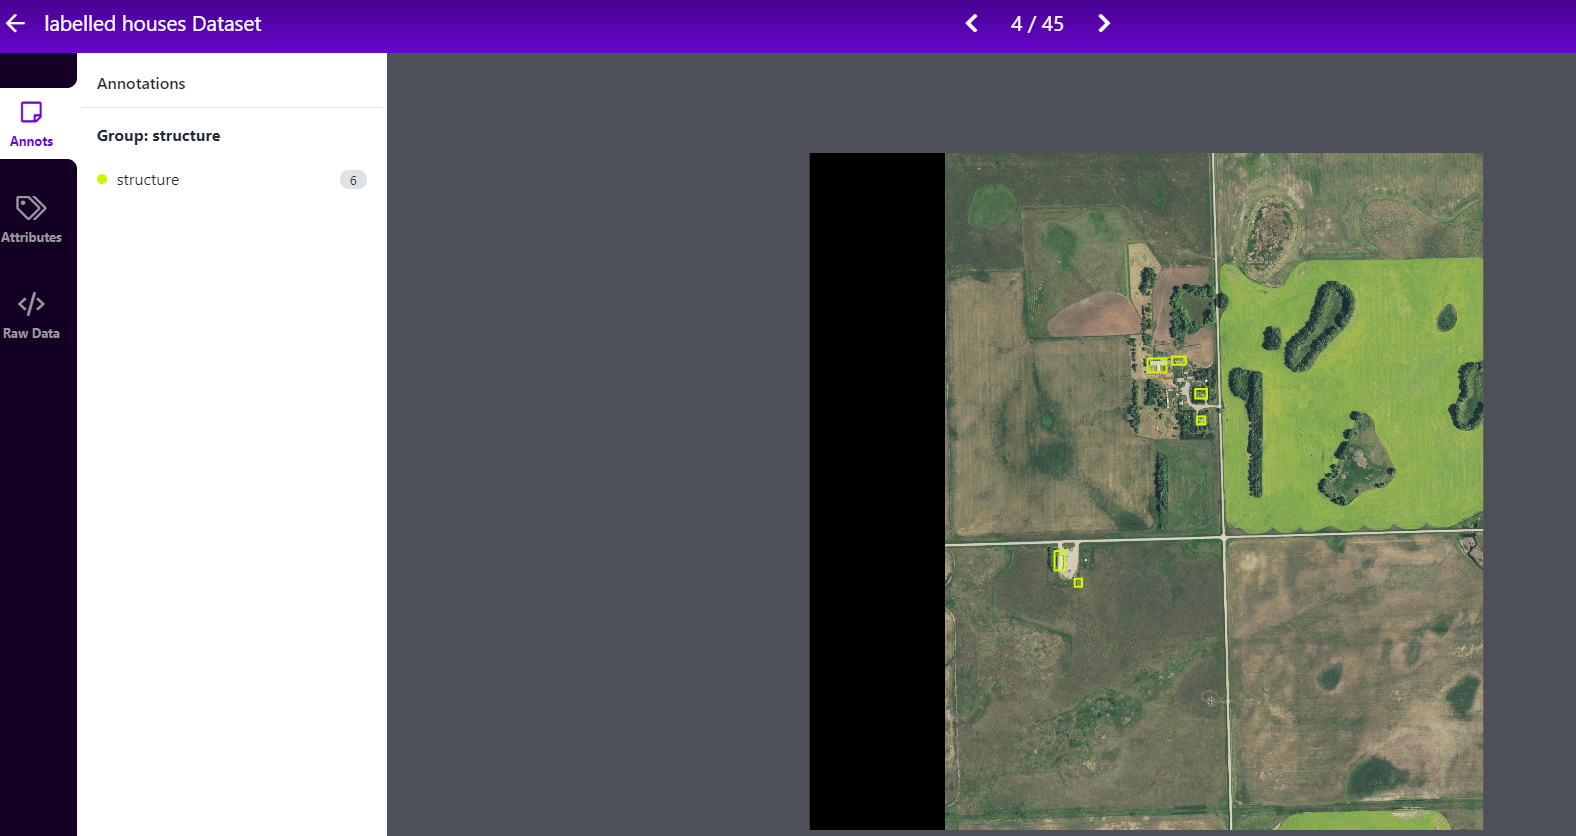
To annotate images, load them into Roboflow. I labeled all structures I saw as a single annotation class: structure.
As it relates to labeling tips, be sure to label all objects and create tight bounding boxes. I followed these tips on how to label images for object detection:
In my case, I ultimately ended up labeling 999 structures across 234 images.
Dataset Preparation
Once all images are annotated, we can take advantage of image augmentation to increase the size and variety of our image dataset. Image augmentation creates additional images from our ground truth images, which allows our model to generalize to varied conditions. For example, randomly altering the brightness of the satellite images is a good way to simulate that the amount of sun exposure could vary.
The Roboflow team has also written on image augmentations for aerial datasets specifically, so knowing which options to select is easier:
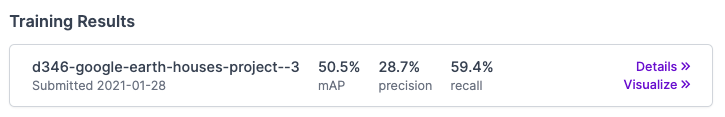
Model Training
Once I had my data prepared, I was able to train a model.
I was able to use Roboflow Train on my dataset as well as training RF-DETR with Google Colab for my results. (For the latter, I followed this RF-DETR training guide.)
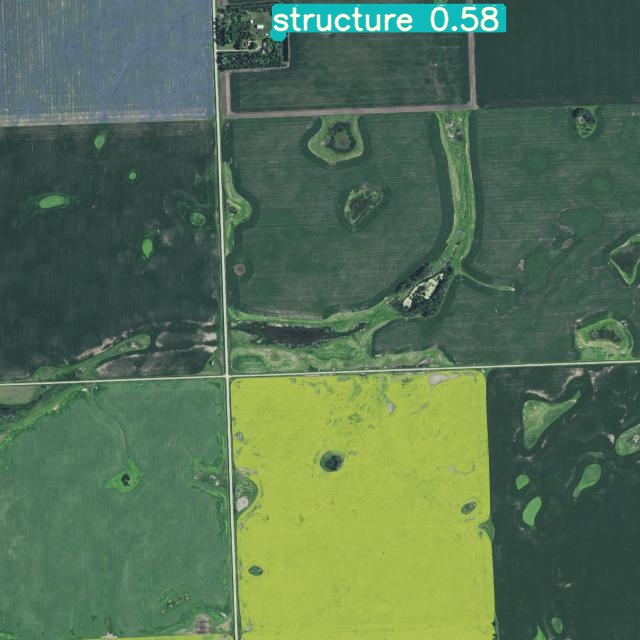
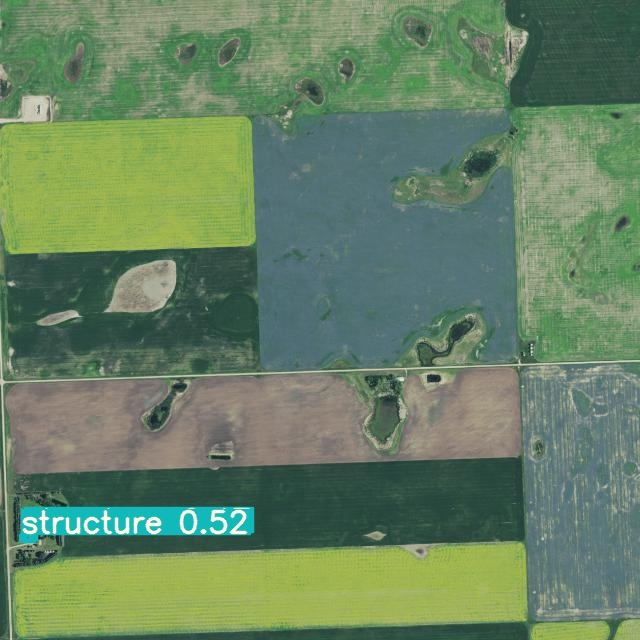
Output (Using Our Model)
Once the model finishes training, it can be used to automatically identify structures in images without human intervention. Here's a few examples of my model working on example structures:
Because I also trained my model with Roboflow Train, I also have a production ready API I can use to pass new images to my model for analysis. For the next area I land area I need to analyze, I'll have the model take a first pass at identifying where all the structures of interest could be. I'd use ArcGIS to make an API call to the Roboflow Inference API and return back any potential structure detections.
Voila! My process for identifying potential structures of interest when building energy infrastructure is automated, less errors prone, and faster.
Cite this Post
Use the following entry to cite this post in your research:
Joseph Nelson. (May 19, 2021). How Computer Vision Streamlines Risk Avoidance Workflows in Oil & Gas. Roboflow Blog: https://blog.roboflow.com/computer-vision-satellite-imagery-energy/