
In this blog post, we will learn how to build a computer vision project to identify, classify, and measure the size of fish in an image.
Accurately measuring fish size helps in estimating the population and health of fish stocks, aiding in sustainable fisheries management. This can also help ensure compliance with legal size limits, helping to regulate catch sizes and prevent overfishing.
Furthermore, automated size measurement allows for continuous monitoring of fish growth, optimizing feeding schedules and improving overall farm productivity.
Let’s get started building our application.
Identifying fish species and measuring fish sizes
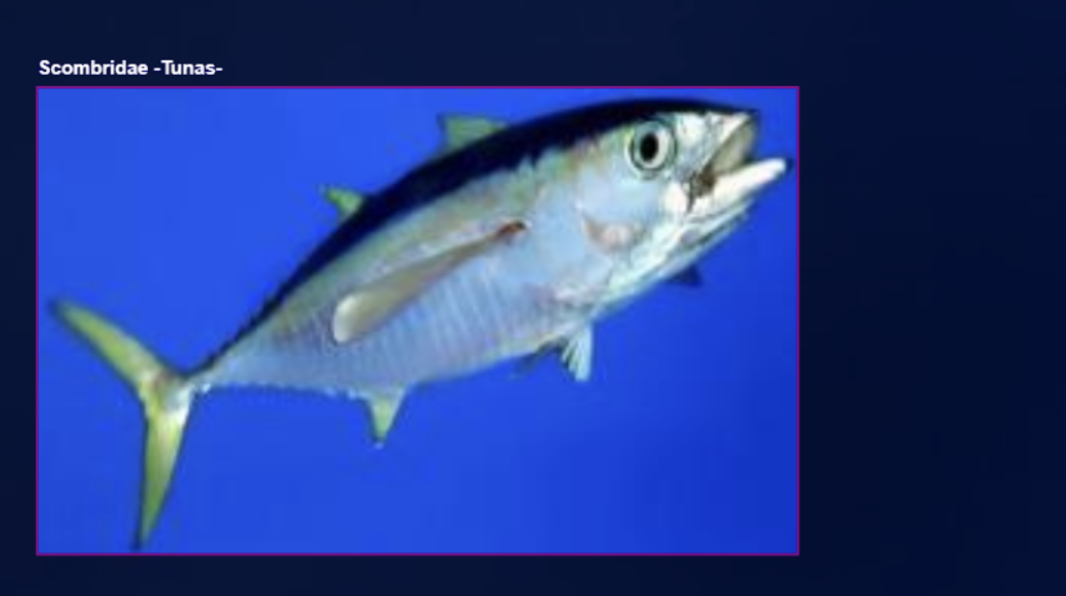
To identify fish species, we are going to train a computer vision model that can find the location of fish in an image. This is done by collecting images of fish, then labeling each fish with a bounding box or polygon tool that encloses the fish. The species is assigned as the class label for that bounding box or polygon. Following is an example of using a bounding box to label fish species from Roboflow Fish Dataset.
There are several methods to identify fish size, such as using keypoint detection, stereo vision and segmentation based methods.
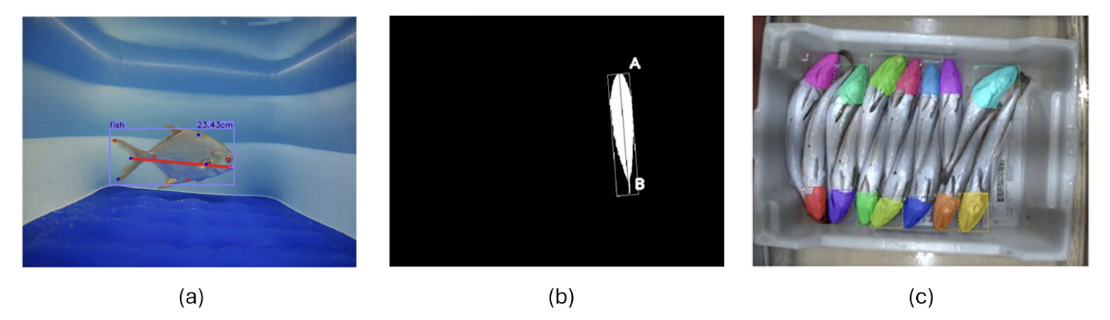
In this project, we will use the object detection approach, which can run in close to real time. We will determine fish size based on its visual appearance.
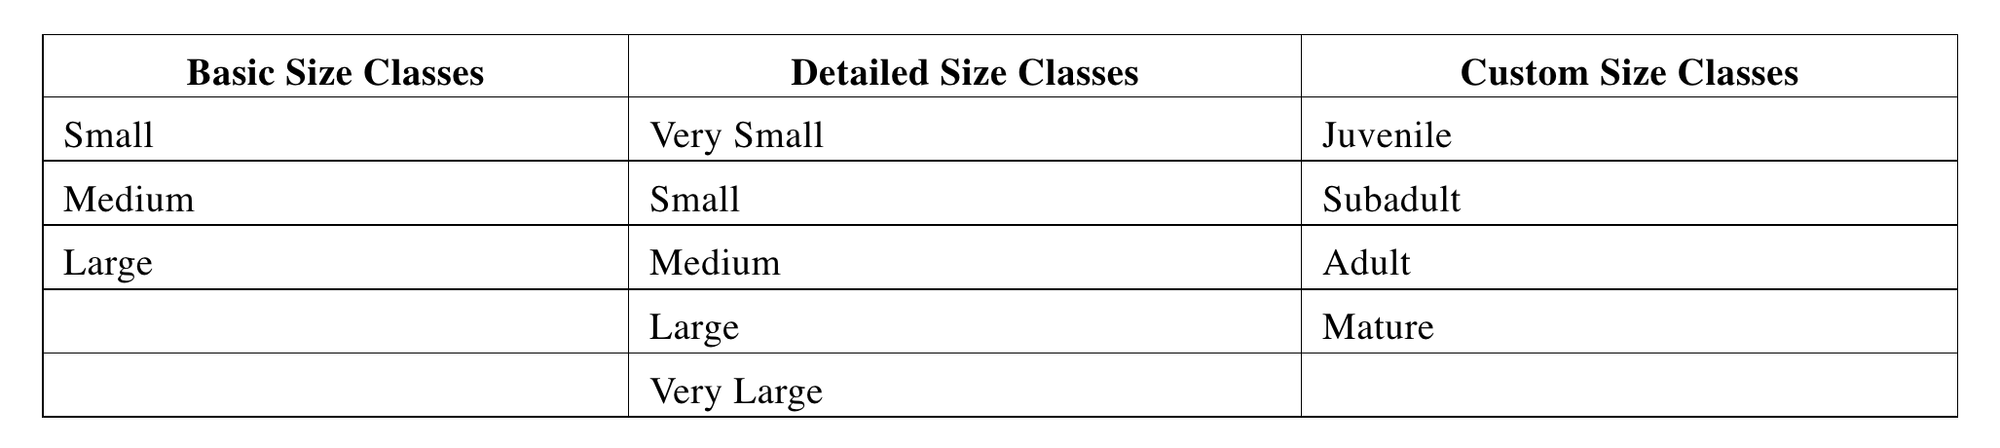
The process begins with identifying the fish species, followed by measuring its size. Multiple size classes can be defined for each species. Here are some common examples and considerations for size classification:
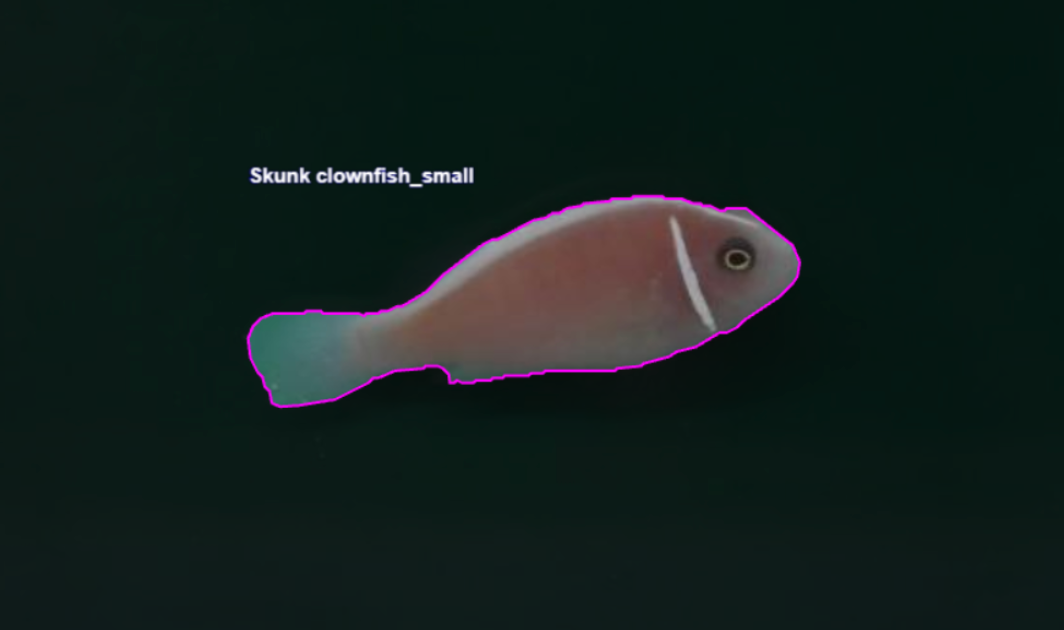
These size classes can be correlated with actual physical measurements. In our example, we categorize two fish species, Saddleback and Pink Skunk, into two basic size classes: small and large/big (as shown in the following images).
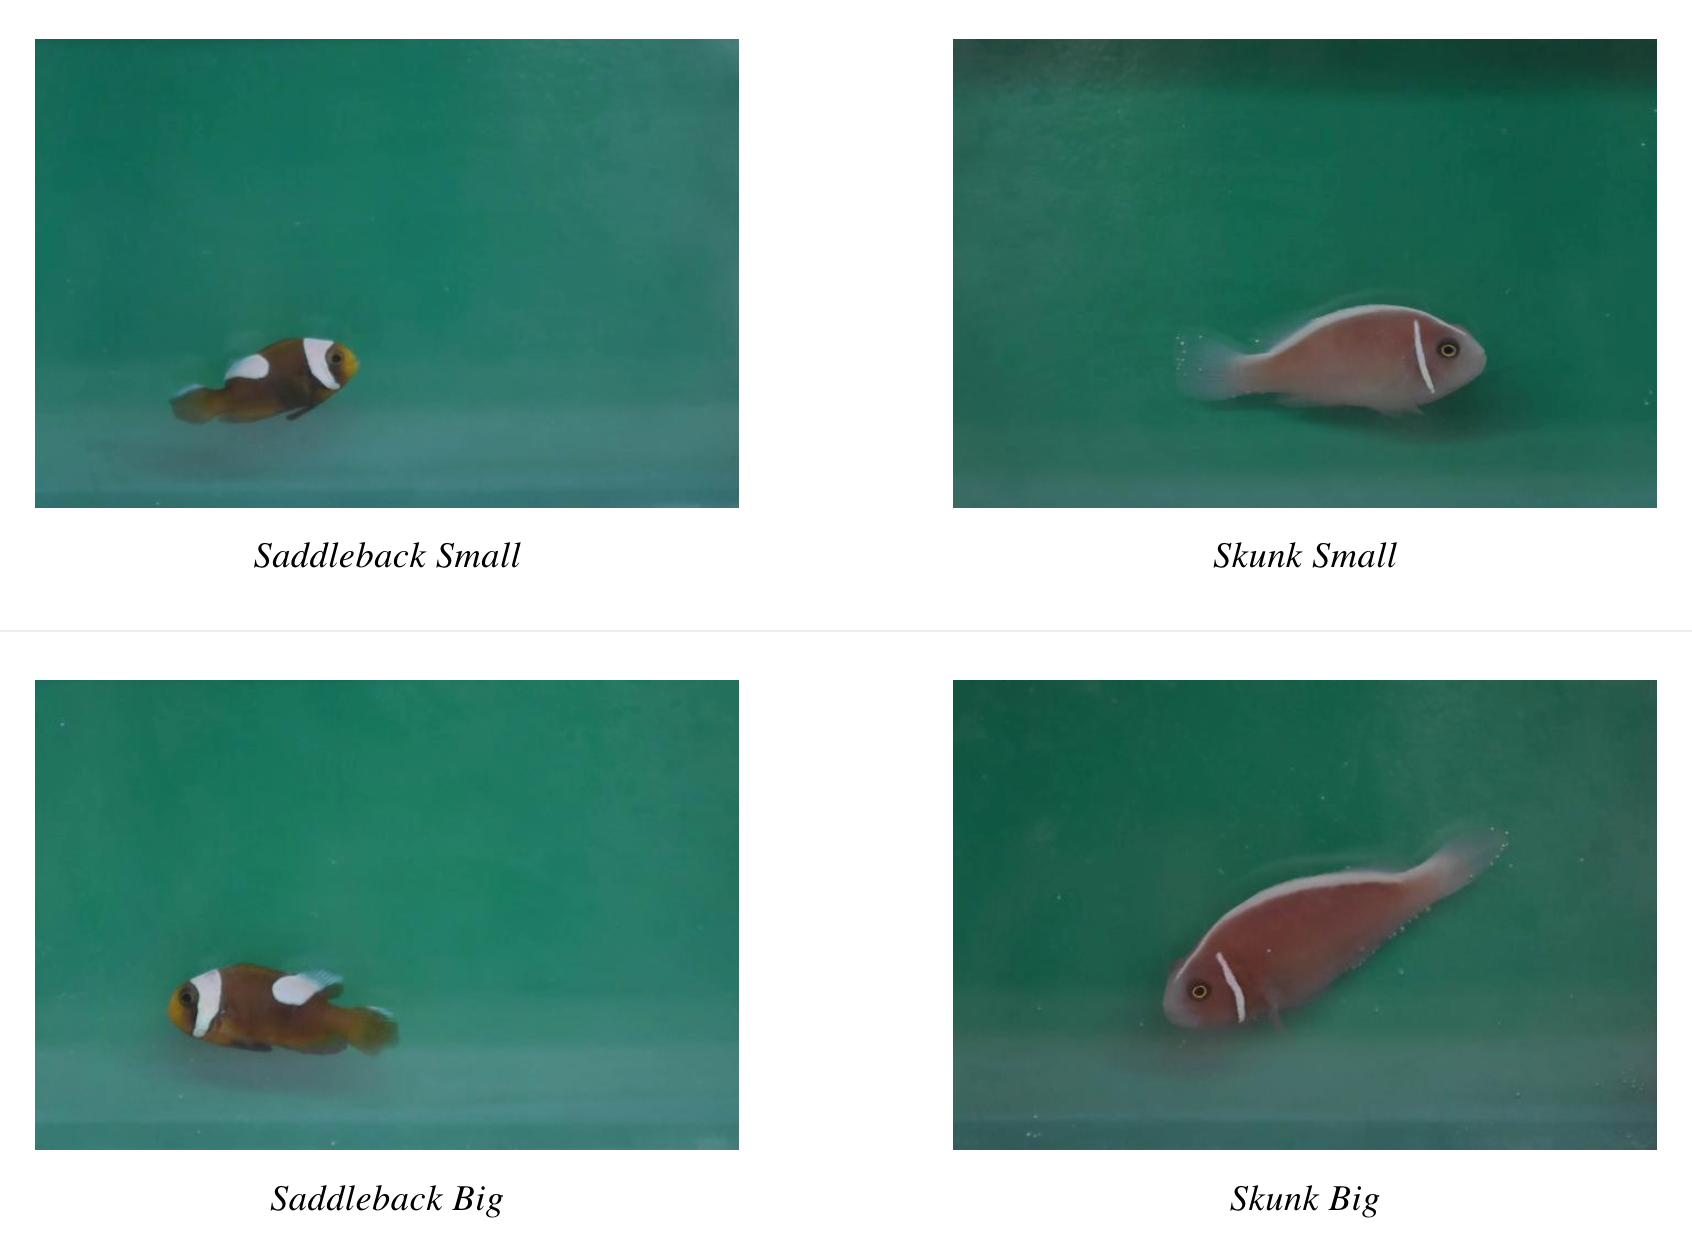
The images above demonstrate how fish species and sizes can be visually identified (i.e. Saddleback small and Saddleback big can be classified from its physical appearances and similarly Skunk small and big). Similarly, the dataset of different fish species with varying sizes (i.e. small, medium, big etc.) can be collected and used to label and train a computer vision model.
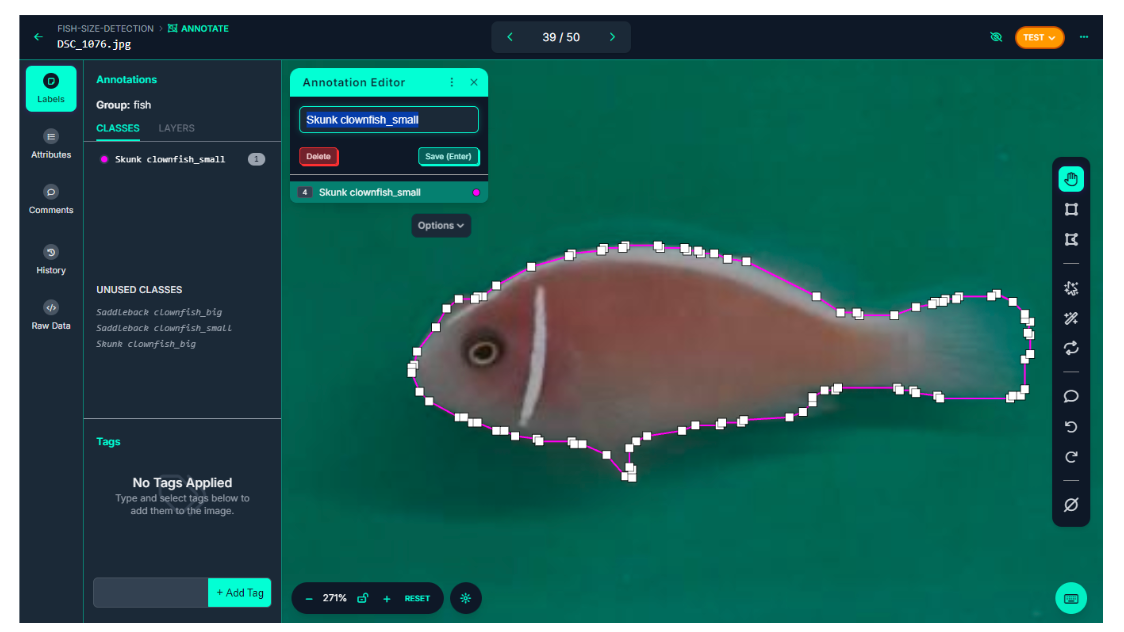
In our project, we will use the Roboflow polygon tool to annotate fish in the image (see figure below) for training object detection models.
We will label each species and size classes to train the object detection model to automated species classification and fish size categorization. This has valuable applications in areas such as fisheries management and commercial sorting.
Steps for creating the fish size measurement system
We will follow the three simple steps outlined below to quickly build this project.
- Prepare the dataset
- Train an object detection model
- Build an application that uses our model and returns the size of fish
Step #1: Prepare the dataset
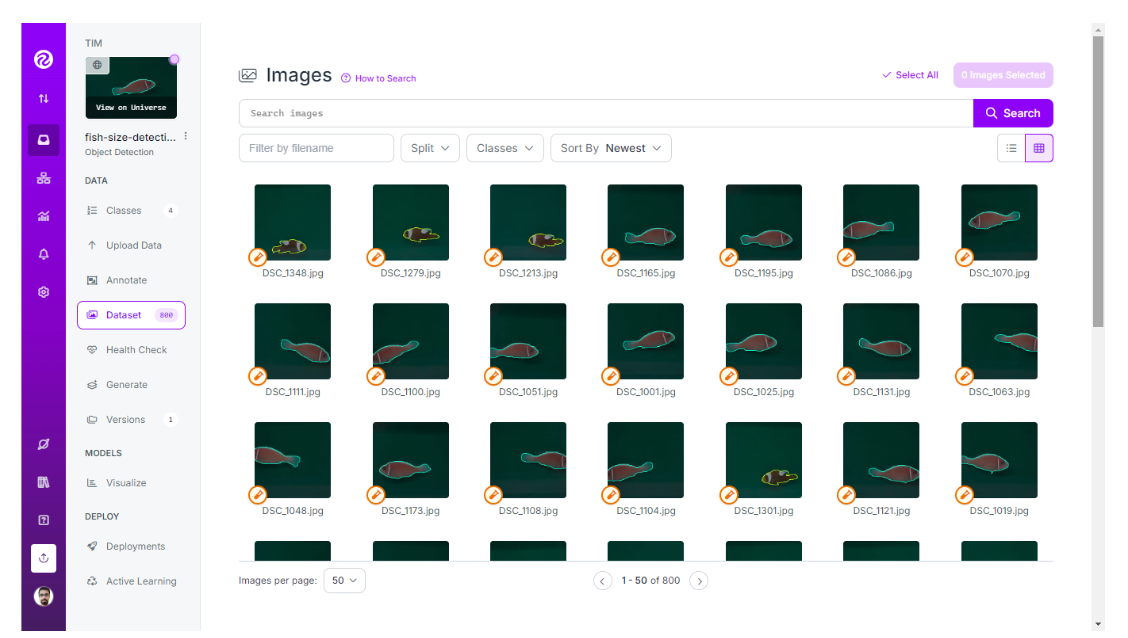
Preparing a dataset is a crucial step in building any computer vision model. For this project I use Measure the size of the fish computer vision project dataset from Roboflow Universe. I have downloaded the dataset images and created my own object detection project (named fish-size-detection) and uploaded all images to this project workspace.
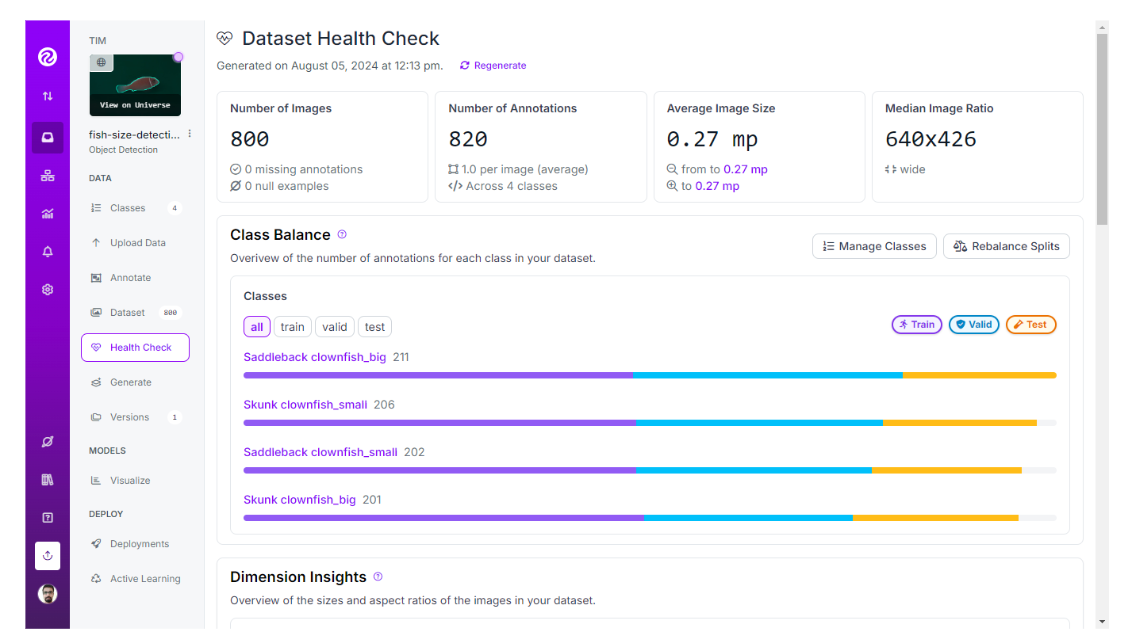
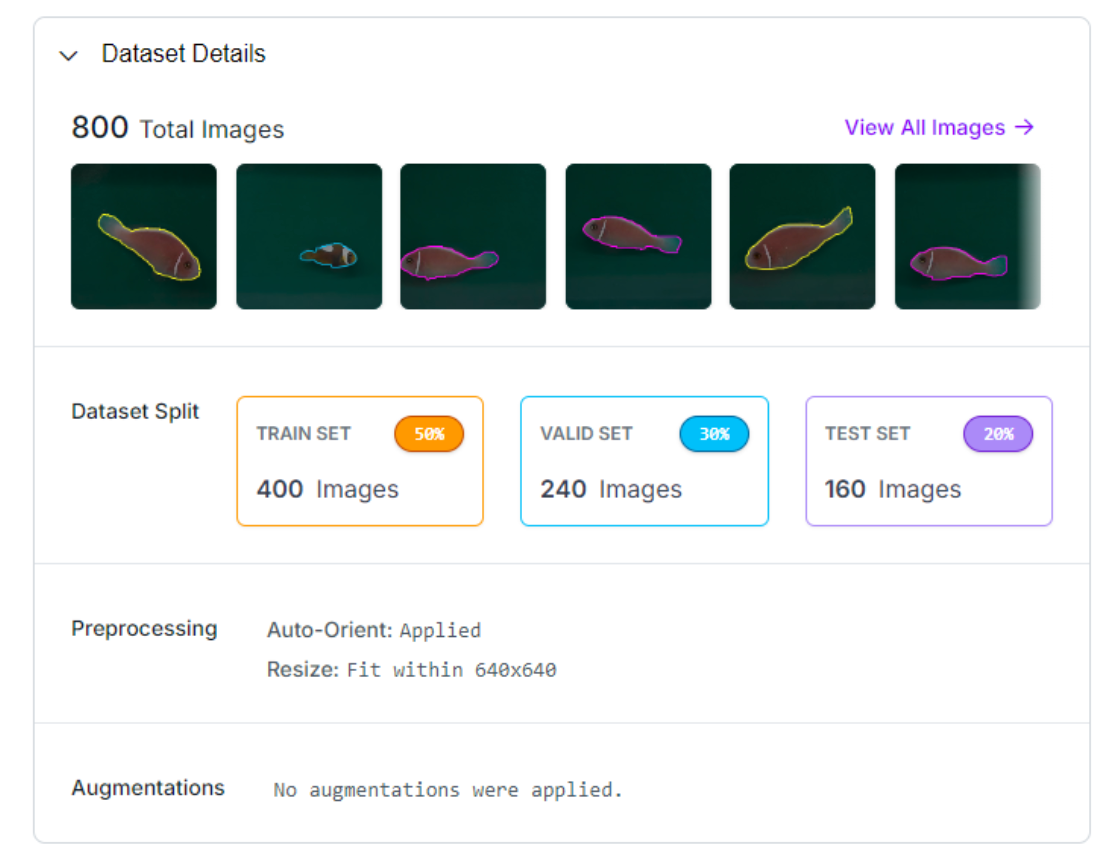
You can use the Roboflow dataset health check option to assess and improve the quality of your dataset. It offers a range of statistics about the dataset associated with a project.
All the images in the dataset are labelled for object detection using the polygon tool as shown in the image below. Follow the Roboflow polygon annotation guide to learn more about polygon annotation.
I have then generated the dataset version. A dataset version must be generated before it is trained. You can generate a dataset version by using the “Generate” tab and “Create New Version” option in the Roboflow interface.
Step #2: Train an object detection model
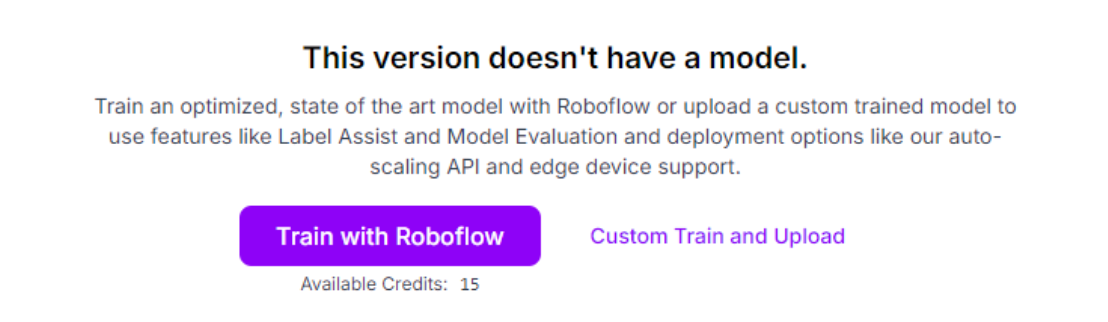
Once the dataset version is generated, you can use the Roboflow auto training option to train the most accurate computer vision model. To train, first click the “Train with Roboflow” button.
Then choose Roboflow 3.0:
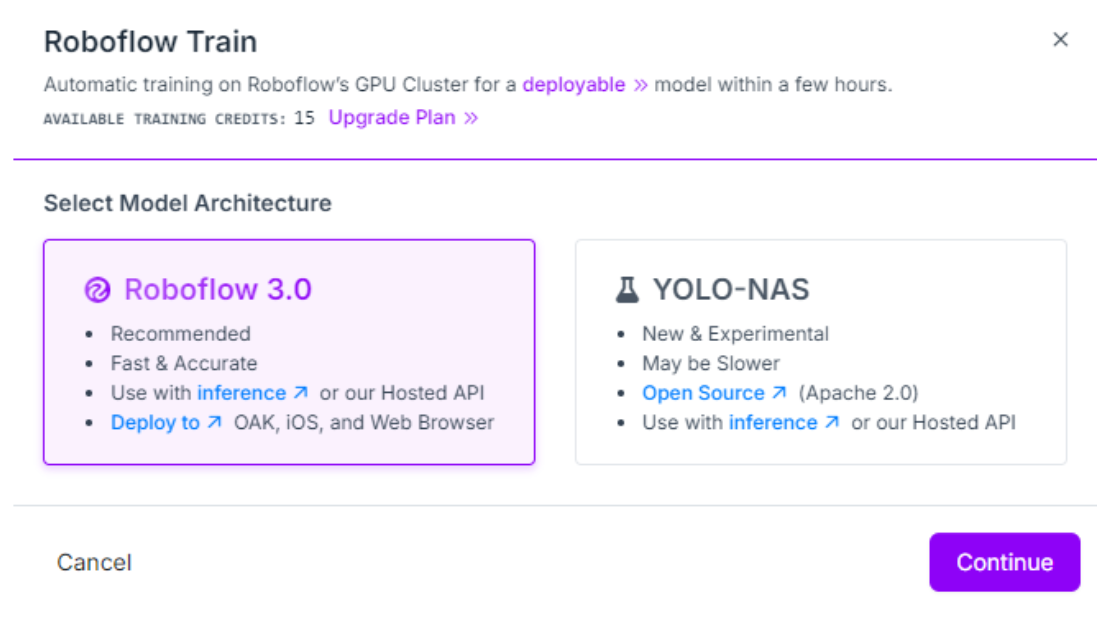
Choose Fast->Train from the public checkpoint and click “Start Training”, the Roboflow will train the model.
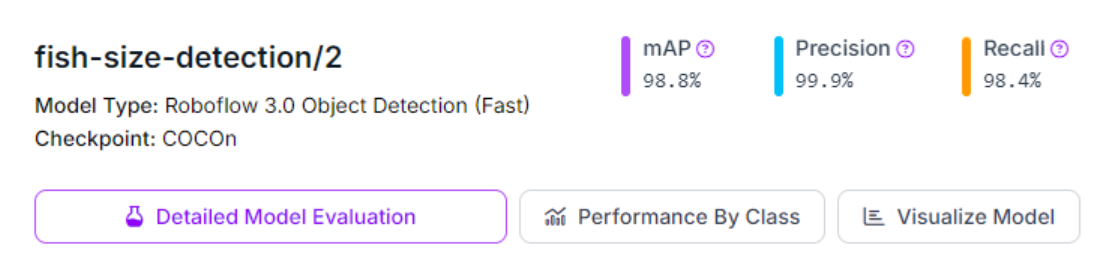
When the model training is completed you will see the modal metrics and the model will be made available for inferencing on Roboflow platform as well as via Roboflow inference API.
You may test the model from the “Visualize” tab.
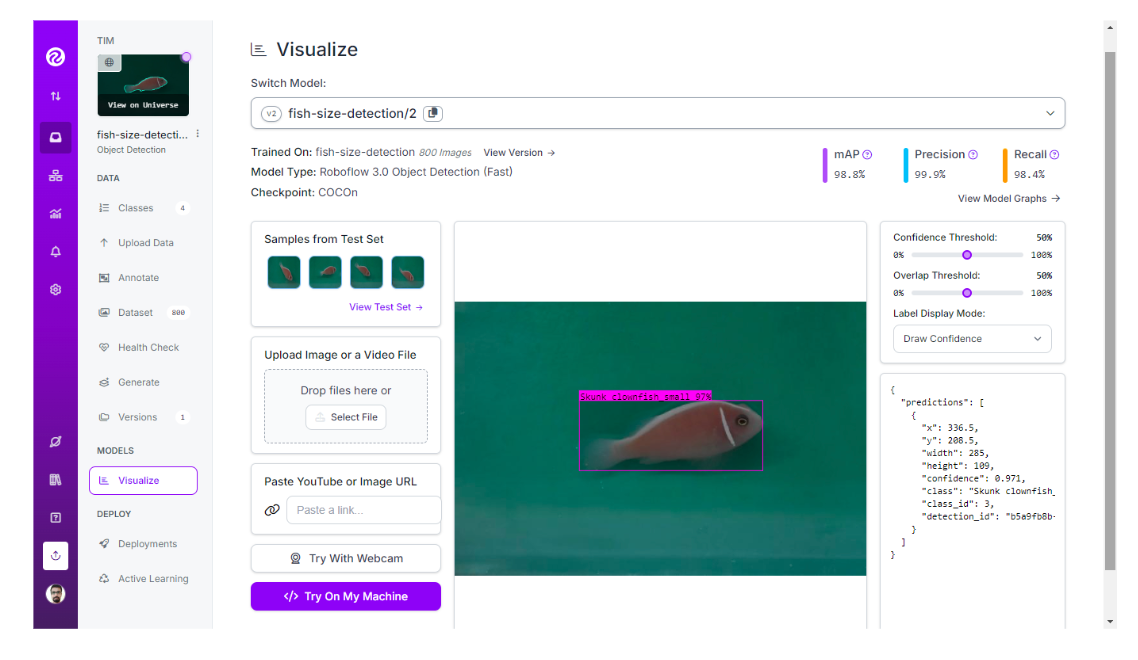
The trained model is available here. You can use the model yourself with the example below, or train your own model.
Step #3: Build inferencing application
This is the final step. In this step we will build a web application using Gradio. The application will allow us to either upload an image or capture it through a camera. The application then communicates with our computer vision model (trained using Roboflow in the previous step) to run prediction and then display the resultant image.
Here is the code for our application:
# import the necessary libraries
from inference_sdk import InferenceHTTPClient, InferenceConfiguration
import gradio as gr
from PIL import Image, ImageDraw, ImageFont
import os
# initialize the client
CLIENT = InferenceHTTPClient(
api_url="https://detect.roboflow.com",
api_key="ROBOFLOW_API_KEY"
)
# define a prediction function to infer on an image
def infer_image(image, confidence=0.5, iou_threshold=0.5):
# save the uploaded or captured image to a file
image_path = "uploaded_image.jpg"
image.save(image_path)
# set custom configuration
custom_configuration = InferenceConfiguration(confidence_threshold=confidence, iou_threshold=iou_threshold)
# infer on the image using the client
with CLIENT.use_configuration(custom_configuration):
result = CLIENT.infer(image_path, model_id="fish-size-detection/2")
# extract predictions
predictions = result.get('predictions', [])
# define a color map for different classes of the model
class_colors = {
"Skunk clownfish_small": "red",
"Saddleback clownfish_big": "blue",
"Saddleback clownfish_small": "yellow",
"Skunk clownfish_big": "green"
}
# draw bounding boxes on the image
draw = ImageDraw.Draw(image)
try:
font = ImageFont.truetype("arial.ttf", 20)
except IOError:
font = ImageFont.load_default()
for pred in predictions:
x = pred['x']
y = pred['y']
width = pred['width']
height = pred['height']
left = x - width / 2
top = y - height / 2
right = x + width / 2
bottom = y + height / 2
# get the color for the class
color = class_colors.get(pred['class'], "green") # default to green if class is not in the color map
draw.rectangle([left, top, right, bottom], outline=color, width=3)
# Draw the label
label = f"{pred['class']} ({pred['confidence']:.2f})"
text_size = draw.textbbox((0, 0), label, font=font)
text_width = text_size[2] - text_size[0]
text_height = text_size[3] - text_size[1]
text_background = [(left, top - text_height - 4), (left + text_width + 4, top)]
draw.rectangle(text_background, fill=color)
draw.text((left + 2, top - text_height - 2), label, fill="white", font=font)
return image
# Create the Gradio interface
iface = gr.Interface(
fn=infer_image,
inputs=[
gr.Image(type="pil", label="Upload or Capture Image"),
gr.Slider(0.0, 1.0, value=0.5, step=0.1, label="Confidence Threshold"),
gr.Slider(0.0, 1.0, value=0.5, step=0.1, label="IoU Threshold")
],
outputs=gr.Image(type="pil", label="Image with Bounding Boxes"),
title="Fish Size Detection",
description="Upload or capture an image to detect fish size and class using Roboflow model. Adjust confidence and IoU thresholds using the sliders."
)
# Launch the app
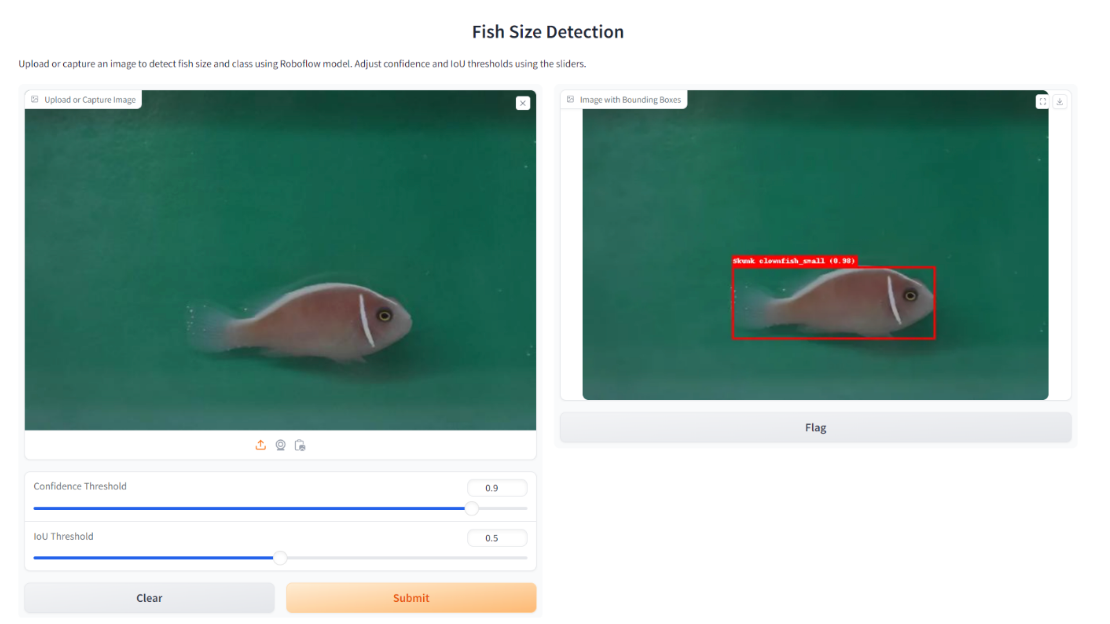
iface.launch()This Python script creates a Gradio app that allows users to upload or capture an image and detect fish sizes using a pre-trained model from Roboflow.
The app uses the InferenceHTTPClient from the inference-sdk to perform the image inference, drawing bounding boxes around detected fish and labeling them with their respective classes and confidence scores.
Users can adjust the confidence threshold and Intersection over Union (IoU) threshold using sliders to control the detection sensitivity. The output is the original image overlaid with bounding boxes and labels, displayed directly within the Gradio interface. Running the app will show following output.
Conclusion
Fish size detection using computer vision enhances the efficiency of data collection in fisheries, aquaculture, and marine research, enabling real-time monitoring and analysis. It supports sustainable fishing practices by helping to enforce size limits and track fish populations, contributing to better resource management.
Here are a few other blog posts on the topic of fish detection and computer vision that you may enjoy reading:
Cite this Post
Use the following entry to cite this post in your research:
Timothy M. (Aug 15, 2024). Measure Fish Size using Computer Vision. Roboflow Blog: https://blog.roboflow.com/measure-fish-size-using-computer-vision/