
When you are managing an industrial facility, you may want to monitor specific "red zones" to ensure that people only go in and out when it is safe to do so.
In this guide, we are going to walk through how to build a red zone monitoring solution with Roboflow Workflows, a web-based computer vision appliaction builder.
We will create a tool that tracks people and vehicles entering a designated zone. This can then be run on camera feeds of your industrial facility. Here is an example of the system in action:
This guide also has an accompaying YouTube video:
Without further ado, let's get started!
Step #1: Create a Workflow
First, create a free Roboflow account. Then, click Workflows in the left sidebar of your Roboflow dashboard. Click "Create a Workflow".
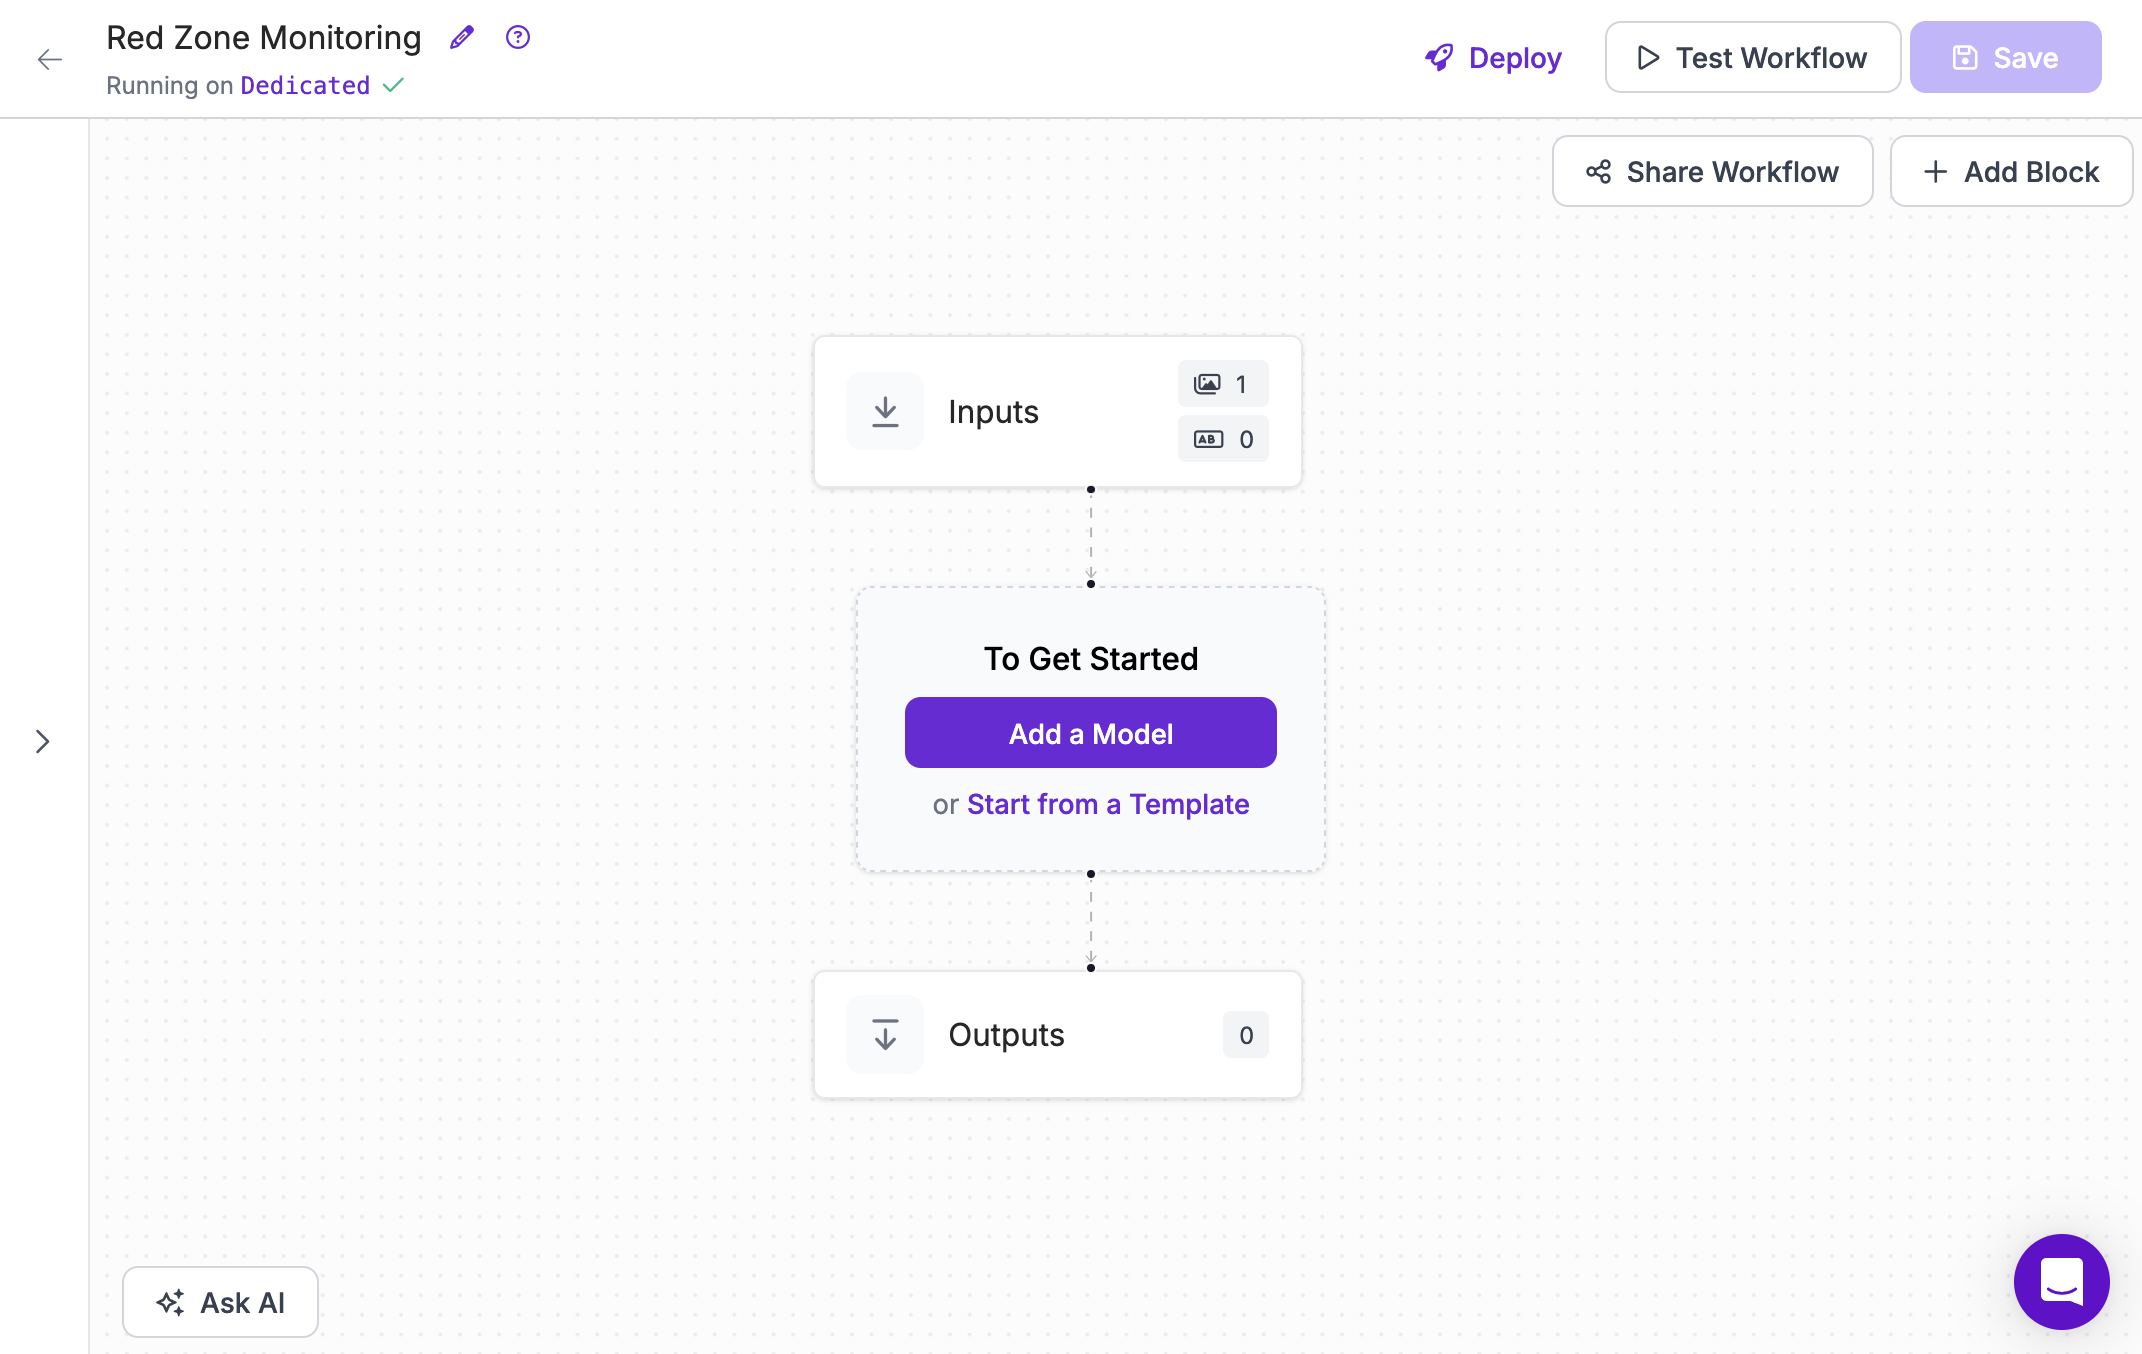
You will be taken to a blank Workflow editor in which you can start building your application:
Step #2: Add a Model
We need a model that can detect people and vehicles. For this guide, we are going to use a model trained on the Microsoft COCO dataset. This dataset can identify people, cars, trucks, and more. View a full list of the classes that are in the Microsoft COCO dataset.
Click "Add a Model", then choose "Object Detection Model":
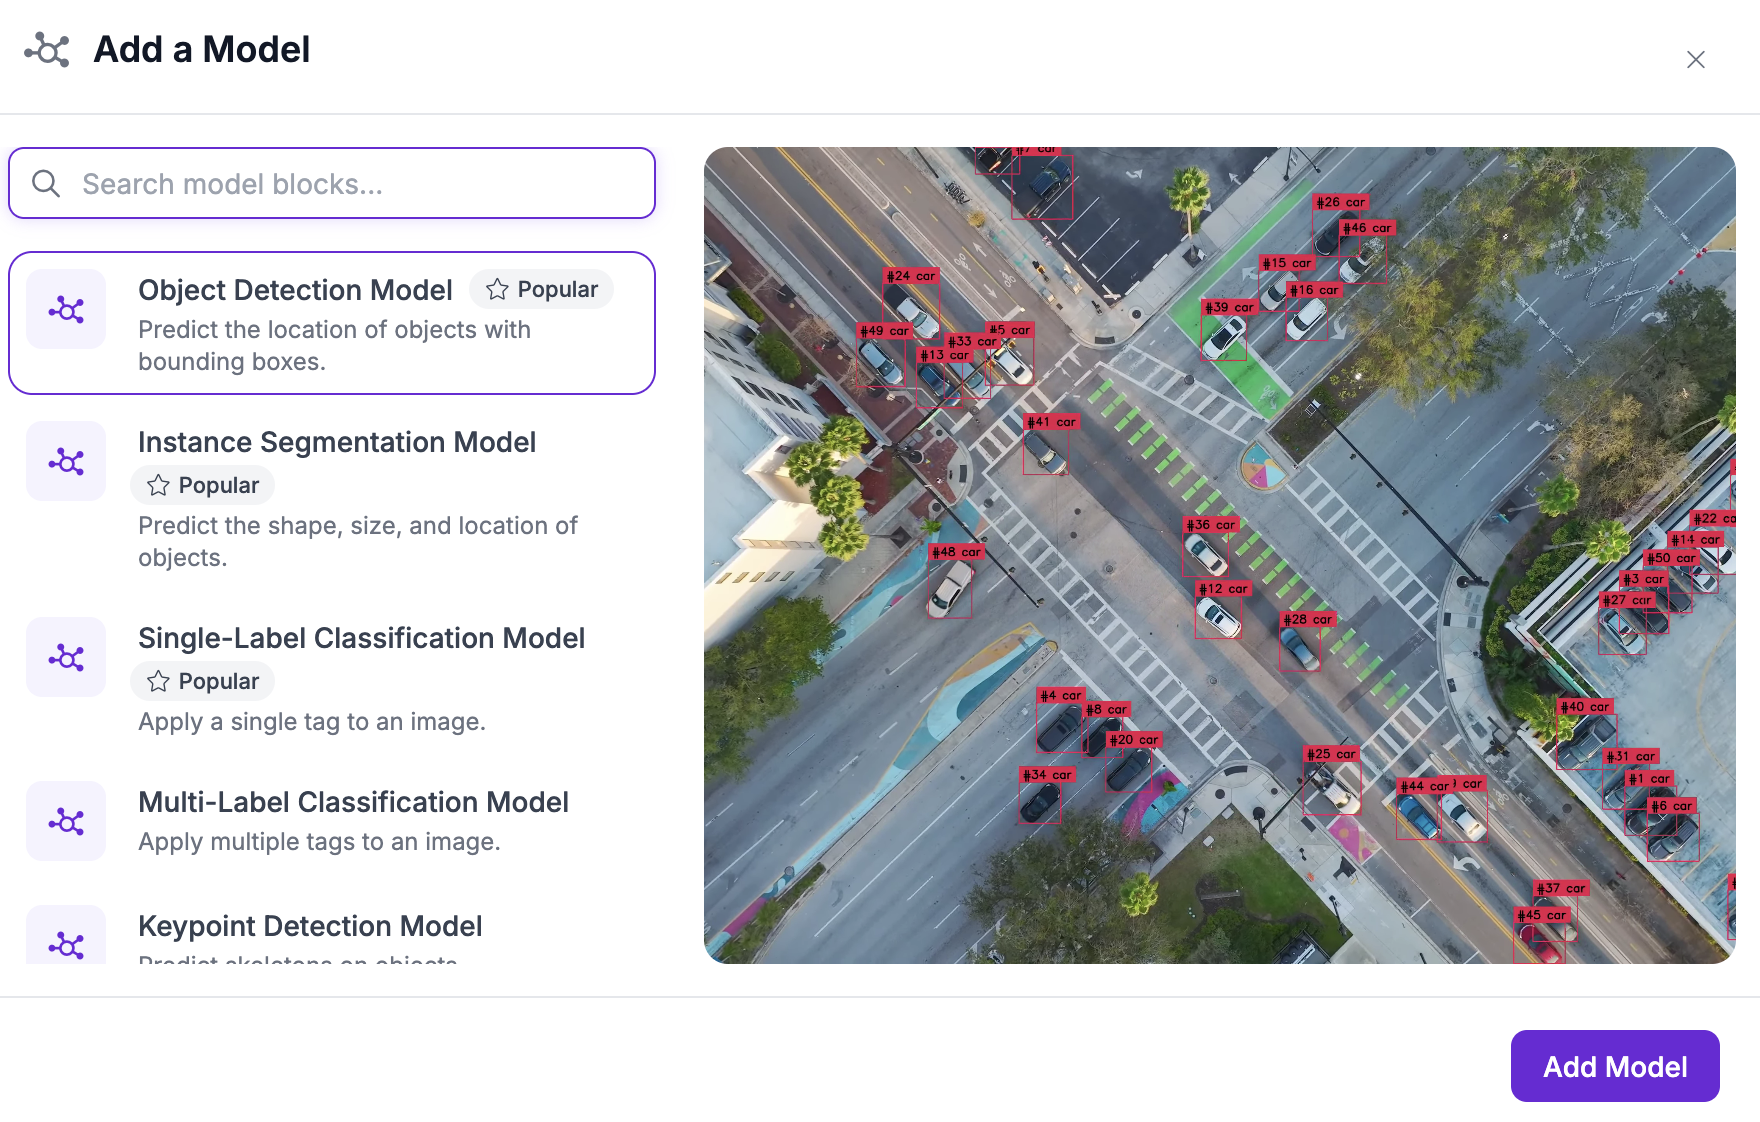
A window will open in which you can configure the model to use.
Click "Public Models" and select the YOLOv8 model:
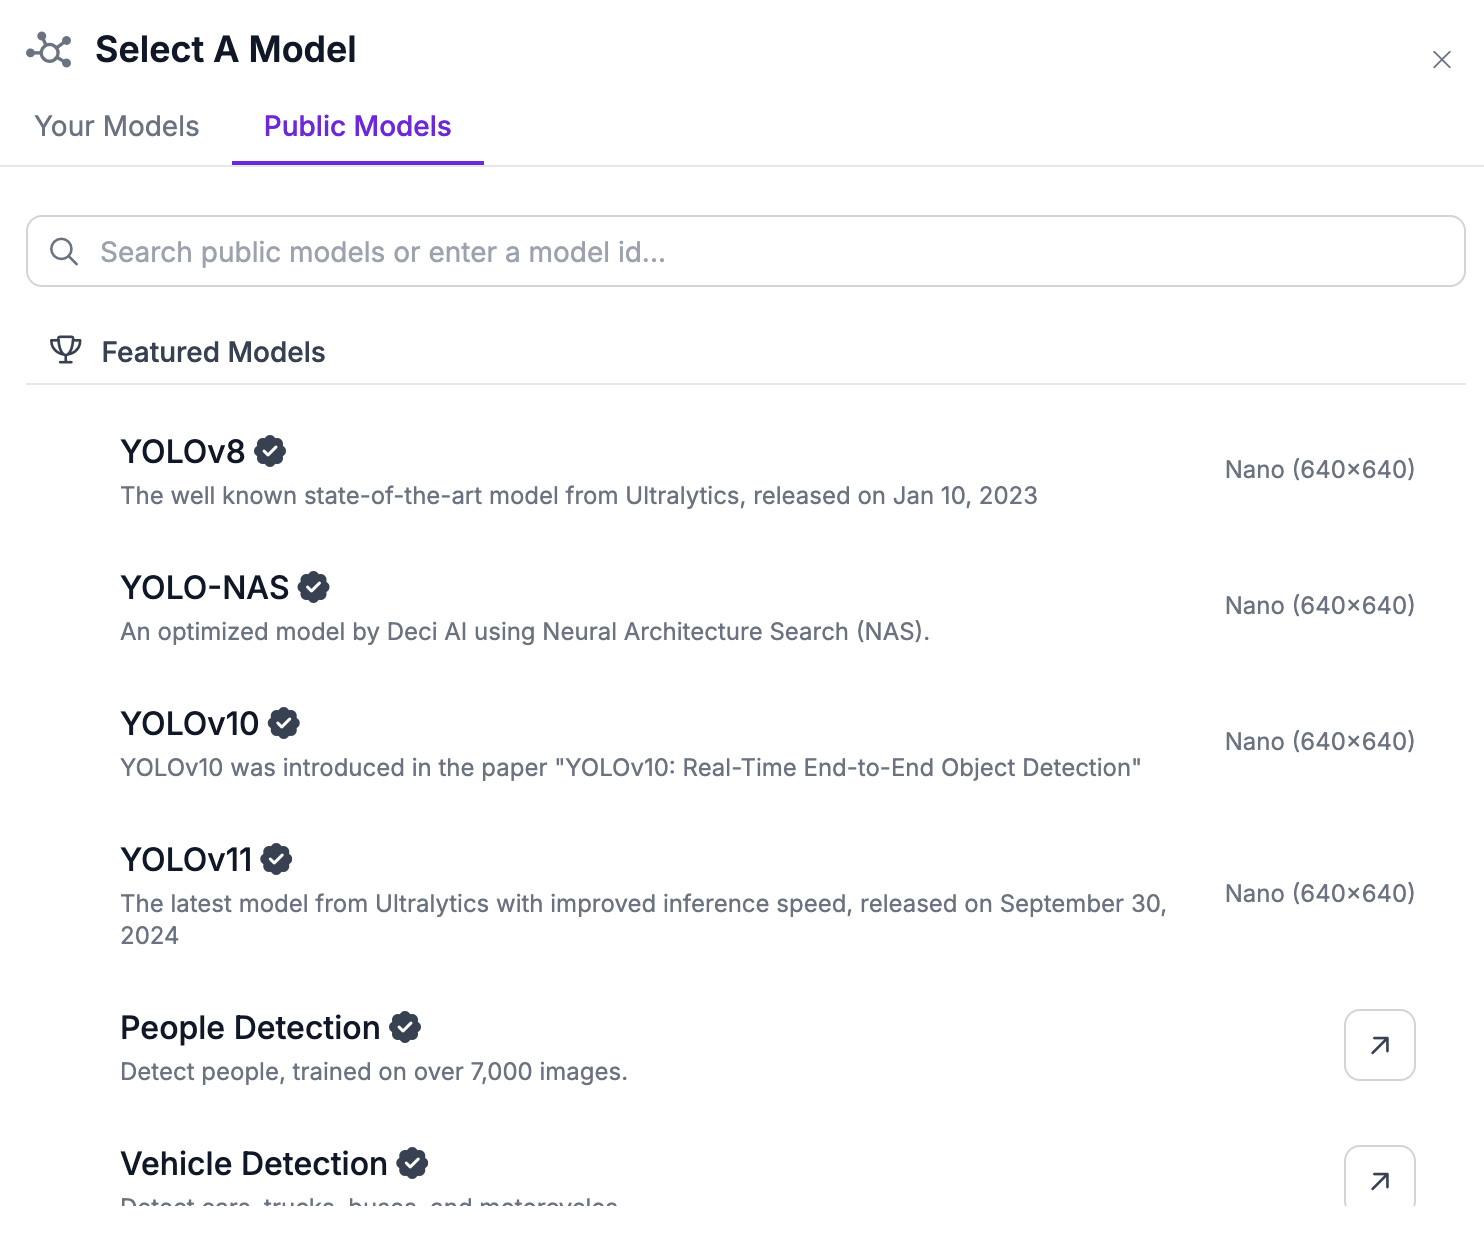
This will use a fast COCO model that can identify vehicles, people, and more.
You can use any model you train on Roboflow, too. This is useful if you want to identify specific objects that aren't people or vehicles, like a rig or a pipe.
If you already have a model trained, you can select it from the Your Models tab. Otherwise, refer to our Getting Started guide to learn how to train a model to identify custom objects.
Step #3: Enable Object Tracking
Before we define a red zone to monitor, we need to enable object tracking using the predictions from the model we set up in the last step.
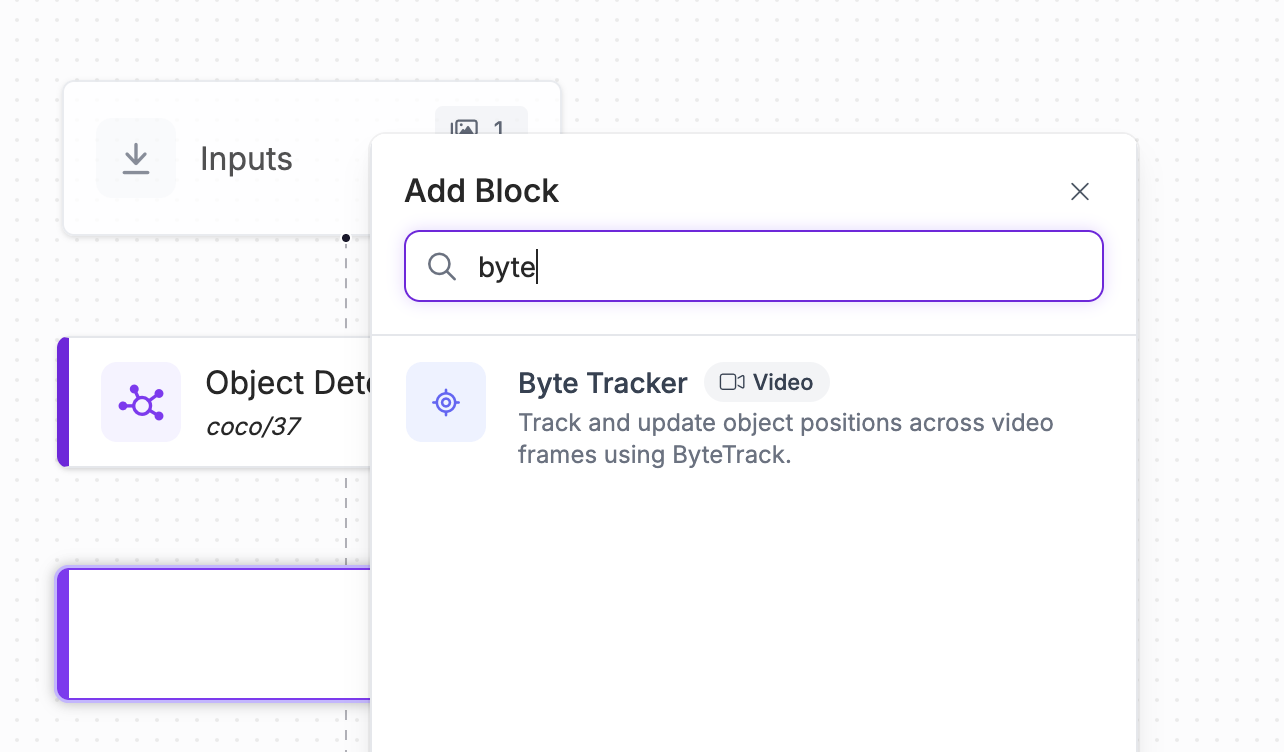
Search for the "Byte Tracker" block and add it to your Workflow:
We are now ready to set a red zone to monitor.
Step #4: Create a Red Zone
Next, we need to define the "red zone" that we want to monitor. For this, we can use the Time in Zone block. This block tracks for how long an object is in a specified zone.
Click the add icon in Workflows to add a block, then search for "Time in Zone":
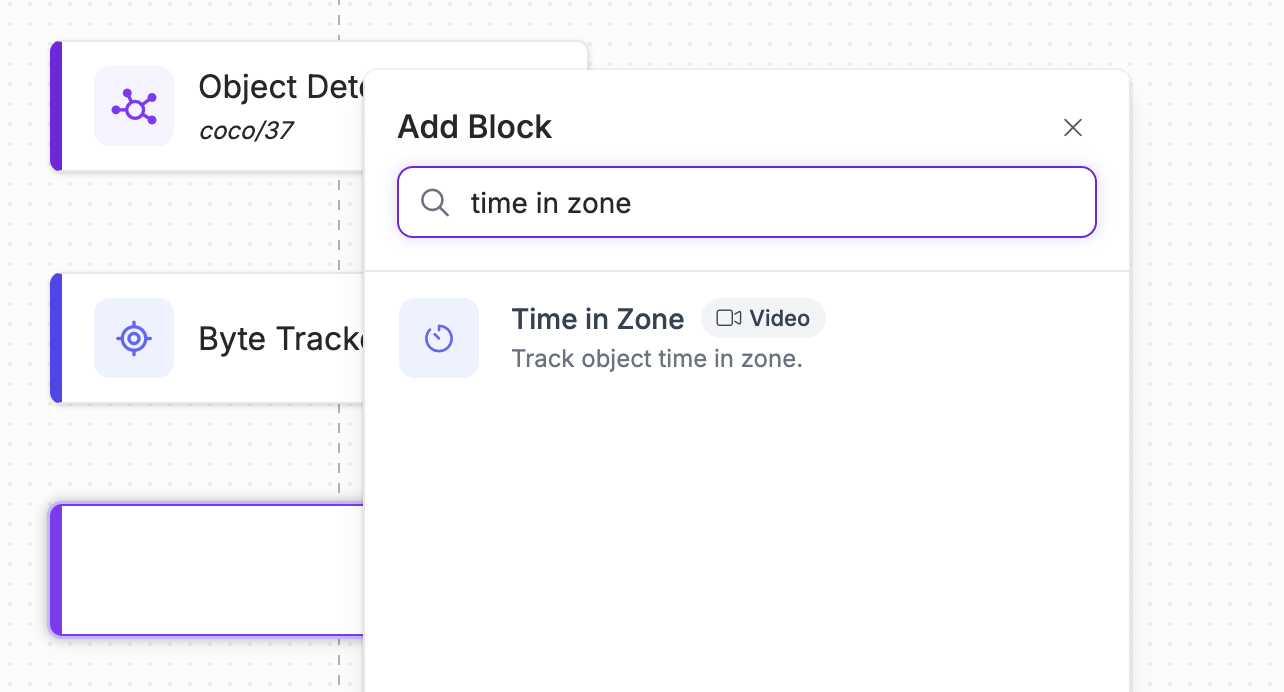
A configuration panel will open on the right side of your screen from which you can configure your red zone. Click the "Set Polygon Zone" button in the configuration panel:
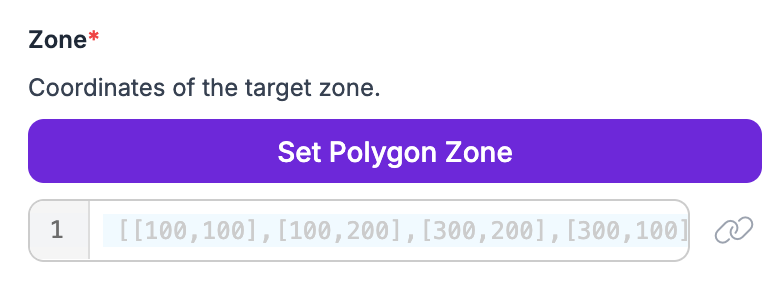
A window will appear in which you can define a red zone.
For red zone monitoring to work, your camera should be at a static angle. Upload a frame from your camera feed – or a video, as the Workflows application will automatically take the first frame.
Then, click on the frame in Workflows to draw a zone. When you have drawn your final point, press Enter to create a complete polygon:
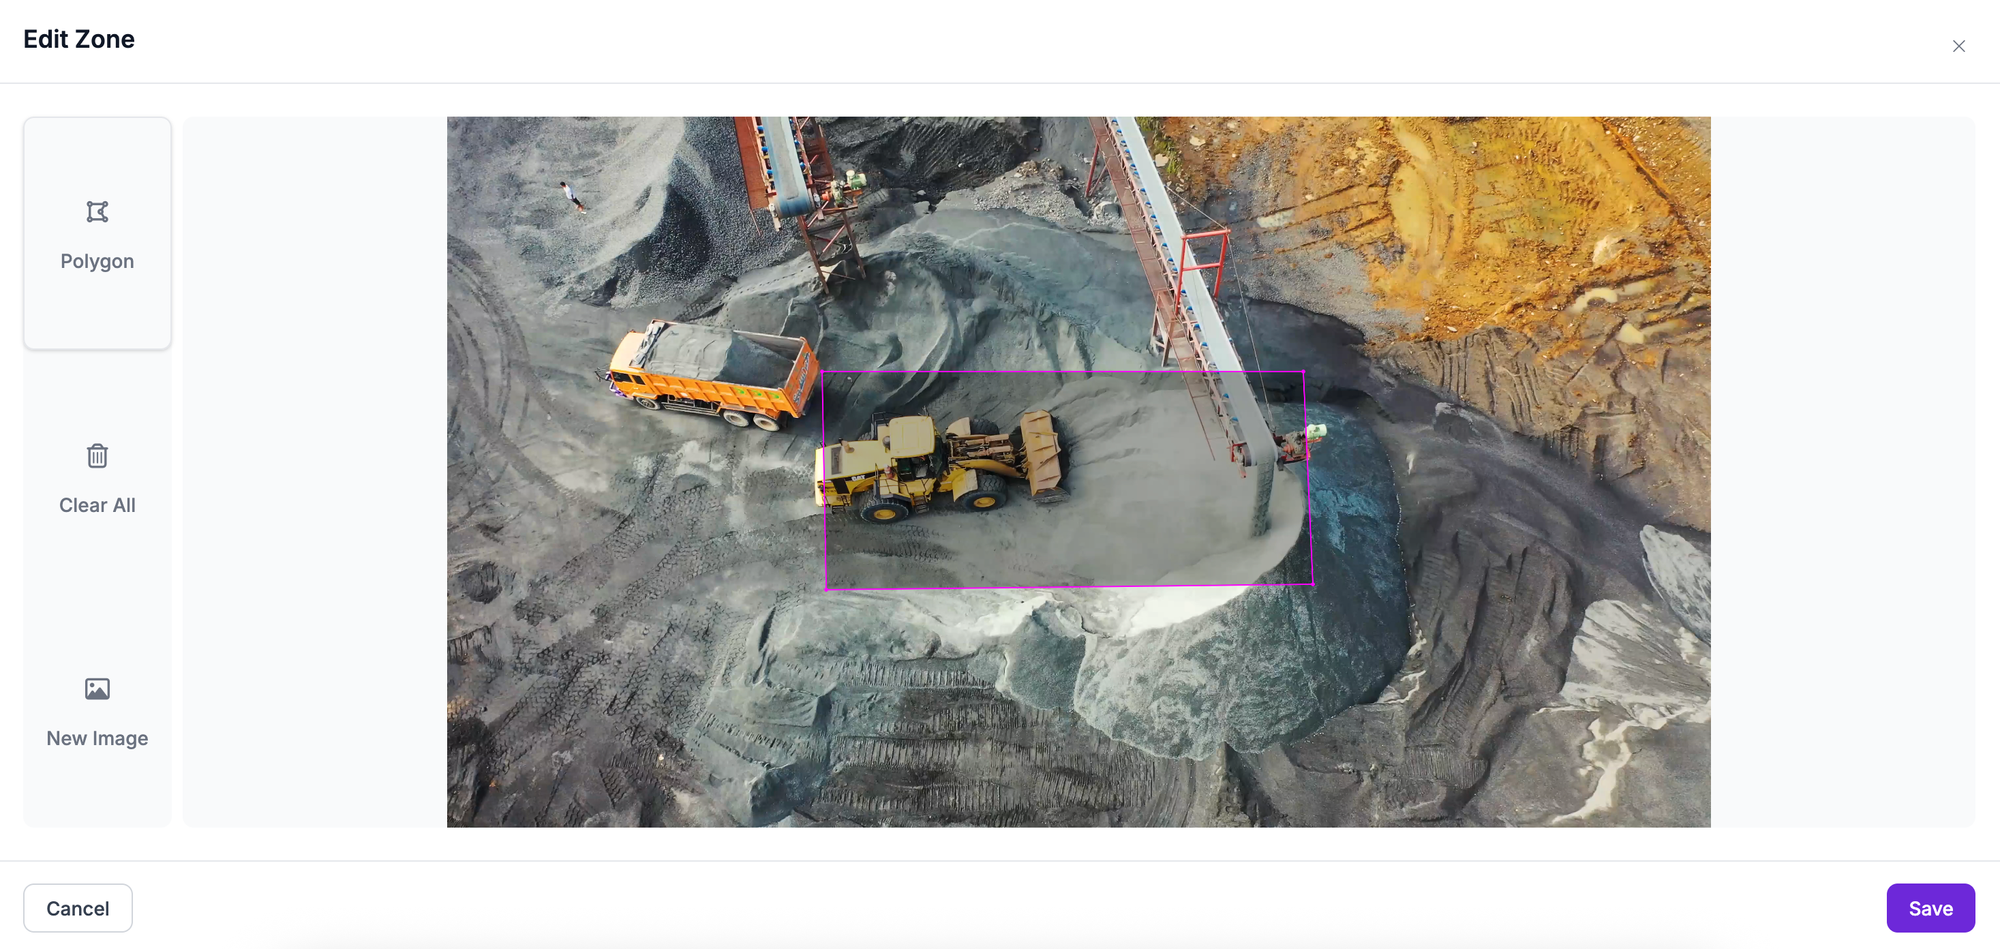
Above, we have drawn a polygon with four edges that maps to a red zone.
Step #5: Add Annotators
Right now, our Workflow can track objects in a zone. But, there is no visual output: the results from our Workflow will be returned as JSON. While JSON is ideal for integration into another system, a visual will help us confirm our system is working.
To visualise the results of our red zone monitoring system, we can use the annotation features in Workflows.
Add three annotators to your Workflow:
- Bounding Box Visualization
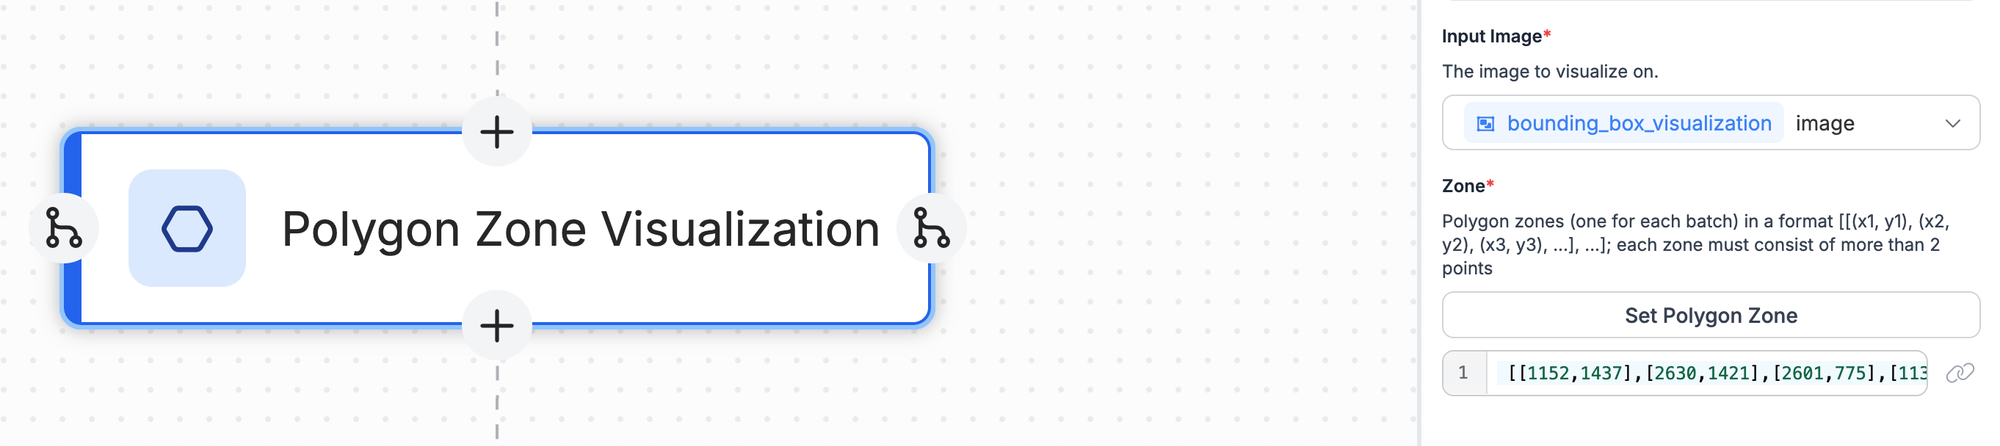
- Polygon Zone Visualization
- Label Visualization
When you set up the Polygon Zone Visualization, copy the coordinates from the Polygon Zone you set in the Time in Zone block:
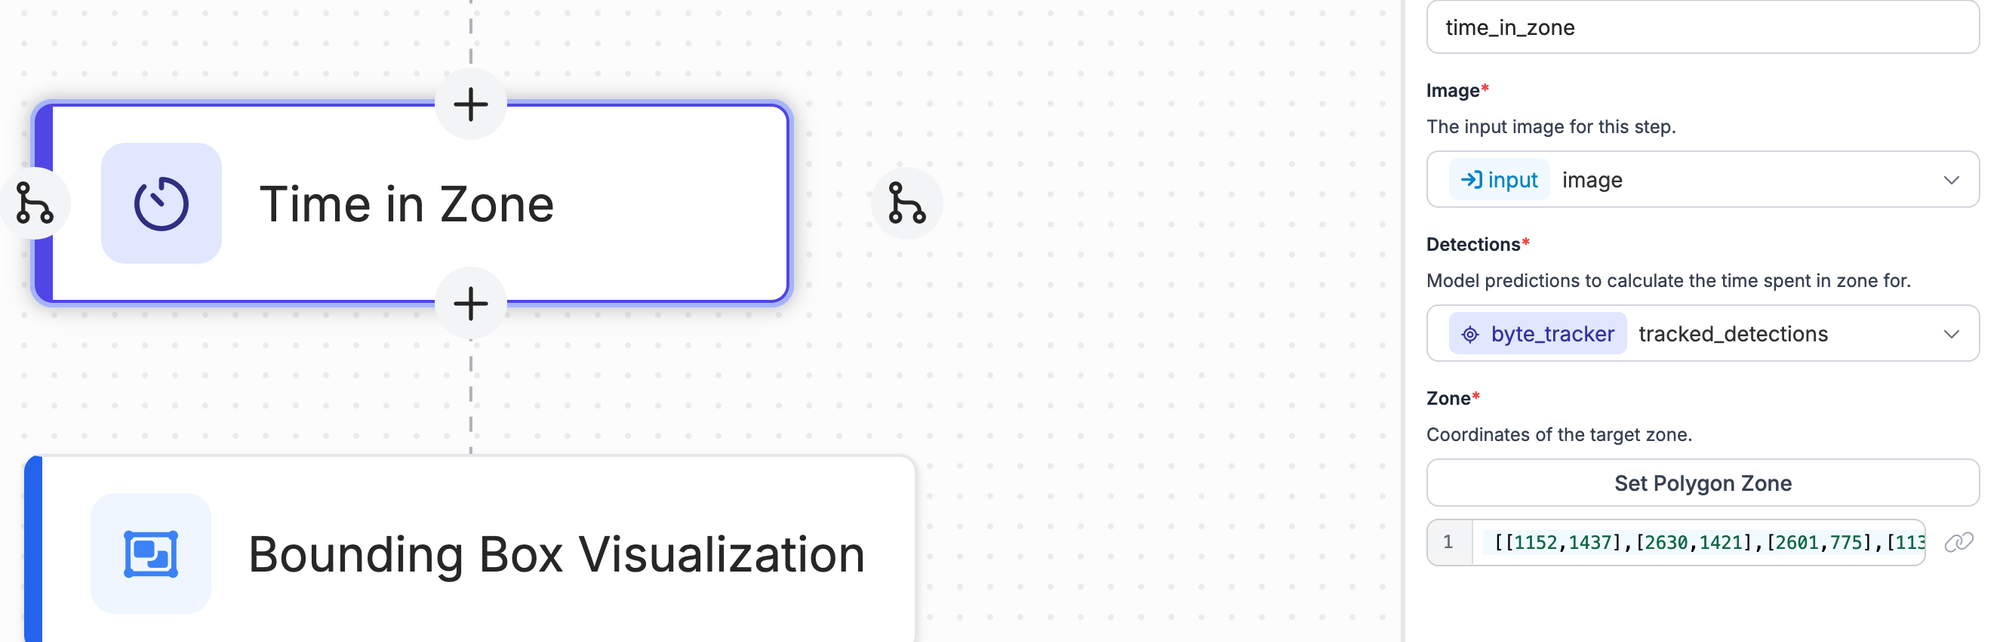
Paste them into the Zone field in the Polygon Zone Visualization:
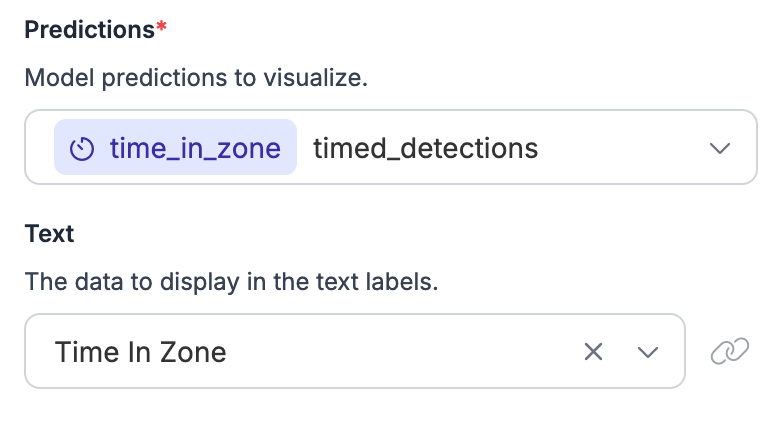
When you set up your Label Visualization, set the Text to display as Time in Zone:
Our Workflow will now return a video feed showing the bounding boxes from our model – the location of people and vehicles – as well as annotations that show our polygon zone and the amount of time each object spends in the zone.
Step #6: Test the Workflow
To run your Workflow, you will need either:
- A Dedicated Deployment, or;
- Roboflow Inference, our open source computer vision inference server, running on your local machine.
You can learn how to set up a dedicated deployment in our Dedicated Deployment guide. If you want to run your Workflow on your own hardware, follow the instructions in the "Deploy" button in the Roboflow app.
For this guide, let's run the Workflow on our own hardware. Click the "Deploy" button. Then, run the Inference installation command on your computer:
pip install inferenceNext, copy the code snippet from the Deploy window and paste it into a new Python file. The code snippet will look like this:
# Import the InferencePipeline object
from inference import InferencePipeline
import cv2

def my_sink(result, video_frame):
    if result.get("label_visualization"): # Display an image from the workflow response
        cv2.imshow("Workflow Image", result["label_visualization"].numpy_image)
        cv2.waitKey(1)
    print(result) # do something with the predictions of each frame


# initialize a pipeline object
pipeline = InferencePipeline.init_with_workflow(
    api_key="your-api-key",
    workspace_name="your-workspace",
    workflow_id="custom-workflow",
    video_reference=0, # Path to video, device id (int, usually 0 for built in webcams), or RTSP stream url
    max_fps=30,
    on_prediction=my_sink
)
pipeline.start() #start the pipeline
pipeline.join() #wait for the pipeline thread to finish
The video_reference is the input for your Workflow. It can be a video file, a webcam ID (which is usually 0 for your default device webcam), or an RTSP stream URL.
output_image. Replace this value with label_visualization, which is the visualization that our Workflow returns.Now we are ready to run our Workflow.
When you first run the Workflow, the Workflow configuration and any model weights used in the Workflow will be downloaded to your computer. This may take several seconds. Then, you should see the output of your Workflow, like this:
Our system tracks the time vehicles and people spend in the designated zone.
Conclusion
By following these steps, you can create a robust red zone detection model that enhances worker safety by identifying dangerous areas.
This guide has walked you through the process of setting up a model using Roboflow, defining red zones, and integrating the detection system with real-time video feeds.
We built our monitoring system in Roboflow Workflows, a web-based appliaction builder for computer vision, then deployed it on our own hardware with Inference.
You can integrate this Workflow with your own systems. For example, you could log entry and exit times to a CSV file. To learn more about the possibilities of Workflows, check out our Workflows guide.
Cite this Post
Use the following entry to cite this post in your research:
James Gallagher. (Apr 10, 2025). How to Monitor Red Zones with Computer Vision. Roboflow Blog: https://blog.roboflow.com/redzone-monitoring-computer-vision/