Roboflow improves datasets without any user effort. This includes dropping zero-pixel bounding boxes and cropping out-of-frame bounding boxes to be in-line with the edge of an image. Roboflow also notifies users of potential areas requiring attention like severely underrepresented classes (as was present in the original hard hat object detection dataset), images missing annotations, null image examples, oddly misshapen images, and object positional issues.
The Importance of Image Resize in Preprocessing
One area where the Roboflow Team has dedicated significant thought is how to demonstrate the need to resize images. Knowing how to resize images for computer vision is a tricky task in of itself: resizing isn't a simple stretch-to-fill decision as one needs to consider maintaining aspect ratio and how images in inference may vary from those in training. All images should be scaled and sized the same when the model is deployed.
Commonly, images for many neural networks must be square, even if the aspect ratio or original images are not. (This is because fully connected layers require square arrays.) Images that are close-to-square can easily become square. Images that are too oblong in one direction (too tall or too wide) give us pause: perhaps one-off examples could be dropped from the dataset. Generally, we seek to see how distorted the majority of our images would be, if at all, if we did a resize to square.
A Walkthrough with Dimensions Insights
One way we help informed resize decisions is with our Dimensions Insights tool in the Dataset Health Check.
Let's consider an example from the Hard Hat Dataset, which has images of various sizes and bounding boxes around workers with hard hats (or not):

There's quite a bit to take in, but we also learn many things instantaneously.
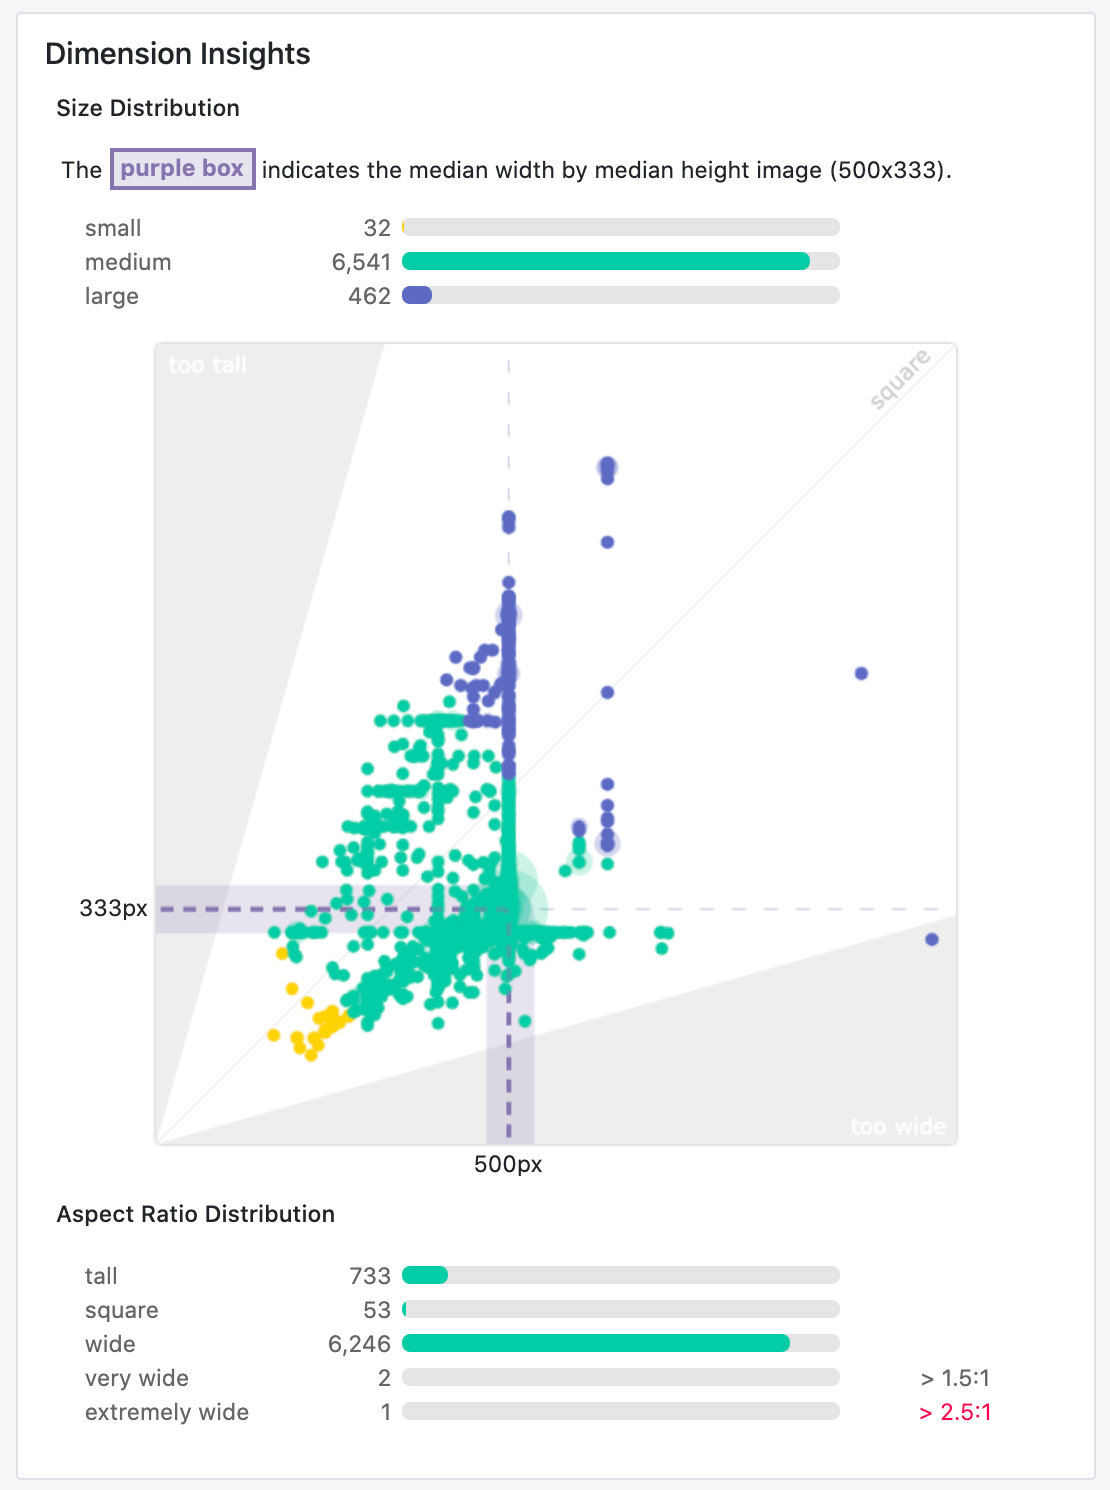
Let's start with describing the basics of our visualization. The y-axis describes the height dimension of our images. The x-axis describes our image width. Every dot is a given image in our dataset's dimensions. If an image is a perfect square, it would extend 45 degrees from the origin of our graph (and fall right on the light gray line protruding from the origin). If a dot is above this line, the image is taller than it is wide. If a dot is below this line, the image is wider than it is tall.
In our shaded areas on either axis, we note images that may fall into the "danger" territory of being too tall or too wide – where the longer dimension is 2x the shorter dimension.
The last orienting component in this visualization the purple area denoting the "median" image size in a dataset. Given the median is less susceptible to outliers than the mean, it provides a central point to consider how far any given image is from our desired resize (again, likely square). Moreover, showing the median image dimension informs whether over half our images are generally too wide or too tall.
Now, let's consider what we see in the case of our hard hat object detection dataset.
The majority of images (6,541 of 7,035) are "medium-sized," and close in size to one another. These images are, indeed, on the "wide end of square," but not dramatically. Our median image is 500 pixels wide by 333 pixels tall – not too far off of being square. Despite the diversity in shapes in our dataset, it is not too off-kilter.
That said, we have some images to consider dropping or investigating. Our images that are much smaller than our median (32 of 7,035) are of particular concern as stretching pixels to be larger is often worse than stretching pixels to be smaller: the distortion is less "real world" than downsizing our big images to be smaller. Moreover, one image is "extremely wide," where its width is more than 2.5 times its height. We ought to consider removing this image from our dataset, or at least considering the source of capture for this image to understand if our model in production will face many more examples like these dimensions.
All told, with this dataset, I would consider a 416x416 resize with preserving aspect ratio to be the best bet. Stretching context – making wide or tall images to be square – may limit our model's ability to learn what hard hat wearing workers truly look like. I would investigate the source of my 32 smaller images and outlier wide image to see if I could safely drop them. (Safely defined as there are other images in the dataset capturing these images' qualities.)
Cite this Post
Use the following entry to cite this post in your research:
Joseph Nelson. (Apr 29, 2020). Breaking Down Roboflow's Health Check Dimension Insights. Roboflow Blog: https://blog.roboflow.com/resize-images-with-dimension-insights/
Discuss this Post
If you have any questions about this blog post, start a discussion on the Roboflow Forum.
