
Nearly every computer vision project begins with the same question: How much data do I actually need?
It’s tempting to assume the answer is always "more." But labeling thousands of nearly identical images doesn’t always lead to a smarter model. The real secret to high-performing vision models isn’t raw quantity; it’s the right mix of examples that truly represent the world your system will see.
In this guide, we’ll break down how to find that balance. You’ll learn how dataset size, variety, and label accuracy impact performance, why accuracy gains follow predictable scaling laws, and how to easily to measure, optimize, and grow your dataset.
Why Dataset Size Matters in Computer Vision
In computer vision, the amount of data you use is just as important as the model architecture (RF-DETR, YOLOv12 etc.) you choose. When you add more examples, your model usually gets better at recognizing patterns. But the improvement follows a predictable curve, not a straight line.
Researchers at Google, Sun et al. (2017) trained image-recognition networks on hundreds of millions of pictures and found that accuracy increases roughly logarithmically with dataset size. Meaning the first few thousand images help a lot, but each extra batch adds a little less improvement.
Later, A study by Hestness et al. (2017) showed that model accuracy improves in a predictable way as more training data is added. When they plotted error against dataset size, the results followed a power-law curve. Meaning performance keeps getting better with more data, but the gains become smaller over time.
This finding is useful because it shows that data scaling in computer vision isn’t random. You can roughly estimate how much new data will help before the improvements start to slow down. Doubling your dataset will not double the accuracy. Instead, look for the knee of the curve i.e. the point where adding more data stops giving large benefits.
For example, if you train an object detection model on 100 images and then double the dataset to 200 images, you might see a big jump in accuracy say from 70% to 80%. But if you double it again to 400 images, the improvement may only go from 80% to 83%. The first few hundred images teach the model most of what it needs to know, and additional data brings smaller benefits.
Wang et al. (2025) and his team trained very large vision-language models using around 100 billion image-text pairs. They noticed that adding more data didn’t always help on common benchmarks. The biggest improvements appeared in less common or more diverse images. This shows that both scale and diversity are important.
Finding the right amount of training data also depends on what you want the model to do. A simple image classification task, such as deciding whether a picture shows a soccer ball or basketball, can work well with a few hundred good examples. Object detection, which needs to find and label several objects in one image, usually needs more data. Segmentation tasks, where every pixel of an object must be outlined, often need the most careful labeling and variety.
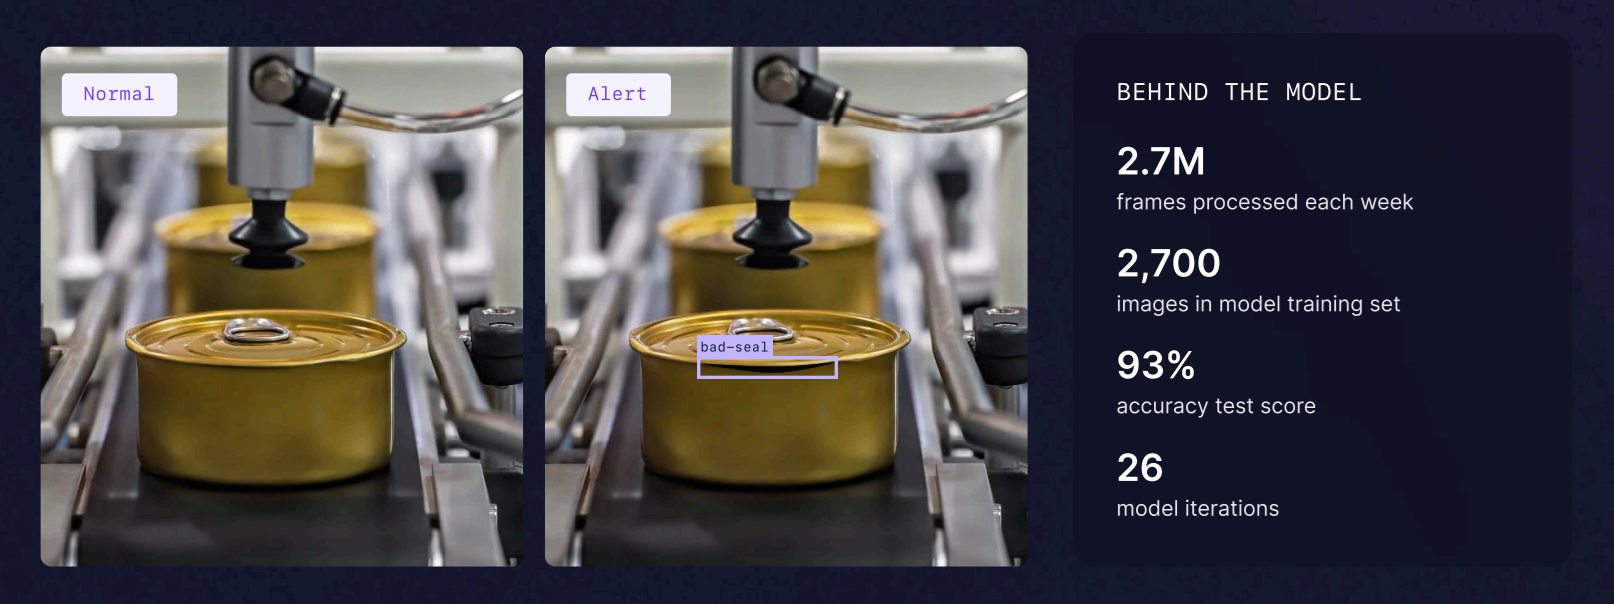
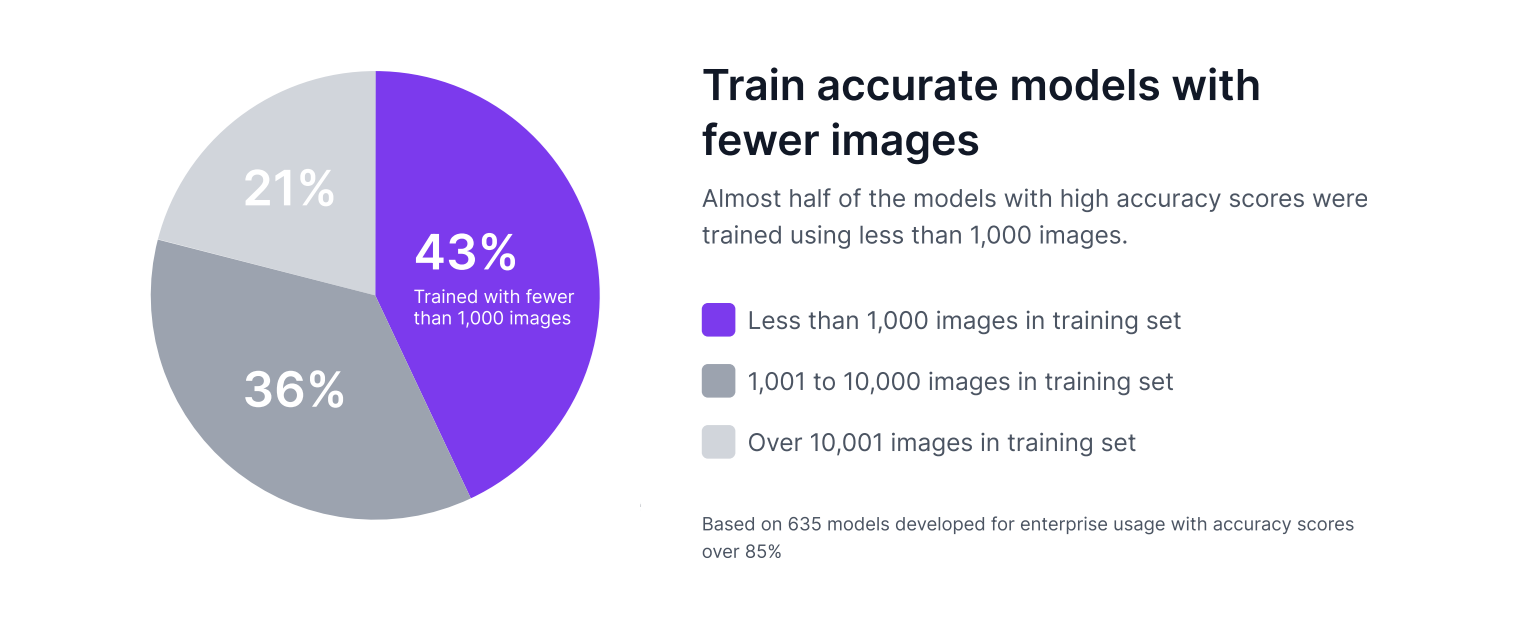
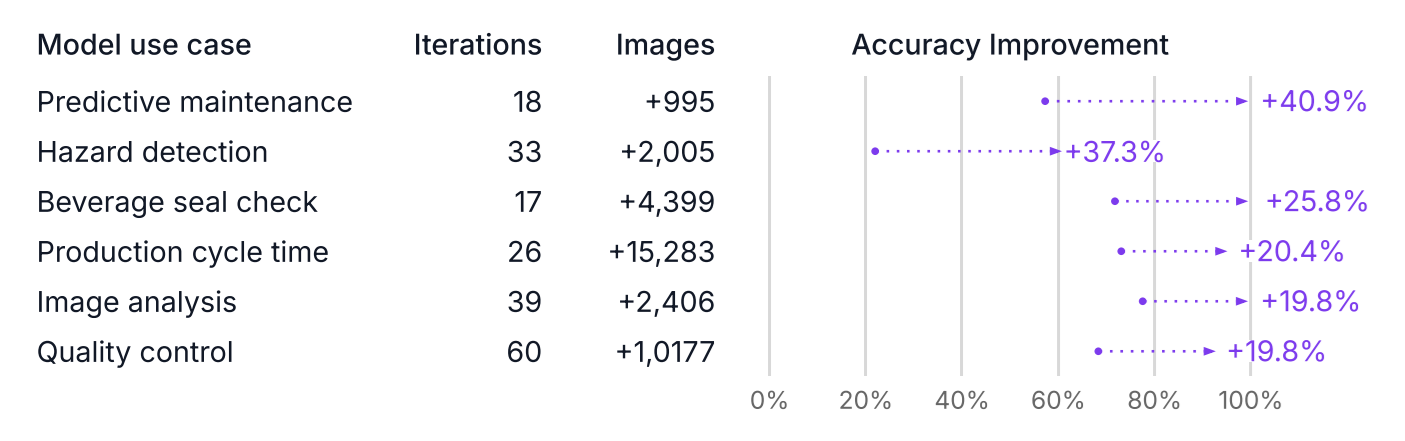
Many successful enterprise computer vision models customized using Roboflow achieve high accuracy with fewer than 1,000 images.
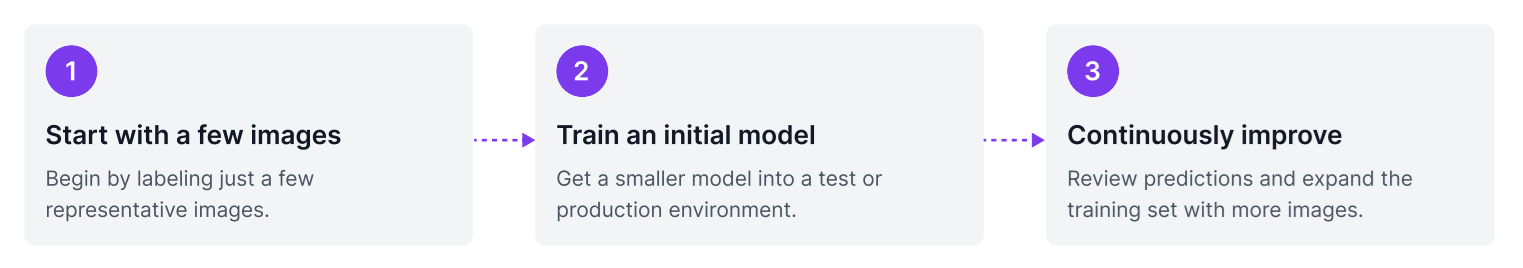
We recommend starting by collecting 50-100 images for use in training a first model version. When labeled, this is usually enough images to build a model version that can identify a few unique classes. For a production model version, you may end up collecting hundreds or thousands of images. There is no hard rule for how many images you need to collect.
In conclusion, you don’t just need more data. You also need the right kind of data. Collect enough images to match your task and the variety your model will face in the real world, and make sure the labels are clear and accurate.
What Training Data Should Be Included?
Before training a computer vision model, decide what kinds of images belong in your dataset. The goal is not just to gather a large number of pictures, but also to collect the mix that captures how your model will be used in the real world.
Start by understanding your use case and environment. If you’re detecting cracks in pipelines, you’ll need images of pipelines in different lighting, materials, and wear conditions. For a fruit-classification model, you’ll want fruit at various ripeness stages, colors, and orientations. Every variation your model might see in production should be reflected in your dataset.
Here are key principles for data collection:
- Match real-world conditions: Include all lighting types, camera angles, and backgrounds your system will encounter.
- Cover the full range of scenarios: Don’t just collect “perfect” examples, but include blurry, partially hidden, and edge cases too.
- Capture class balance: Make sure each class has enough examples. If some objects are rare, try to include more of them.
- Include context: For detection and segmentation tasks, images with realistic surroundings help the model learn to distinguish target objects from background clutter.
- Plan for future variations: Add examples from different devices, resolutions, or camera settings if your system will run across multiple hardware setups.
Think of your dataset as the snapshot of the real world your model will operate in. The closer your images reflect real conditions, the more reliable your computer vision system will be once deployed.
How to Split Your Data into Subsets for Training, Validation, and Testing
After collecting your dataset, you need to decide which part of it to use for training, validation, and testing. Properly selecting these subsets ensures your model learns effectively and gives reliable, unbiased results on new data.
A common and reliable method is to split your data into three parts:
- 70% for training. The model learns from this data.
- 20% for validation. This data is used to adjust settings like learning rate and to stop training at the right time.
- 10% for testing. This data is used only once at the end to check the final performance.
Here are a few important points to follow when splitting your dataset:
- Make sure every subset (train, validation, test) has examples of all your classes. If a rare defect appears only in the test set, your model will never learn to detect it.
- Keep validation and test sets clean. Don’t apply data augmentations to these sets. They should represent real-world data and be used only for measuring how well the model generalizes.
- Remove duplicate or very similar images across splits to avoid overlaps. If the same or nearly identical image appears in both training and testing, your accuracy will look unrealistically high.
- Keep enough validation data. Don’t make the validation and test sets too small. If you only hold out 5% of your data for validation, the accuracy numbers can become unstable. Keeping at least 10% for validation gives more reliable results.
Careful splitting ensures your evaluation is honest: the model’s good results actually mean it learned to generalize, not just memorize.
Representativeness and Tail Coverage
Your dataset splits should reflect the kind of data your model will see in real-world use. The training set should include images with different lighting conditions, backgrounds, and object sizes or scales.
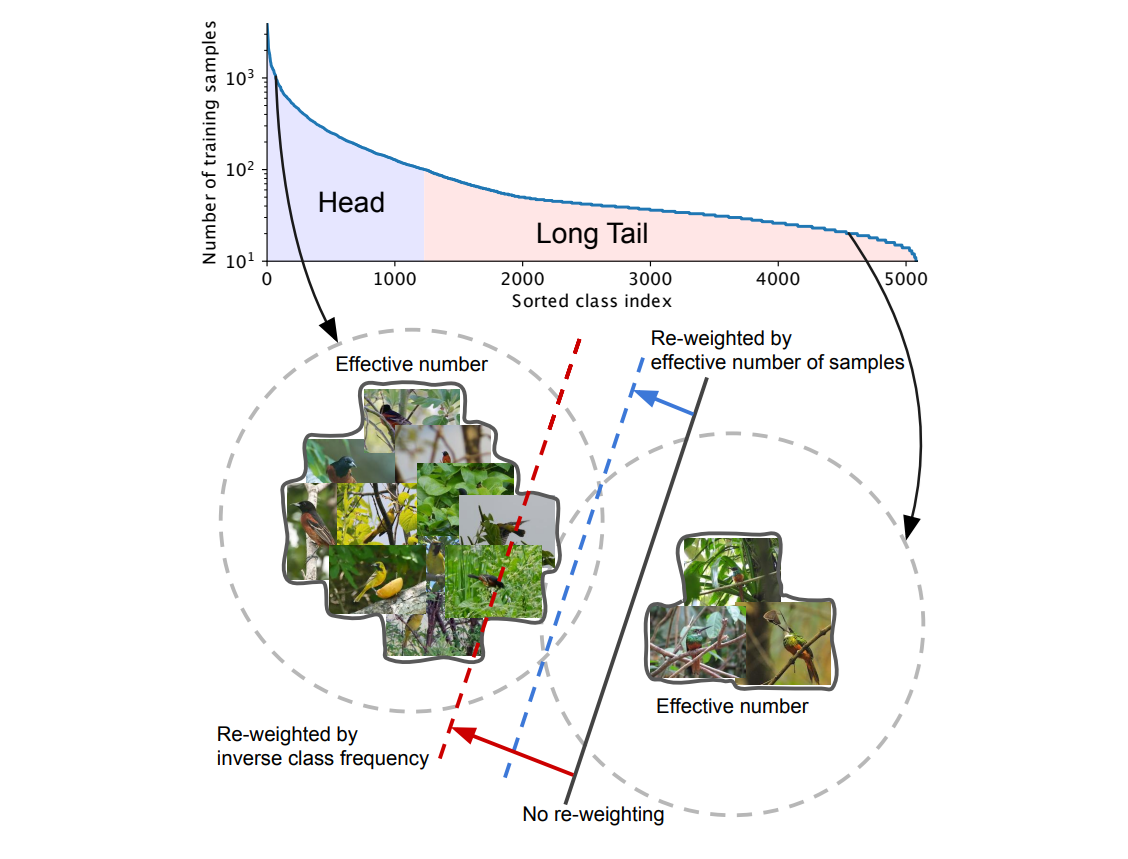
When some classes appear much more often than others, the dataset becomes imbalanced. This can make the model biased toward the frequent classes and ignore rare ones. To fix this, you can:
- Use class-balanced sampling (pick more images from rare classes during training). Apply re-weighting, where rare classes get higher importance during loss calculation.
- Try methods from long-tail learning, such as focal loss or class-balanced loss, which are designed to help models perform better on the less common classes.
A good dataset, and a fair split, represents every situation your model might face, including the rare and difficult ones.
Read More:
Annotation Quality
Labeling quality is very important for a computer vision project to succeed. Research by Curtis G. Northcutt et al. (2021) showed that common computer-vision datasets contain about 3% incorrect labels.
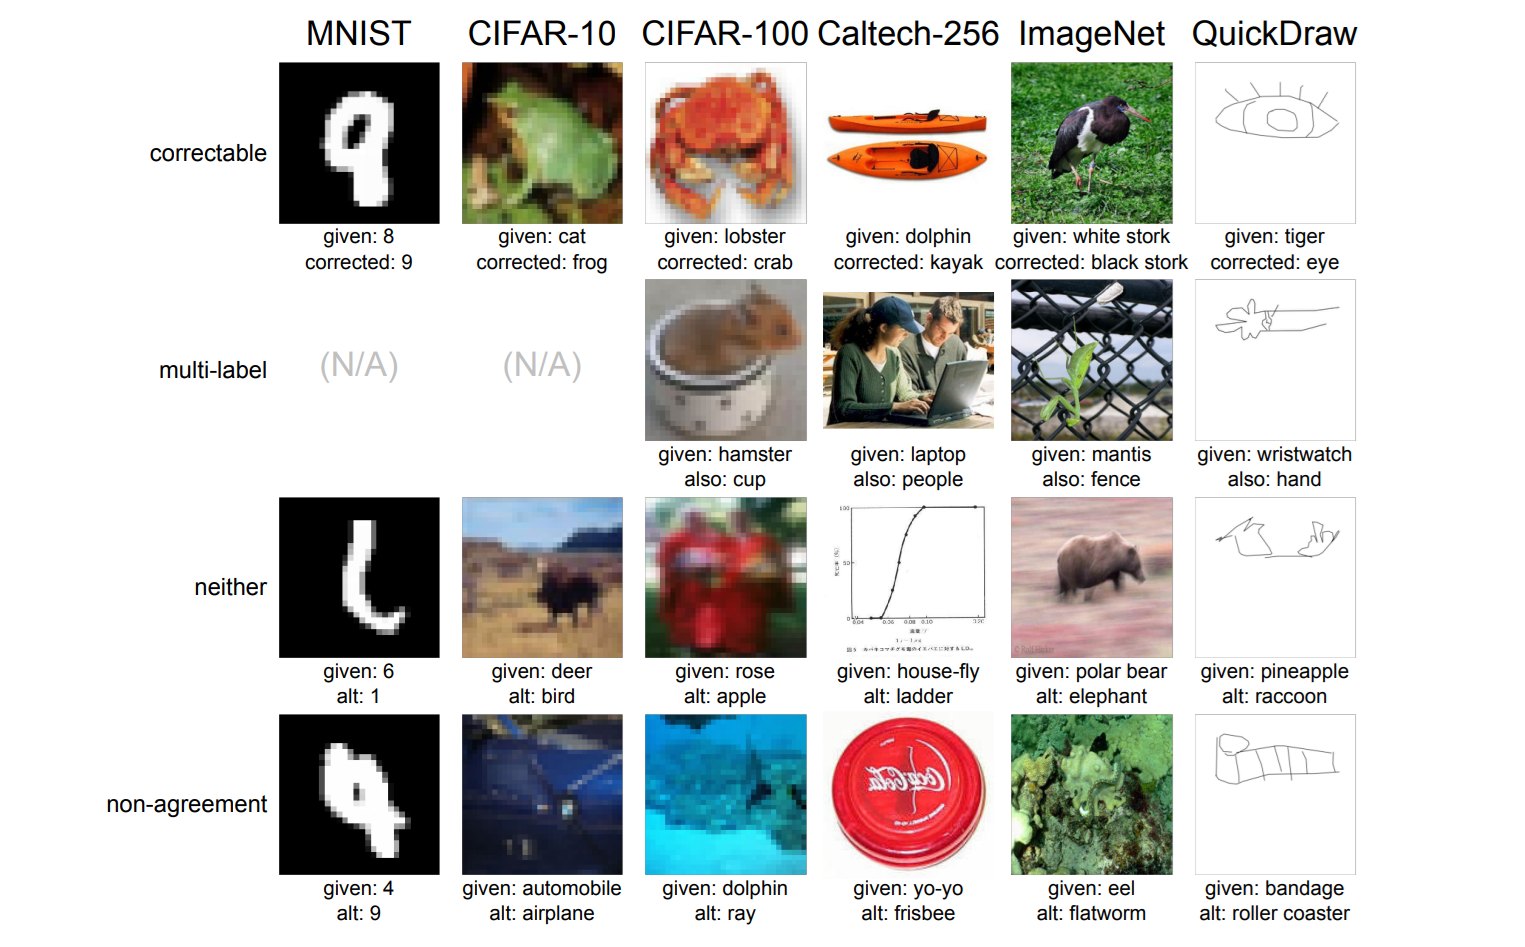
These errors can change how models are ranked. Therefore, you must include quality labeled data without noise. Modern vision tools now make it easier to check data quality throughout a project.
You can start by running data health checks to find class imbalance, duplicated images, or missing examples. Building this habit keeps your dataset balanced and relevant to real-world conditions.
A simple improvement cycle looks like this:
- Train a baseline model using your current dataset.
- Audit predictions to identify potential labeling mistakes or confusing samples. Tools based on Confident Learning (such as Cleanlab) can automatically flag likely mislabels.
- Manually review and fix these flagged examples.
- Retrain and compare model performance. If accuracy improves, continue refining. If not, gather new data or look for underrepresented edge cases.
Many labeling platforms now use AI-assisted annotation to speed up the process. After you label a few examples, the model begins suggesting boxes, masks, or classifications that you simply review and adjust. Combined with active learning, this creates a feedback loop where every retraining round improves both your model and your dataset, keeping the system accurate and robust even as new data appears.
Read More:
Computational Resources and Data Budget
How much computing power (compute budget) you have decides how much data you can realistically train on. If GPU power or time is limited, focus on data quality and diversity instead of just collecting more images.
In many cases, smaller models trained on diverse and well-regularized data (using techniques like dropout and weight decay) perform better than very large models trained on small, repetitive datasets.
On the other hand, if you have access to strong compute resources, you can scale up both the model size and the amount of data together. Research on compute-optimal training by Hoffmann et al. (2022) shows that models learn best when the number of parameters and the amount of data grow proportionally. Therefore, match your data strategy to your hardware limits. When compute is tight, train smart and diverse. But when it’s more, scale both your model and data in balance.
Active Learning and Core-Set Selection
Labeling images for training computer vision models is time consuming and expensive, especially for object detection and segmentation, where each image can require many detailed annotations. Active learning helps lower this cost by letting the model guide you toward labeling only the most useful images instead of labeling everything.
A common approach is the core-set method, where an algorithm selects a smaller group of images that still represents the diversity of the full dataset. A model trained on this subset performs almost as well as one trained on all available data but with far less labeling work.
Active learning directly improves data quality. By identifying which images the model is uncertain about, it focuses annotation on the examples that provide the most new information. This keeps your dataset balanced and diverse, while cutting down wasted effort on redundant samples.
How to Train a Custom Vision Model
Here's how to build a custom object detector using Roboflow. This tutorial assumes you have a diverse set of images representing your use case. In this example, we will build a dominoes detection project that can be used to automated scoring, interactive learning, and game pattern analysis applications using computer vision.
1. Create a project and upload images
Log into Roboflow and create a new project. Choose the project type “Object Detection.” Drag and drop images or videos into your project. Roboflow automatically detects duplicates and allows you to upload existing annotations. Start with a few hundred diverse images.
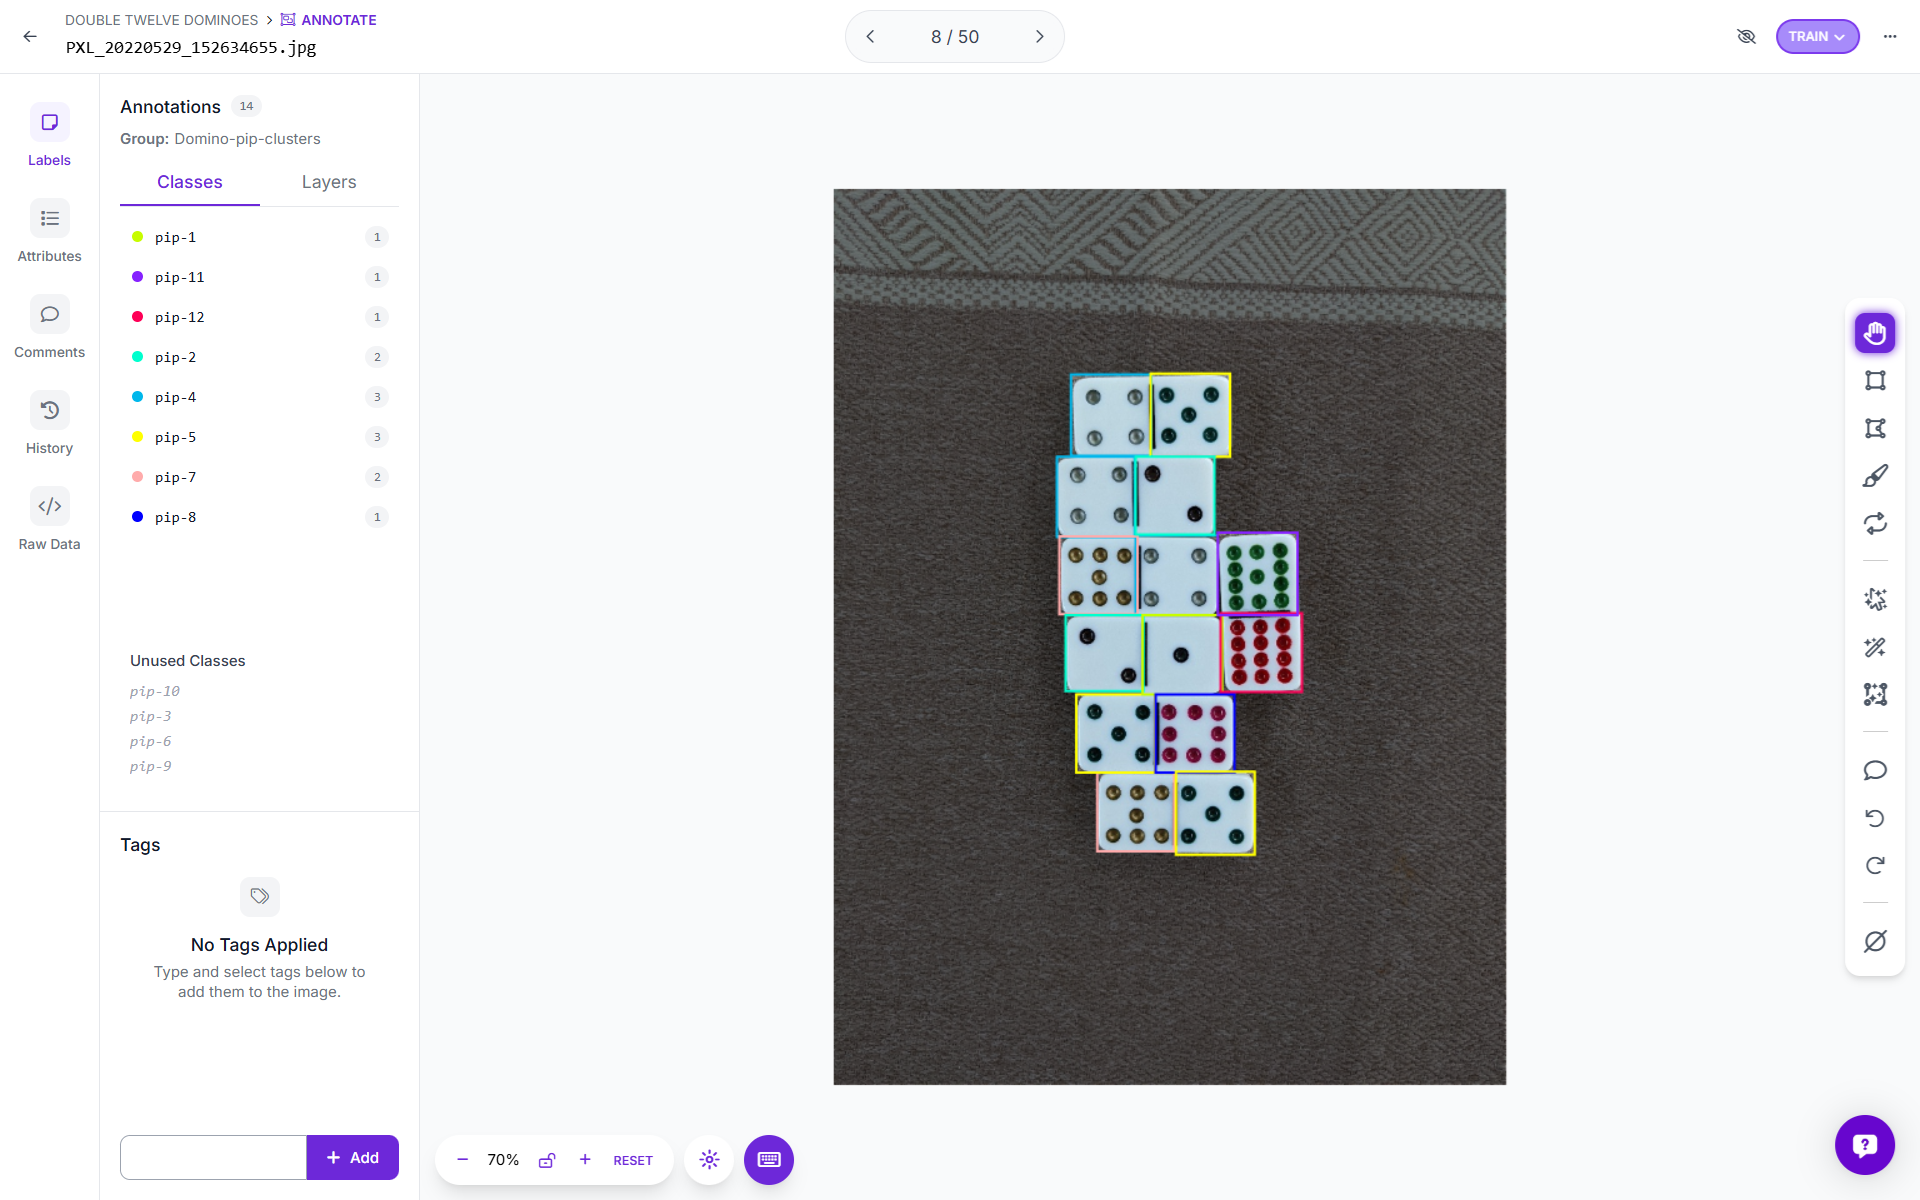
2. Label your data
Use Roboflow annotate to draw bounding boxes. Define your classes. Then, speed up annotation with Label Assist.
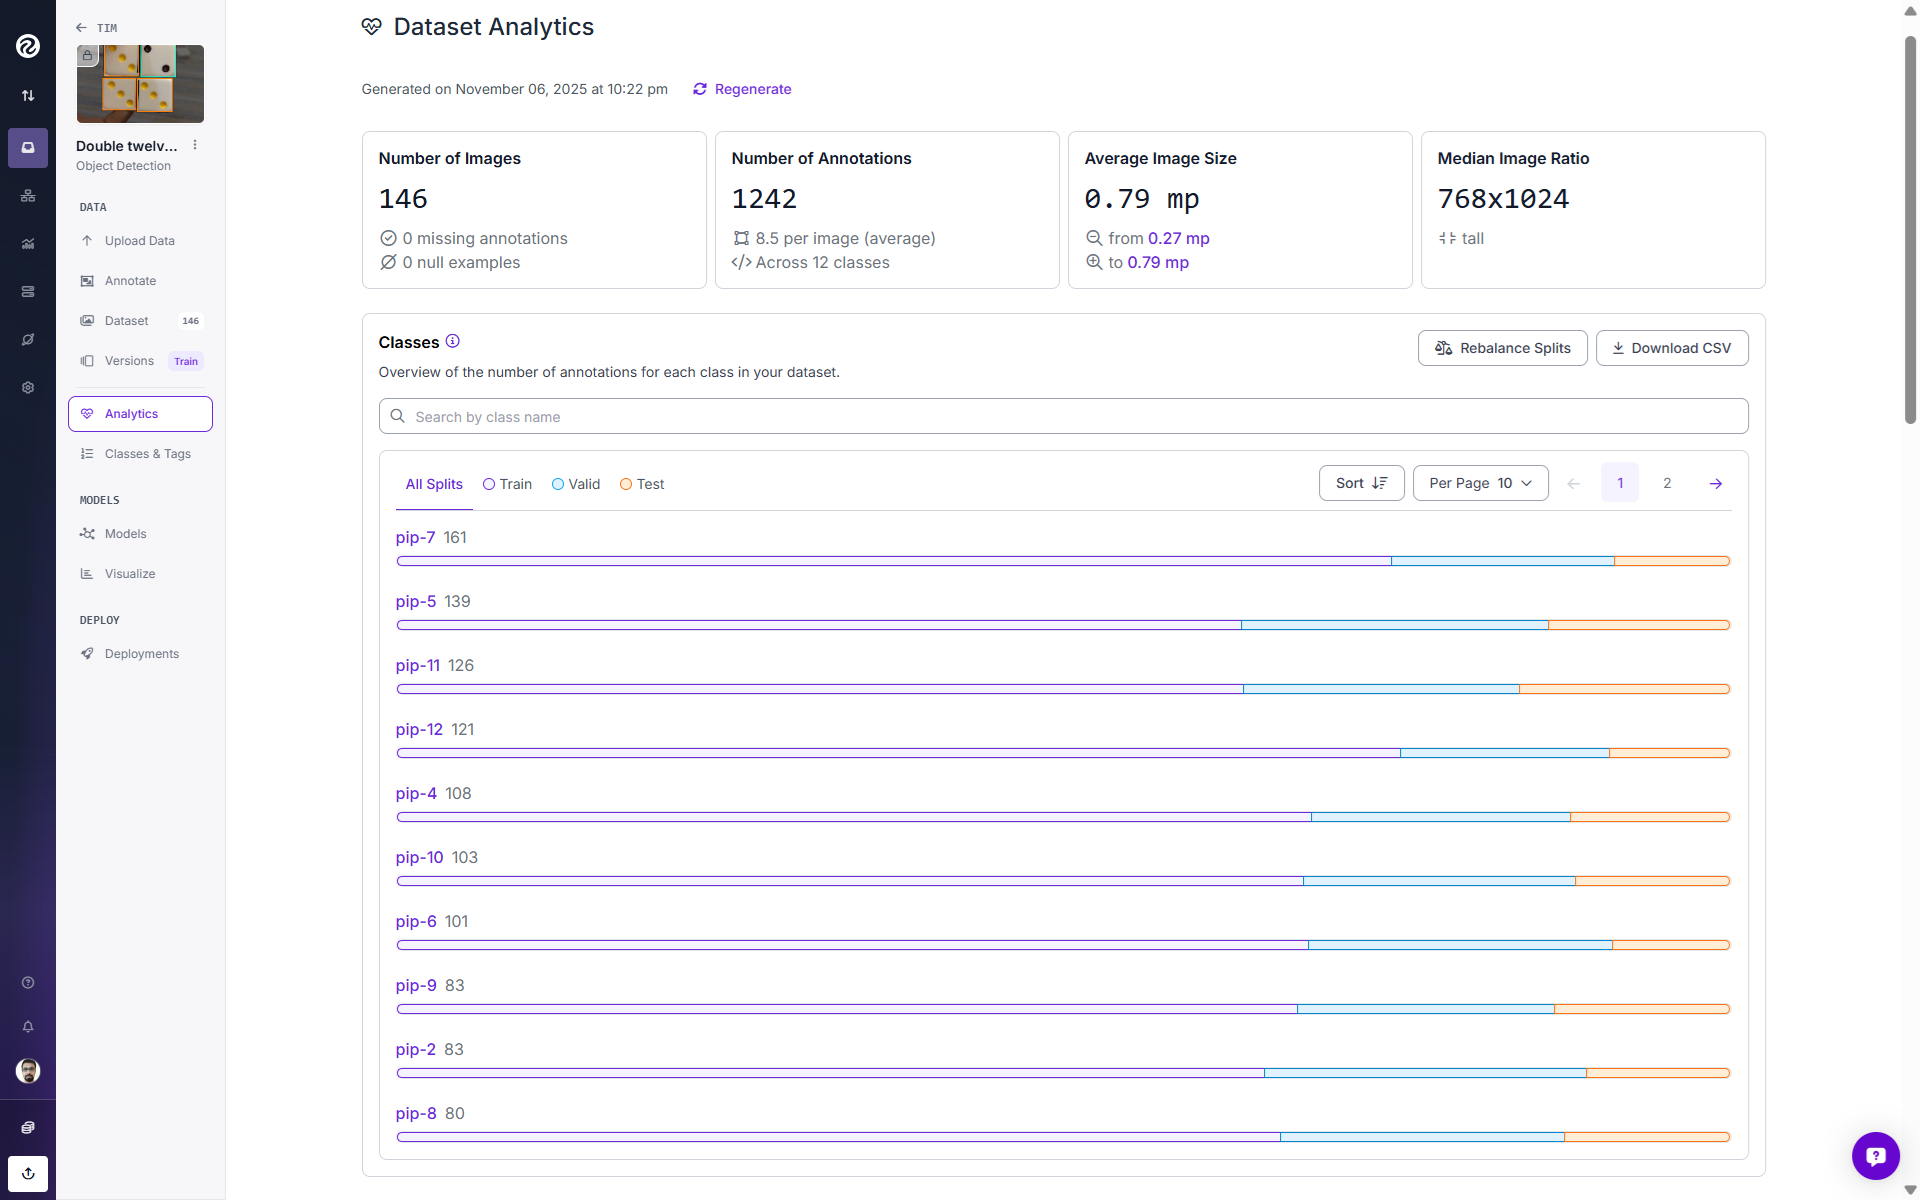
Use the “Analytics” to evaluate your dataset for improving and training a better model.
3. Create a dataset version
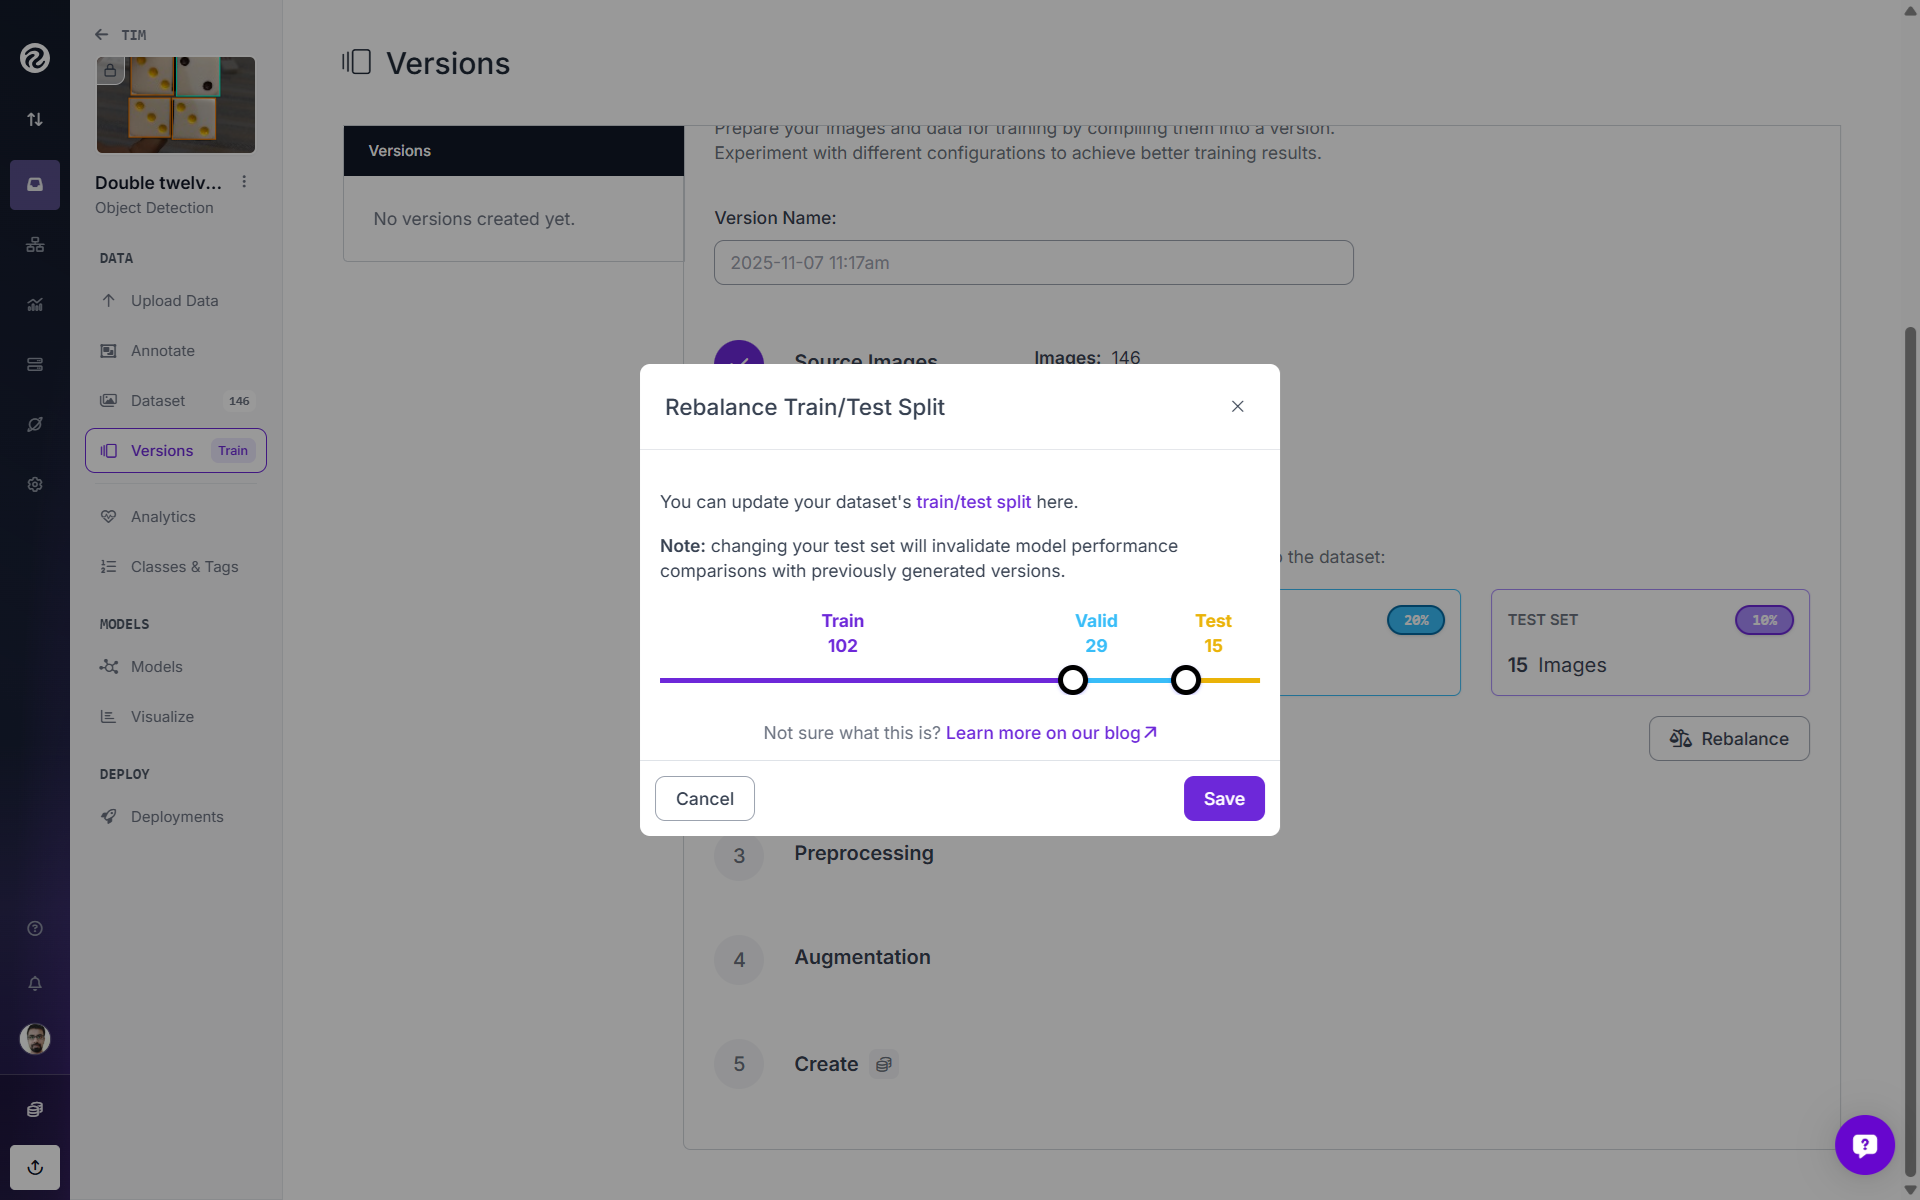
After the dataset is labeled, create a dataset version. In the “Dataset Version” flow, choose an initial split (e.g., 70 % train, 20 % validation, 10 % test). Roboflow allows stratified splitting by class, and ensures that duplicates are not split across sets. However, you may also rebalance this split manually within the same interface.
After the split, apply preprocessing steps such as resizing and augmentations (flips, brightness adjustments, and noise). Roboflow applies augmentations offline to the training set, improving reproducibility and reducing GPU idle time. Finally, while creating the dataset version, choose the minimum version size, to increase the sample size.
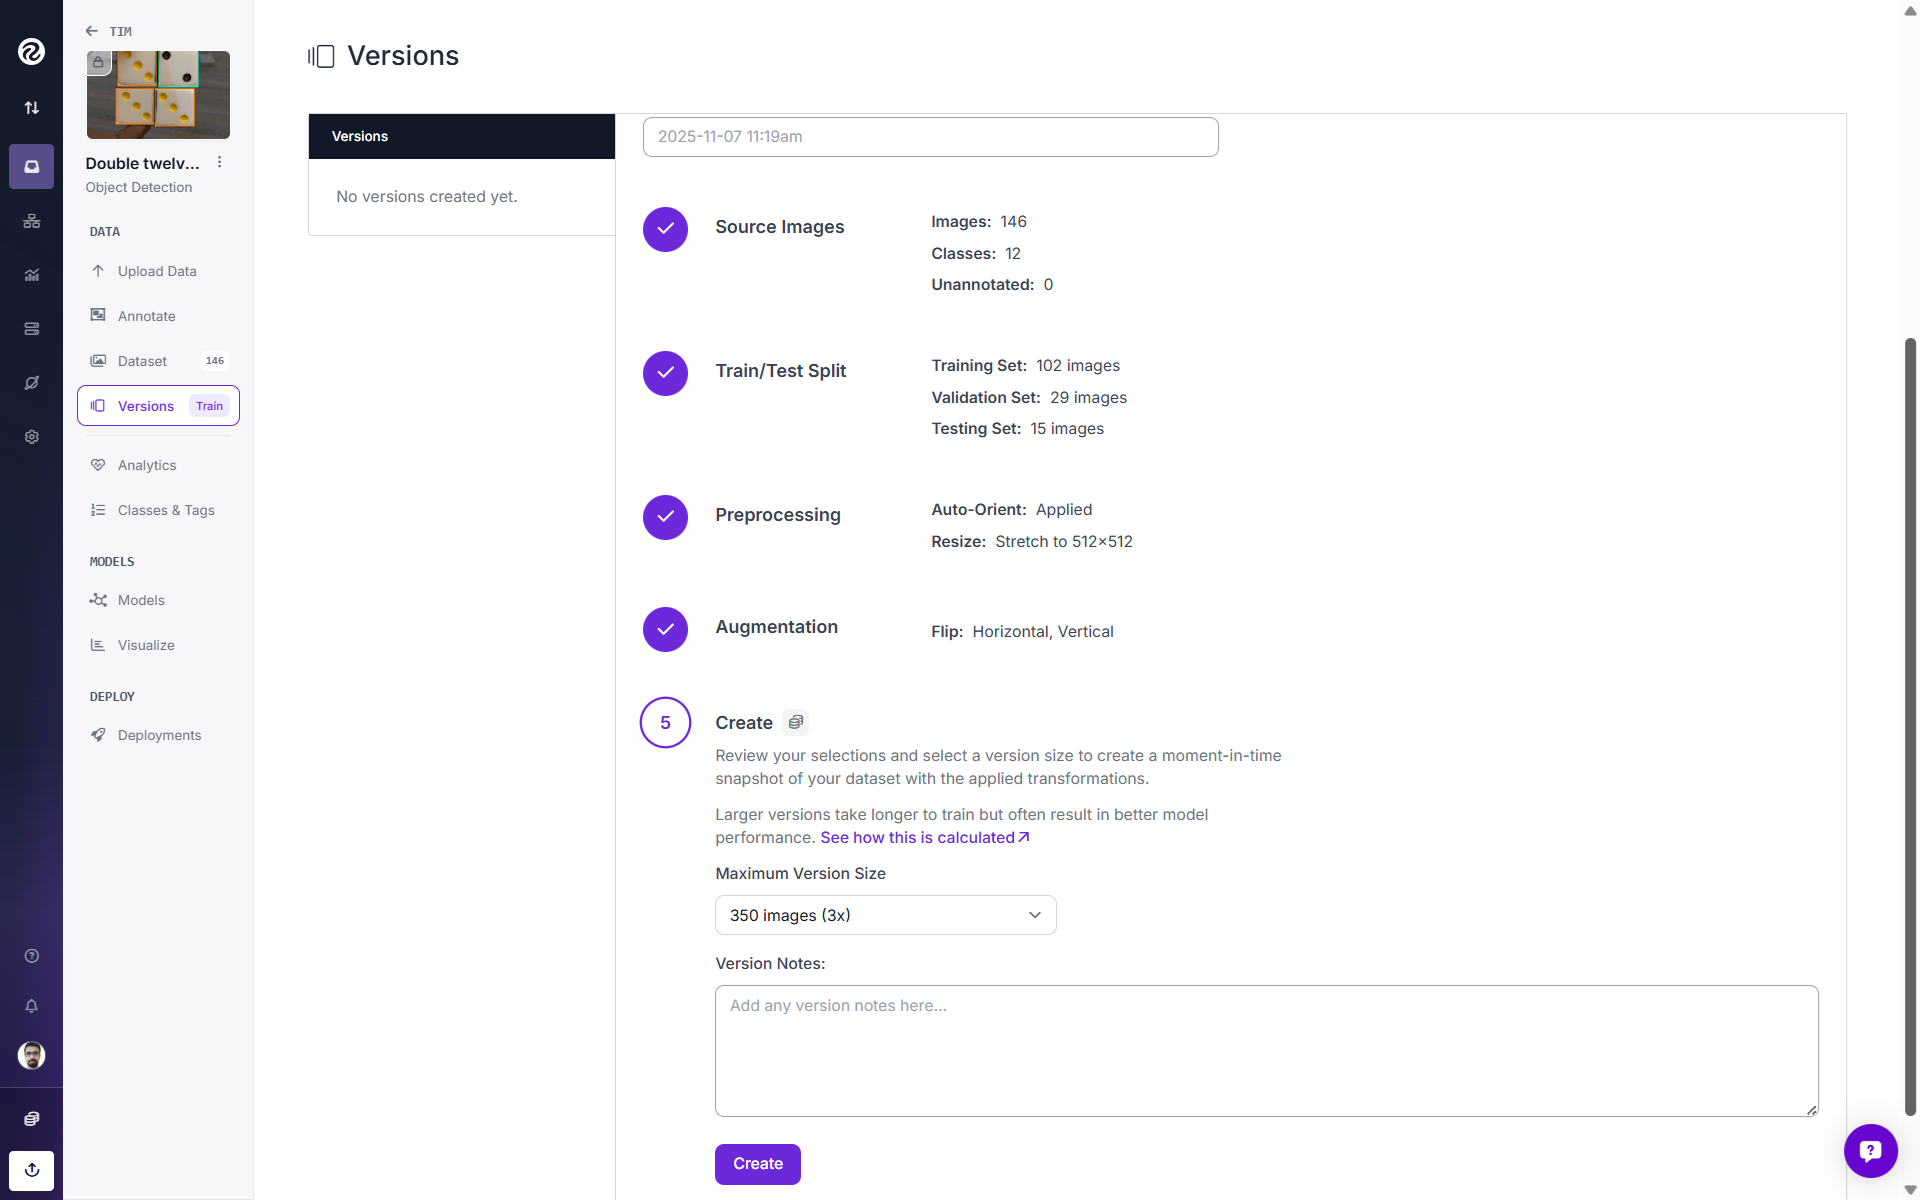
Now your dataset version has been created. In this example, originally we had 146 images in our dataset. But since we choose a version size of 3x, we ended up with a total of 350 images.
4. Train the model
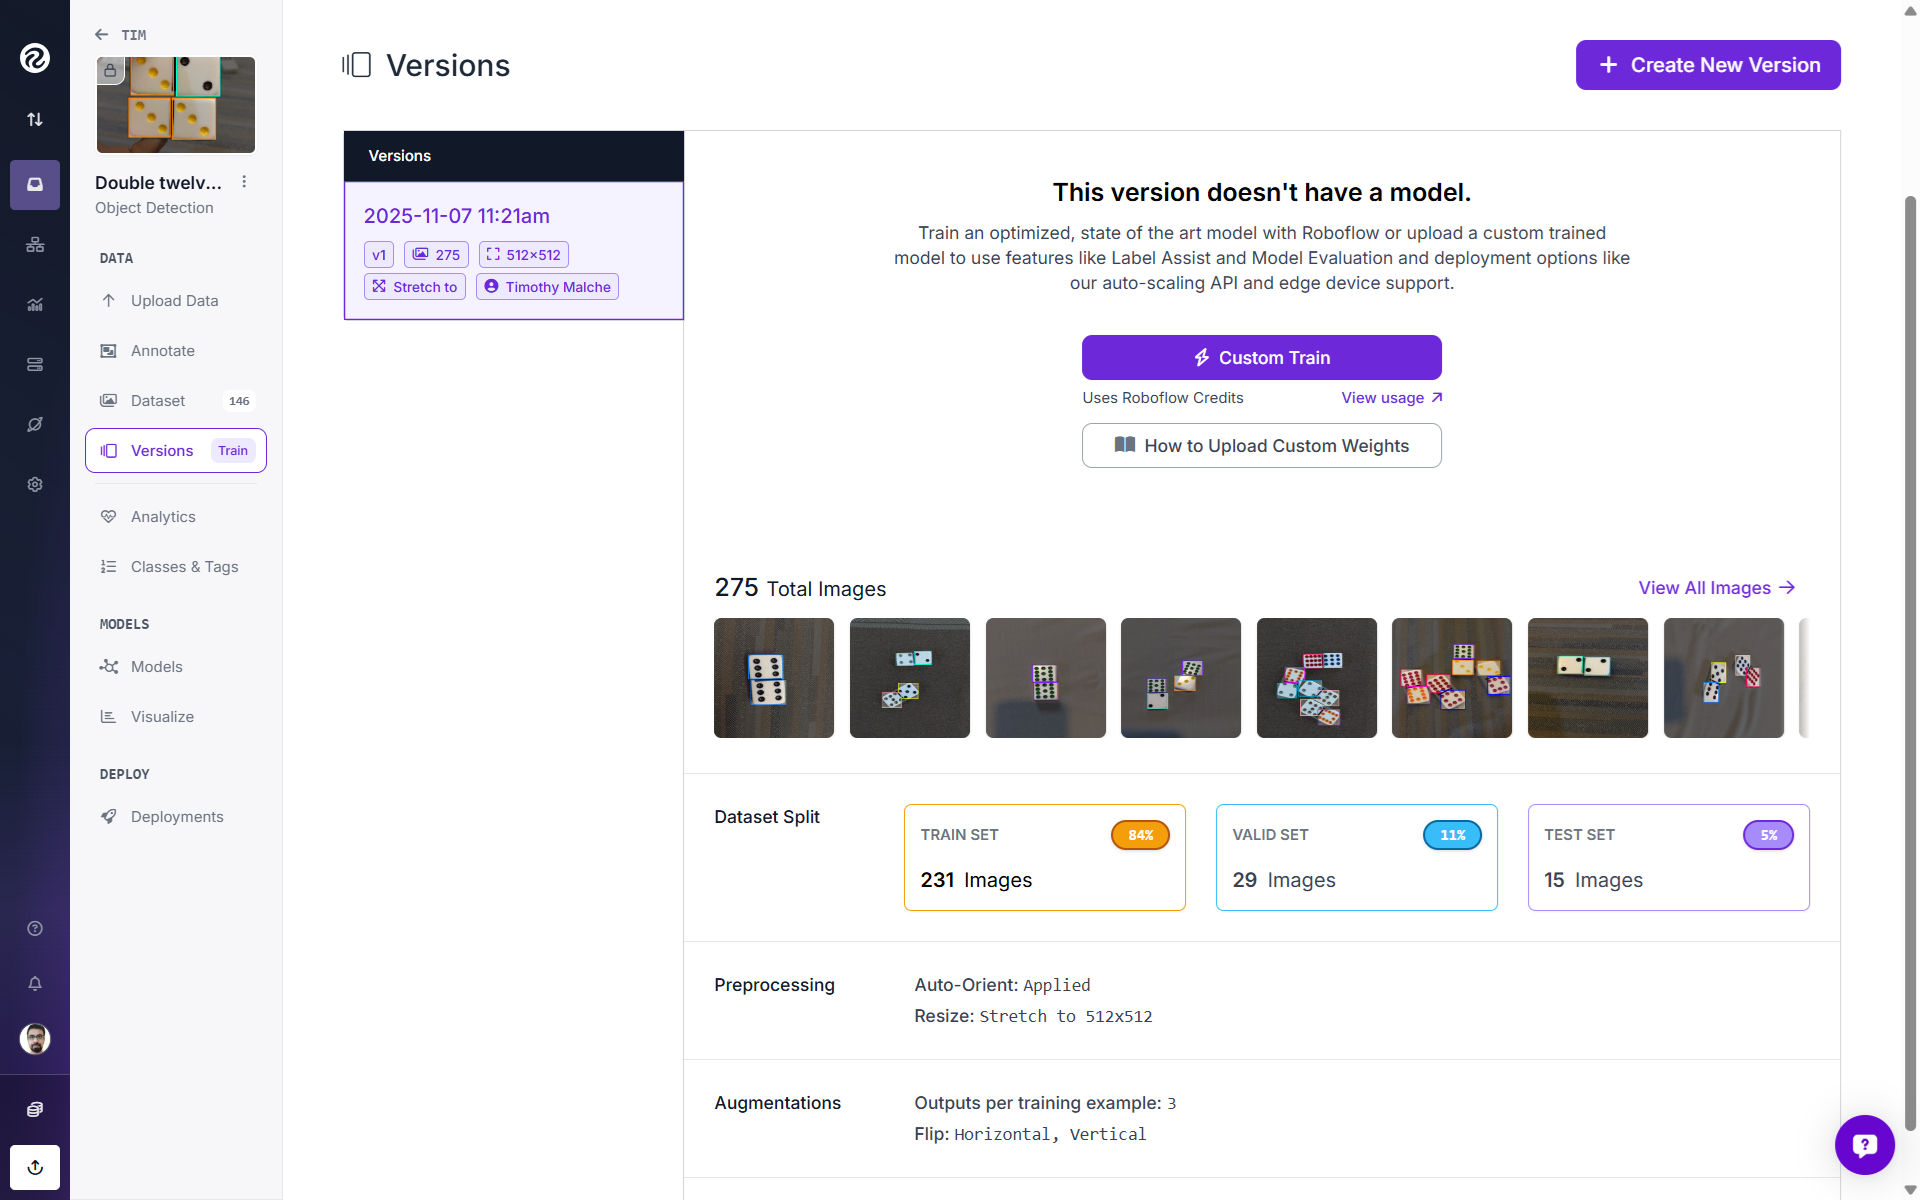
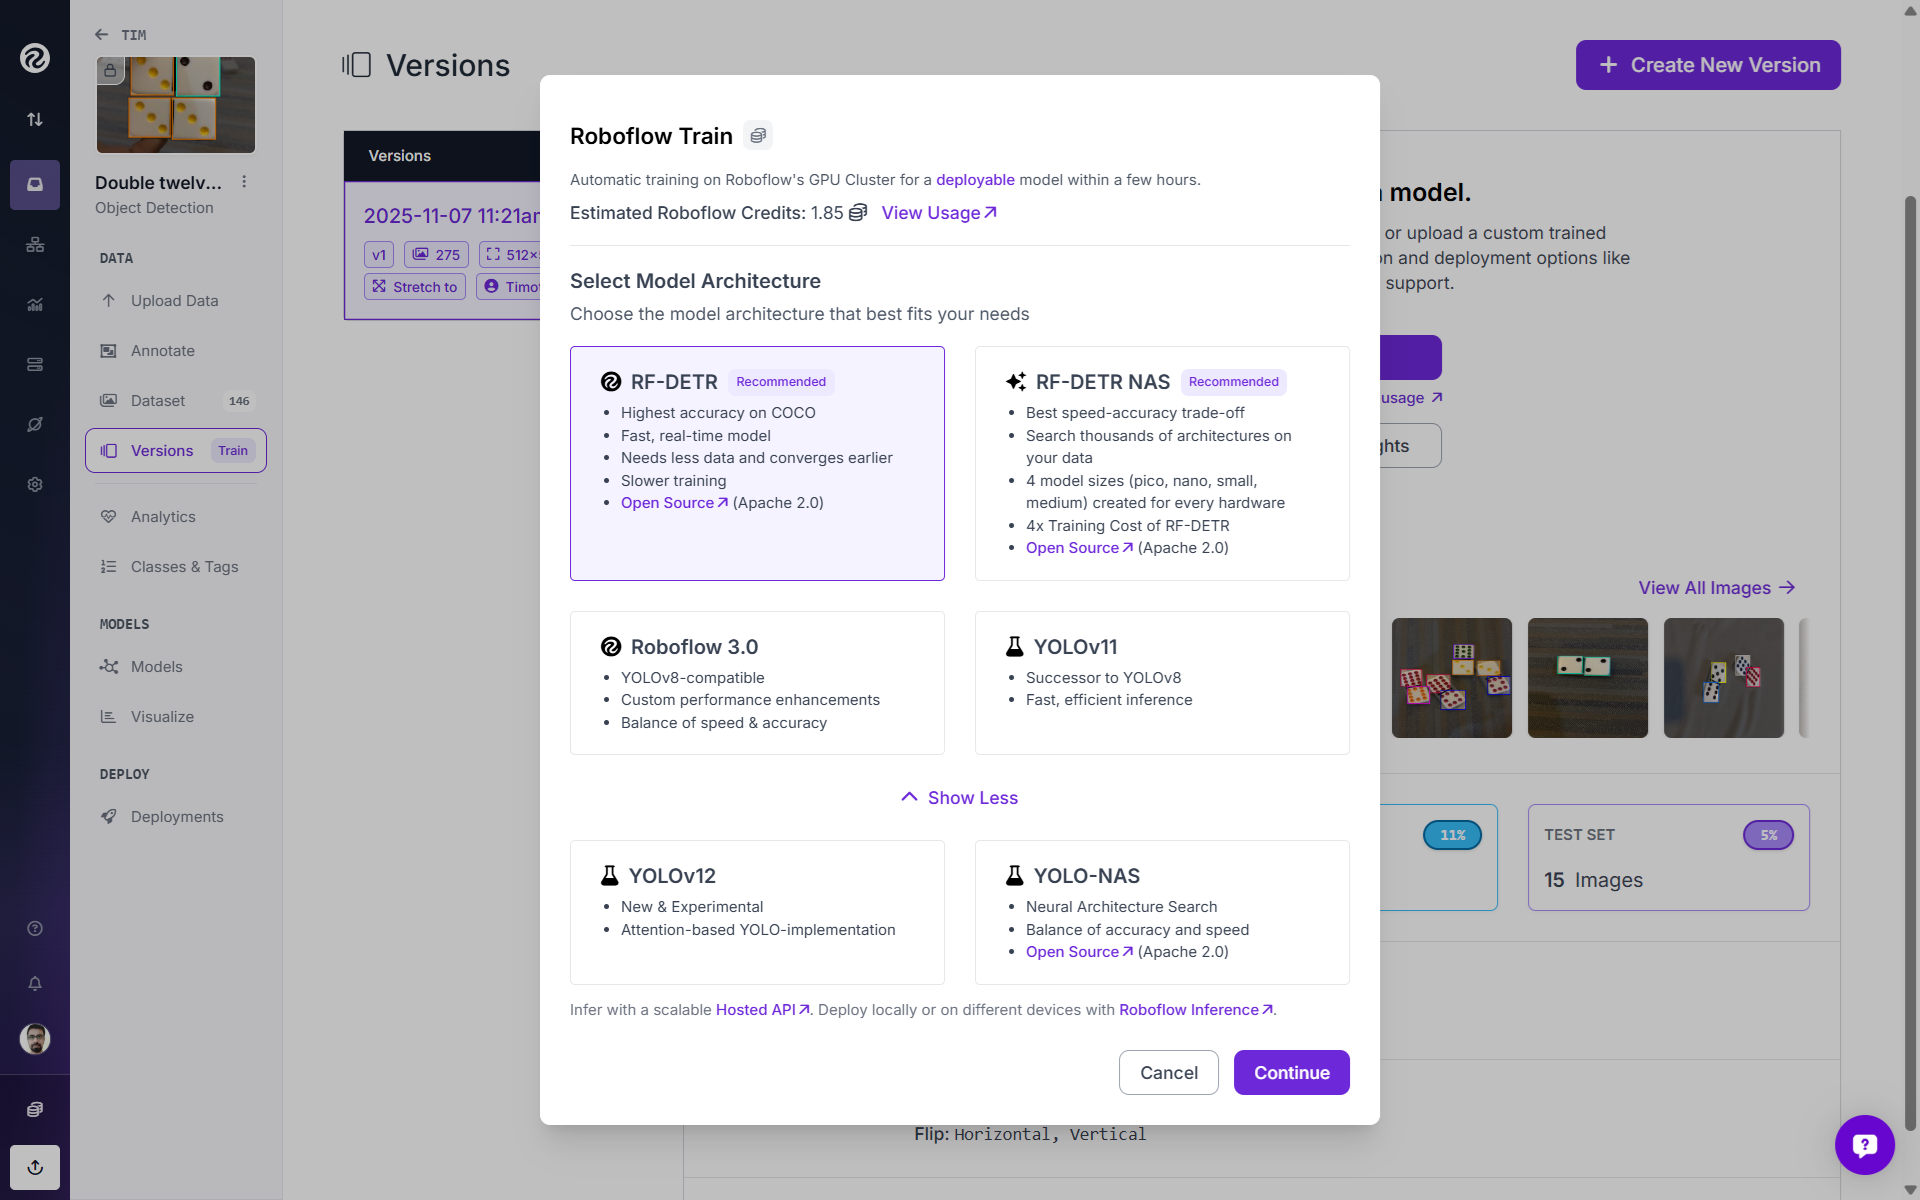
Once the dataset version is created, train the model by clicking the “Custom Train” button. Roboflow offers detectors such as RF‑DETR, Roboflow 3.0, YOLO11/v12, and YOLO‑NAS. For this example, I choose RF-DETR.
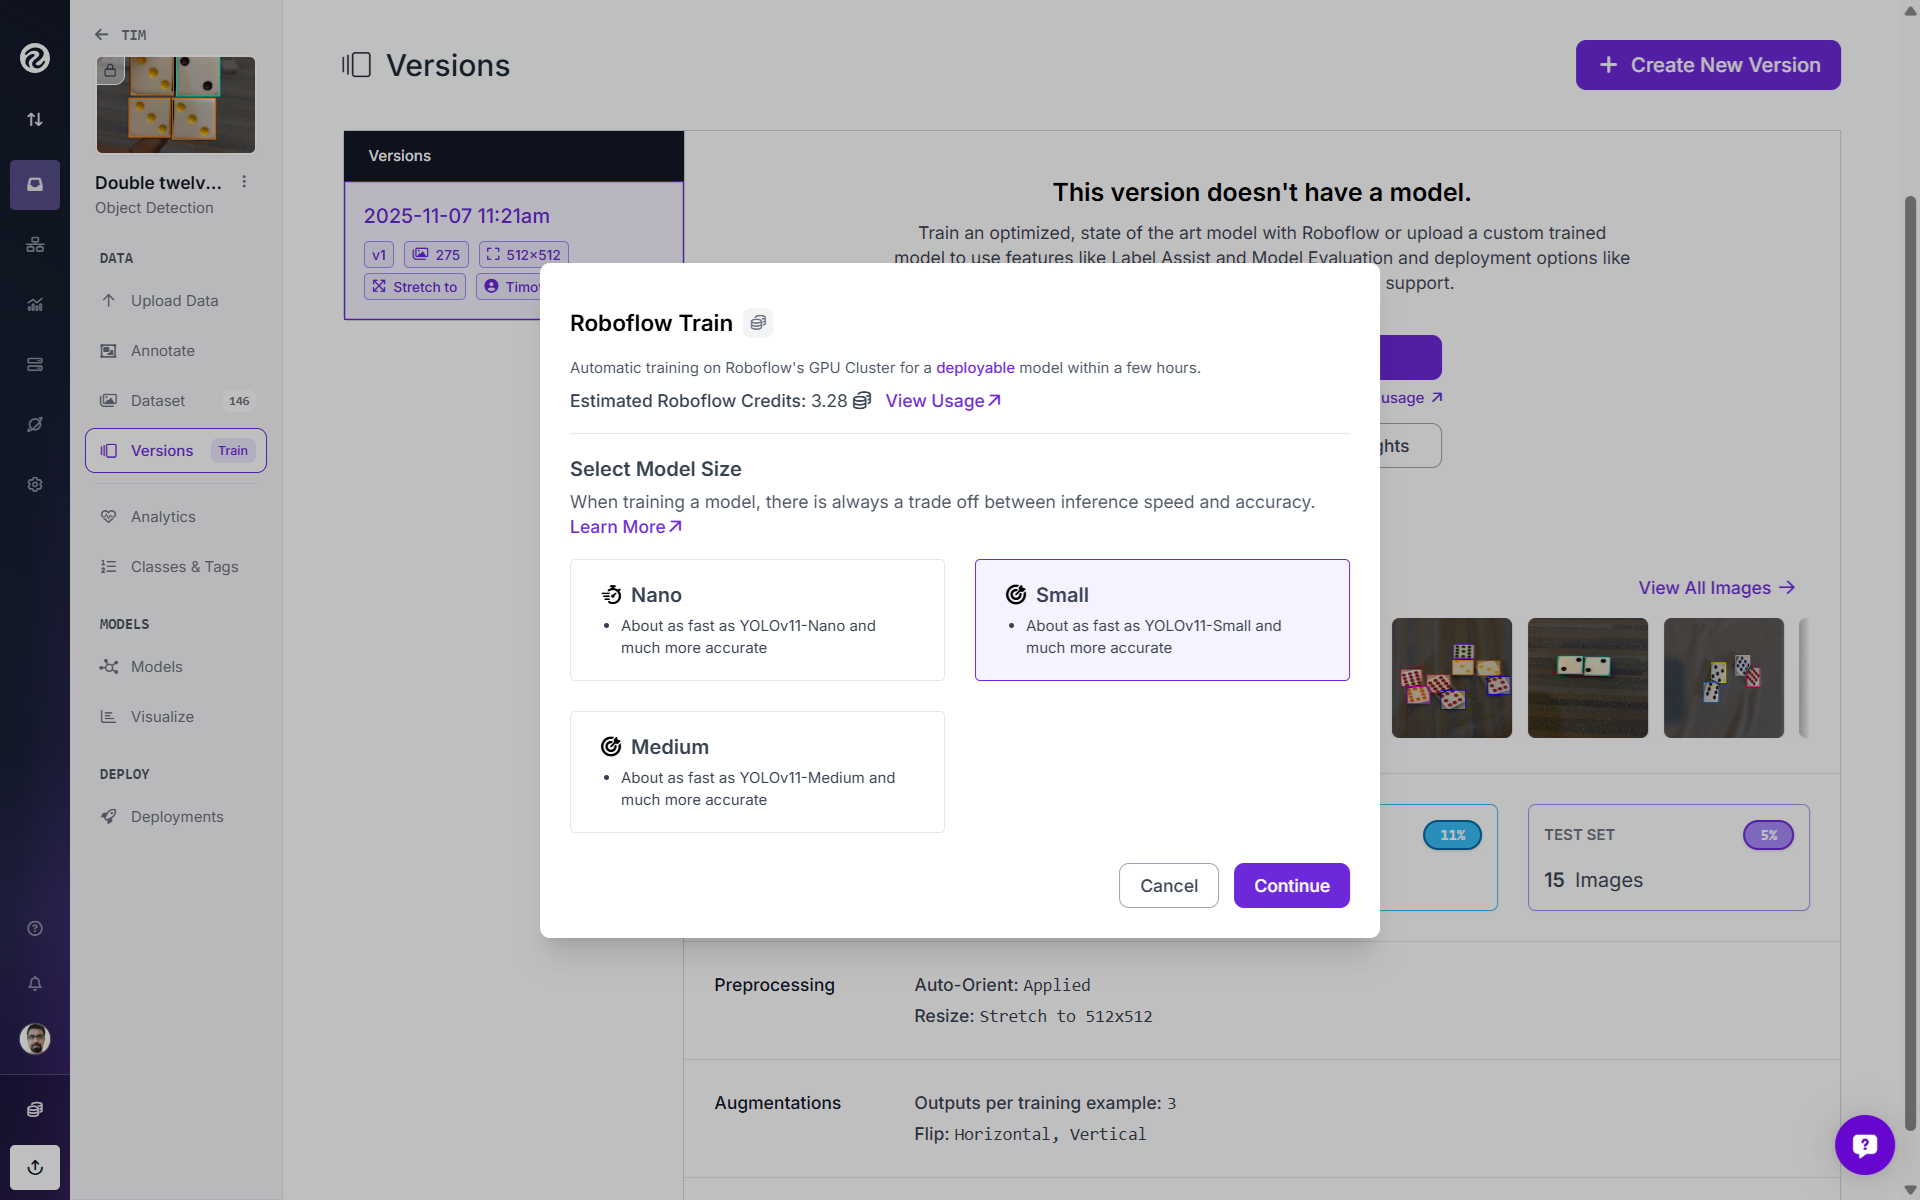
Your next step is to choose your model size. While creating this dataset version, I applied preprocessing to resize images to 512x512. Therefore, in the model size version I choose “small.” If you want to train an RF-DETR nano model for edge devices, the recommended maximum resize is 384x384.
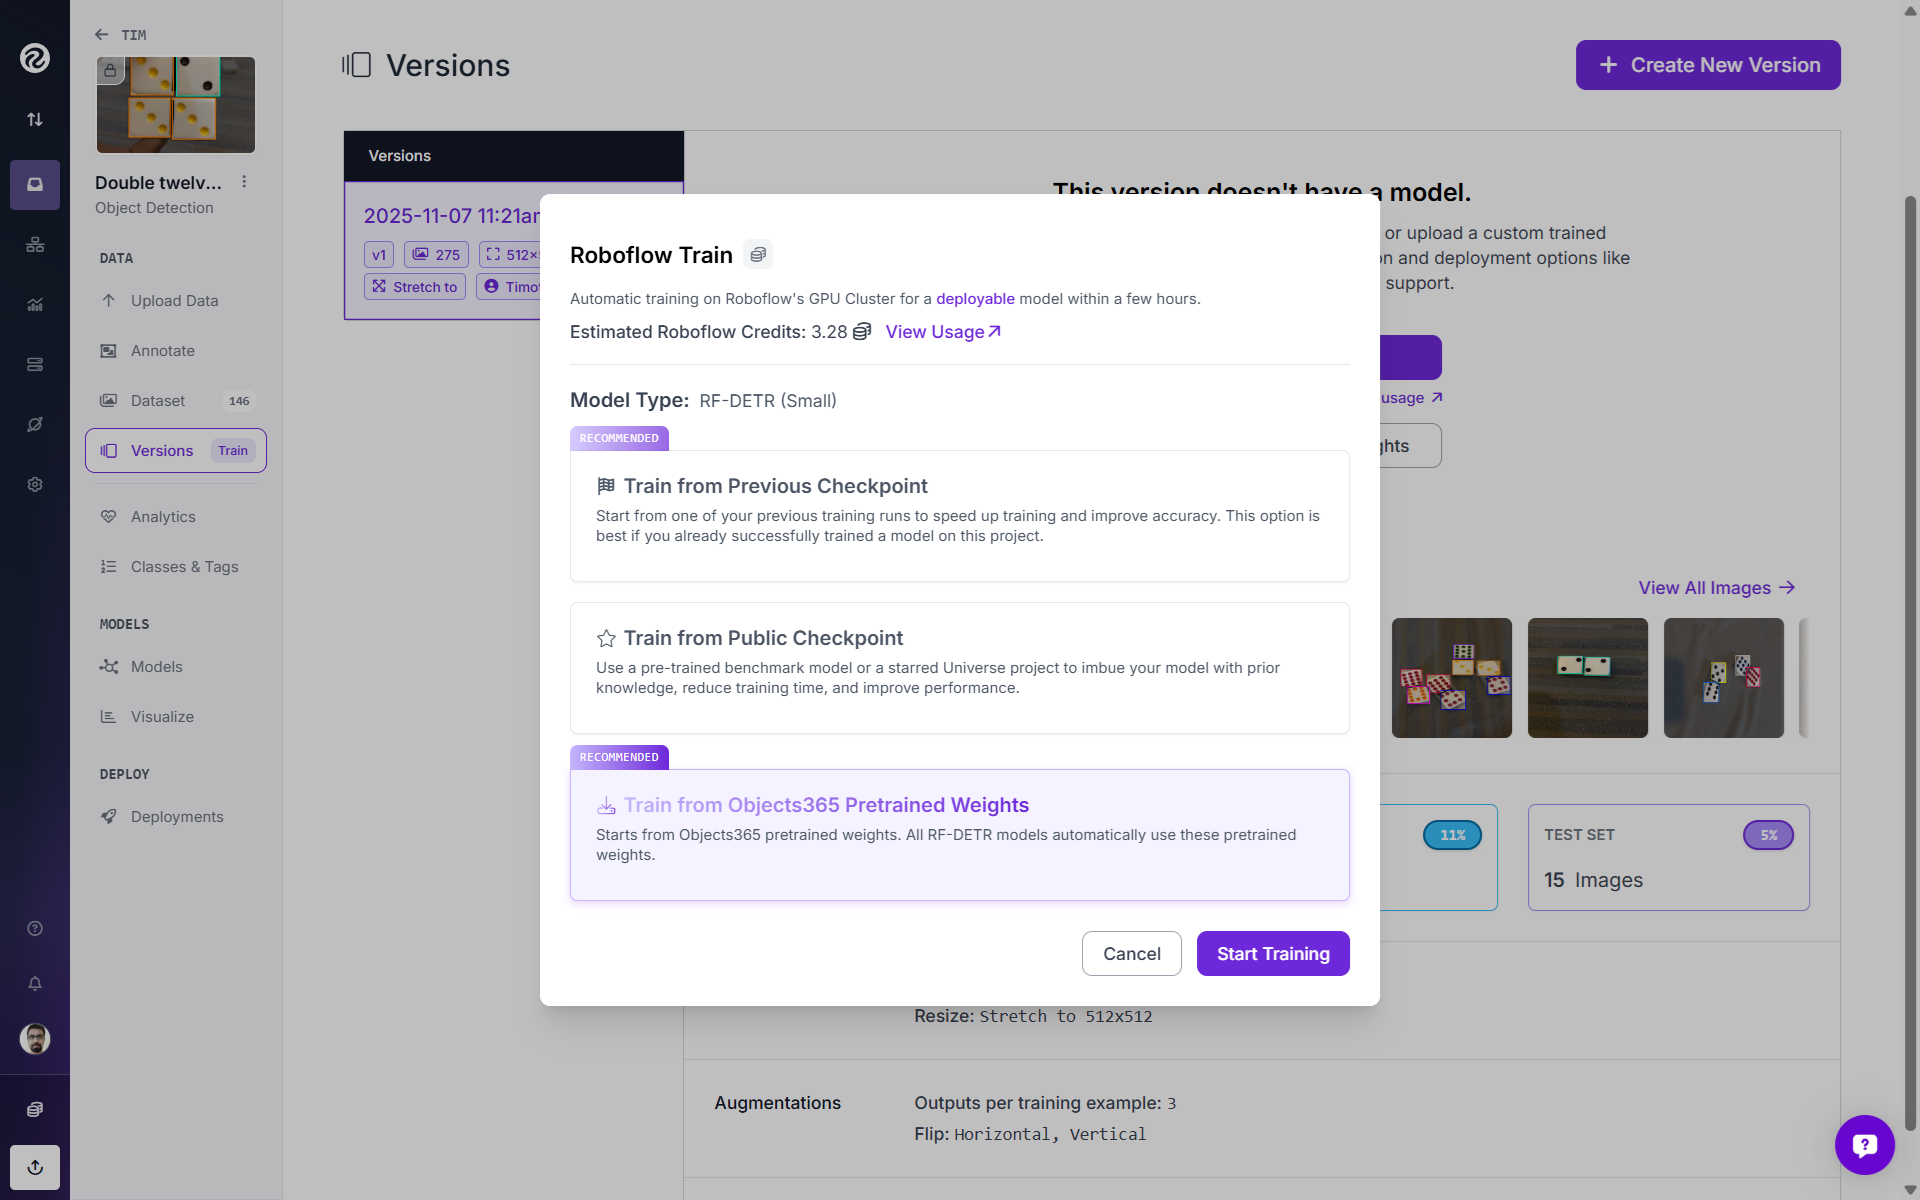
Your next step is to choose your checkpoint. Here, I selected “Train from Objects365 Pretrained Weights”.
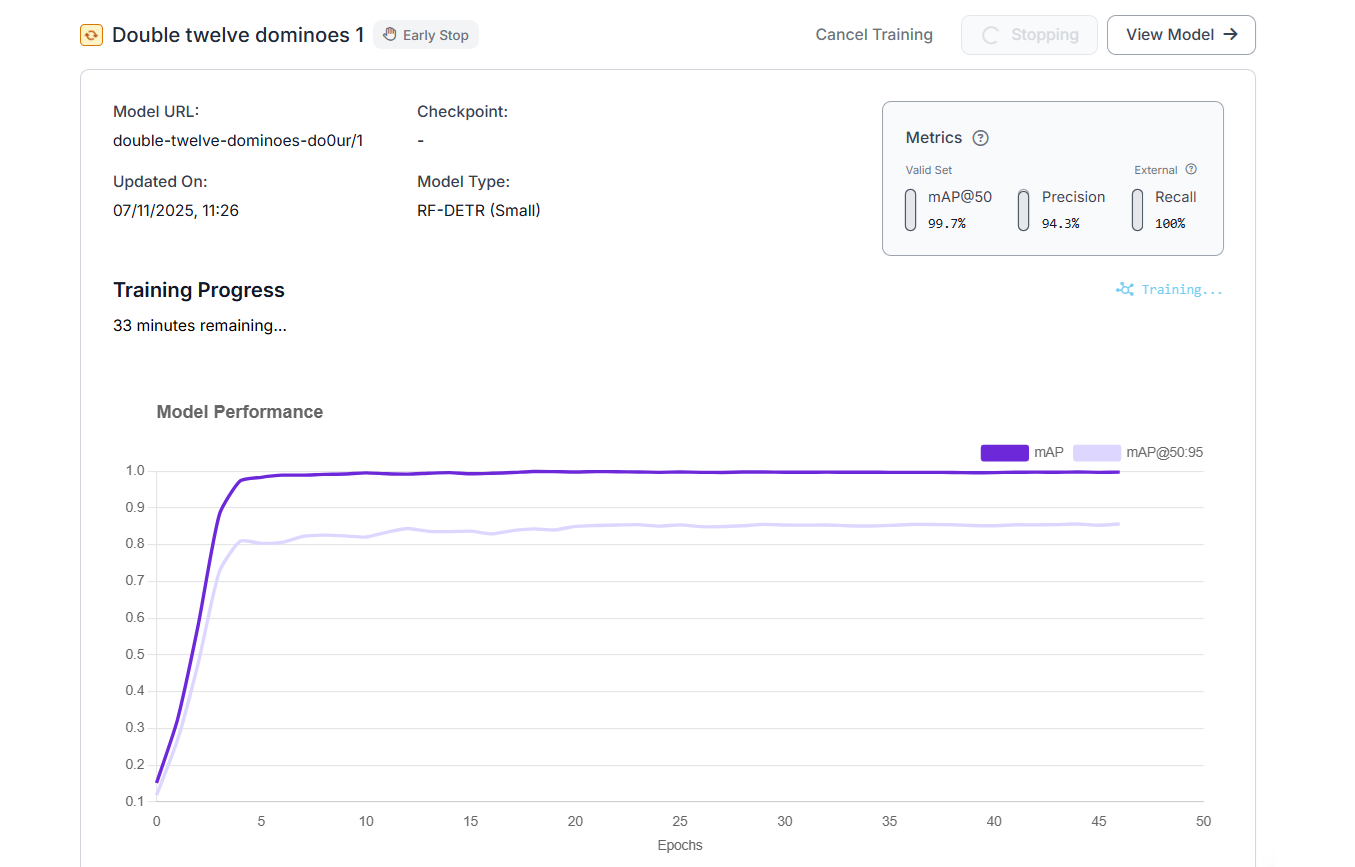
Finally, click “Start Training”. You can monitor training metrics in real time and stop training early if validation performance plateaus (early stopping).
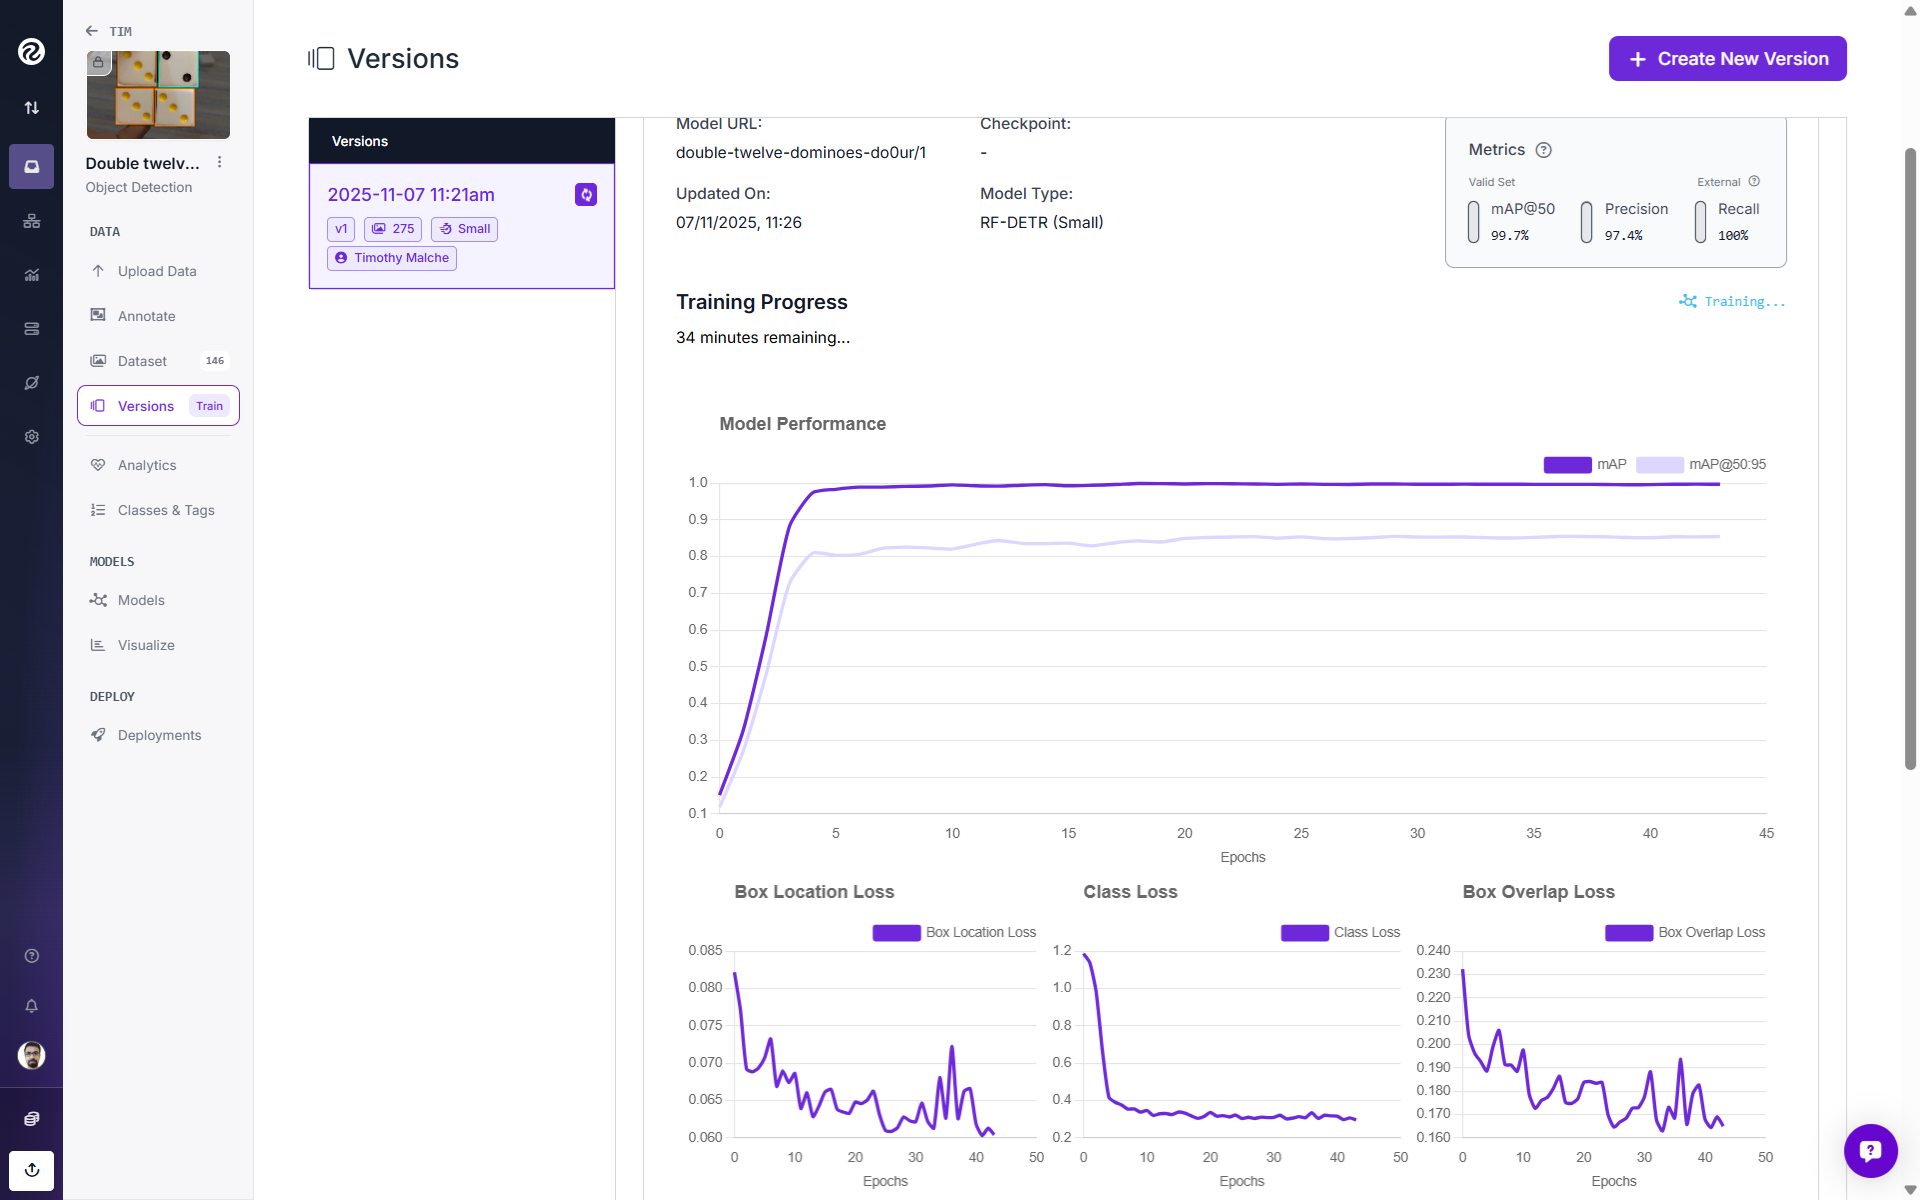
Since my model matrices were looking fine after a few epochs, I clicked “Early Stop” to stop training early and build the model.
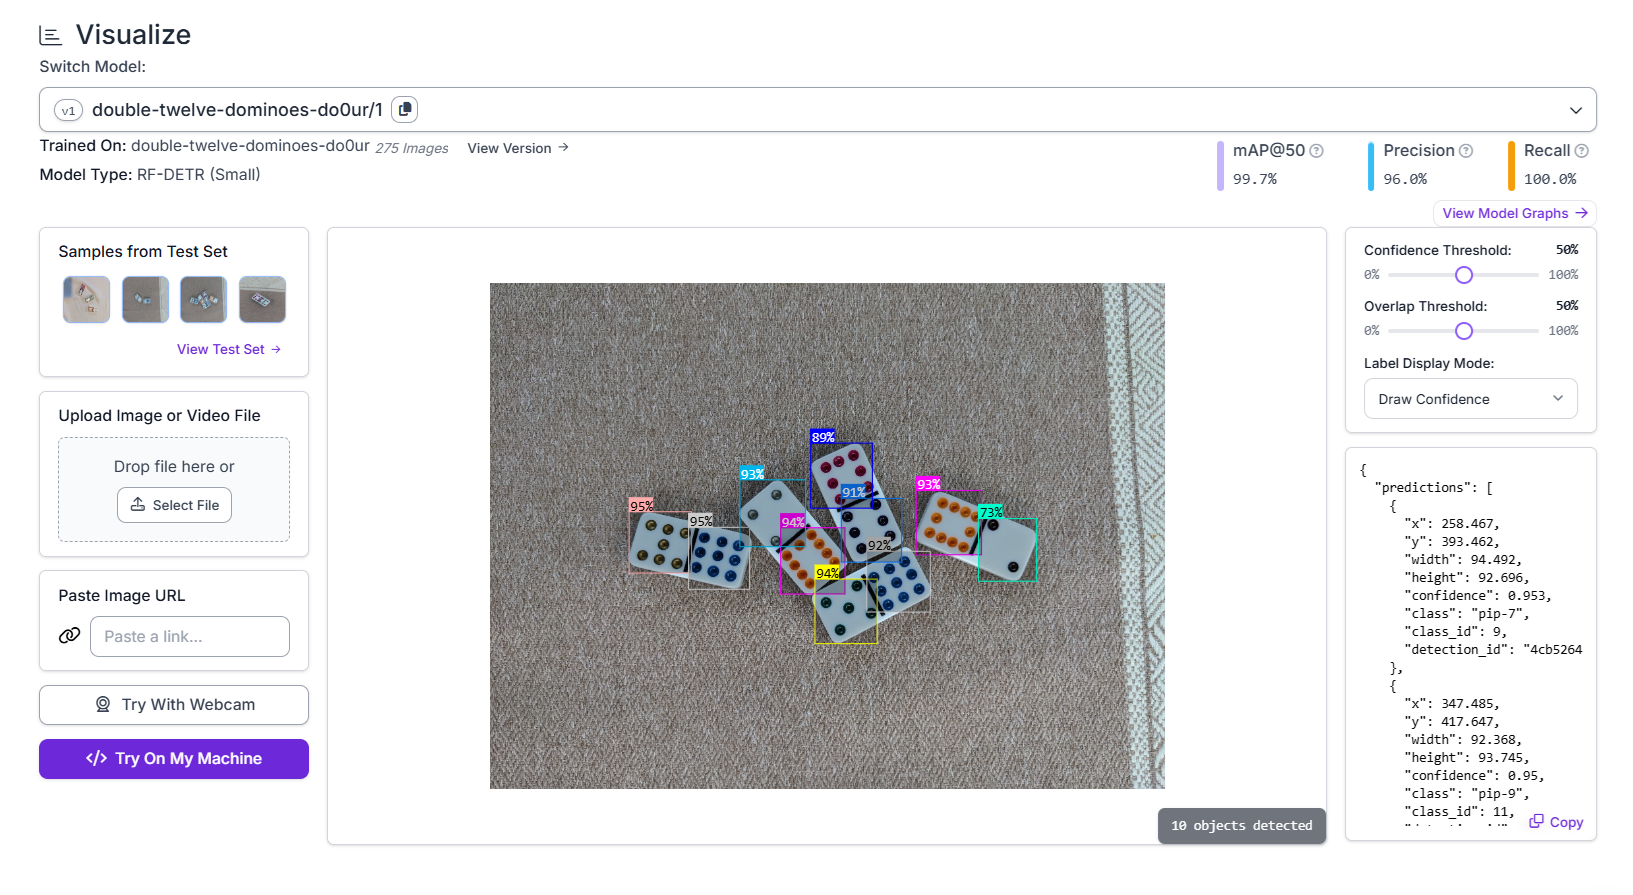
I tested the model, and it was working well.
5. Evaluate and deploy
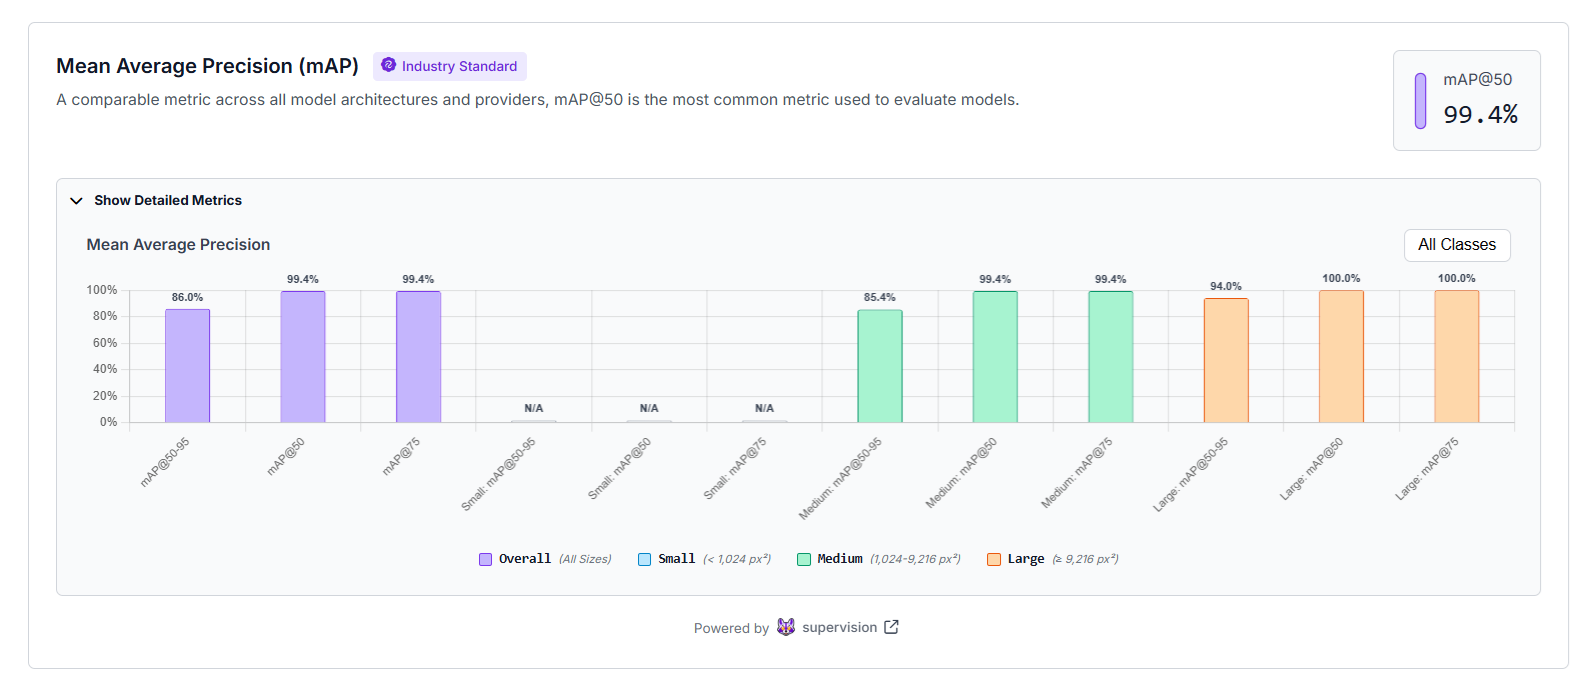
Now you need to evaluate the performance of your model. Mean Average Precision (mAP) shows how accurate your model is at detecting and classifying objects.
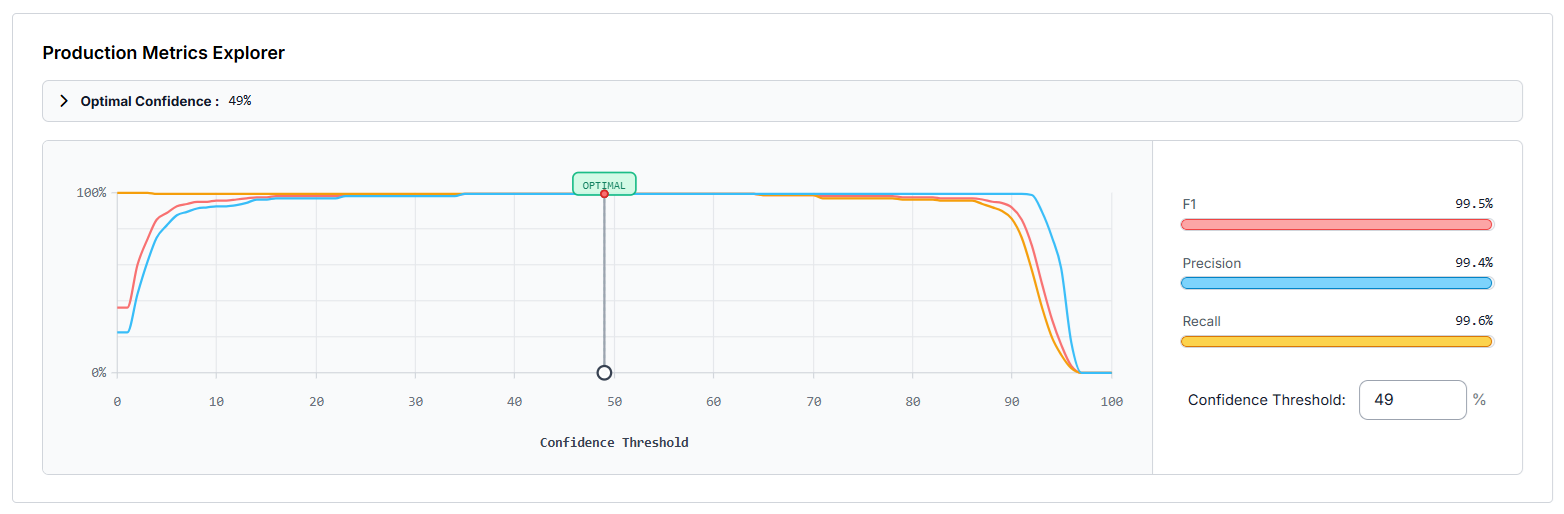
You can use the "Production Metrics Explorer" to find the best confidence setting for your model. The chart shows how precision, recall, and F1 score change as the confidence threshold moves. The optimal confidence point is marked to help you choose the best balance between catching all objects and avoiding false detections.
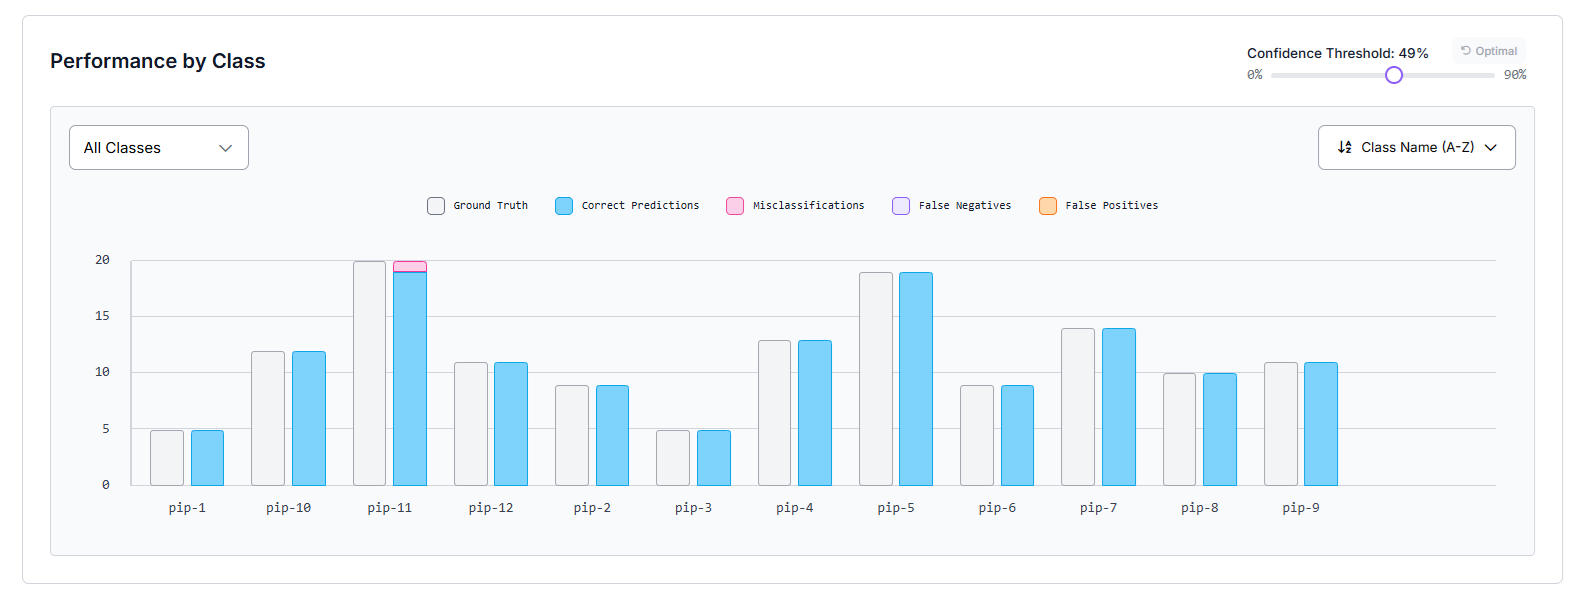
"Performance by Class" shows how well your model performs for each class. Each bar compares how many objects were correctly detected versus missed or misclassified, helping you quickly see which classes are performing well, and which need more training data or better labeling.
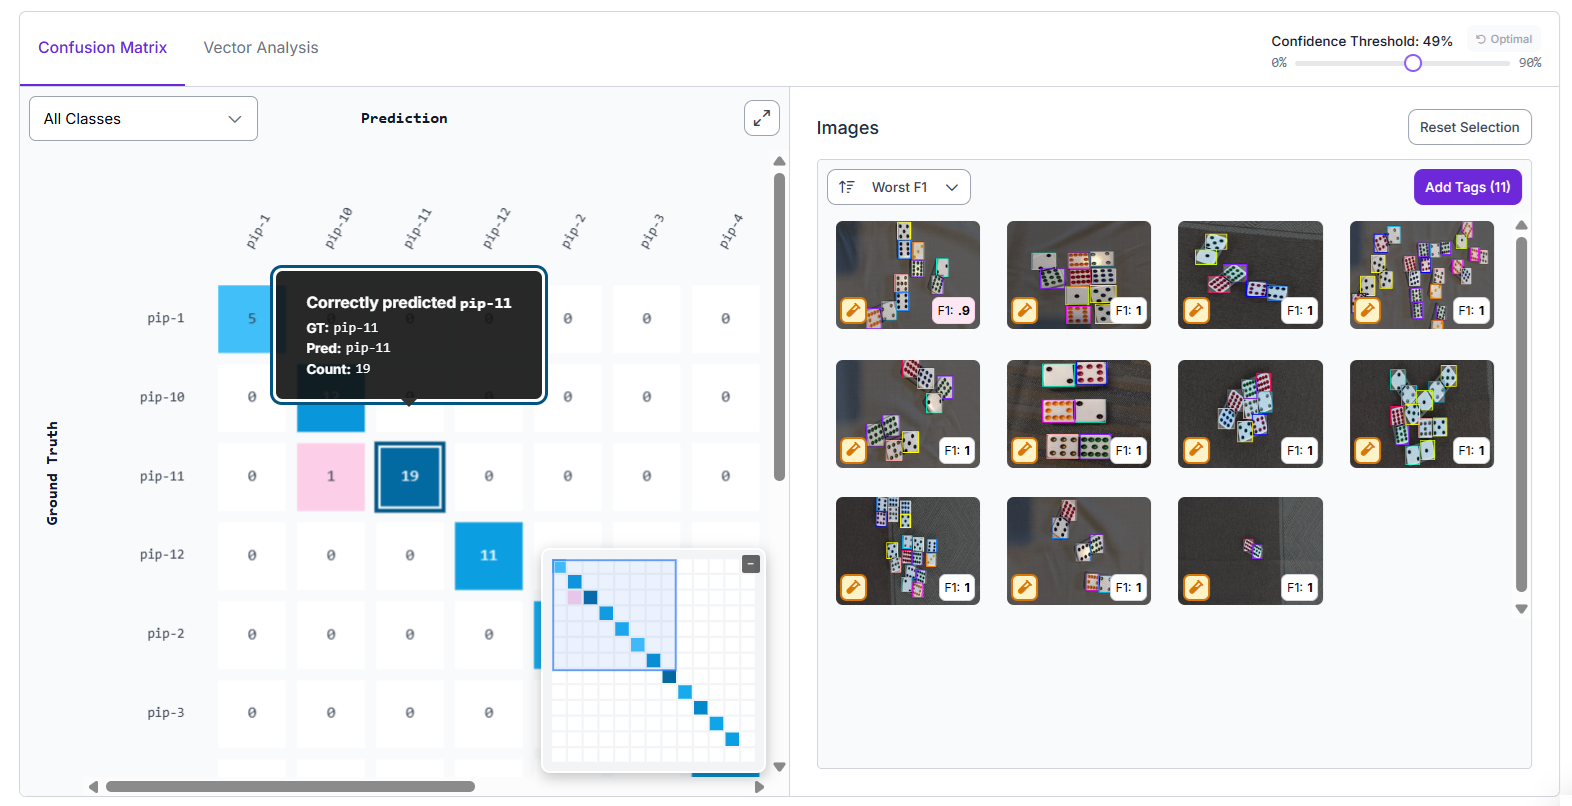
The "Confusion Matrix" compares what the model predicted versus the actual ground truth. The diagonal boxes show correct predictions, while off-diagonal boxes show where the model got confused between classes, helping you spot specific mistakes and patterns in errors.
"Image Viewer" next to the confusion matrix shows the actual images where the model made mistakes or performed well. You can click on a cell in the matrix to view those examples. This makes it easier to understand why certain predictions went wrong, such as unclear lighting or similar-looking objects.
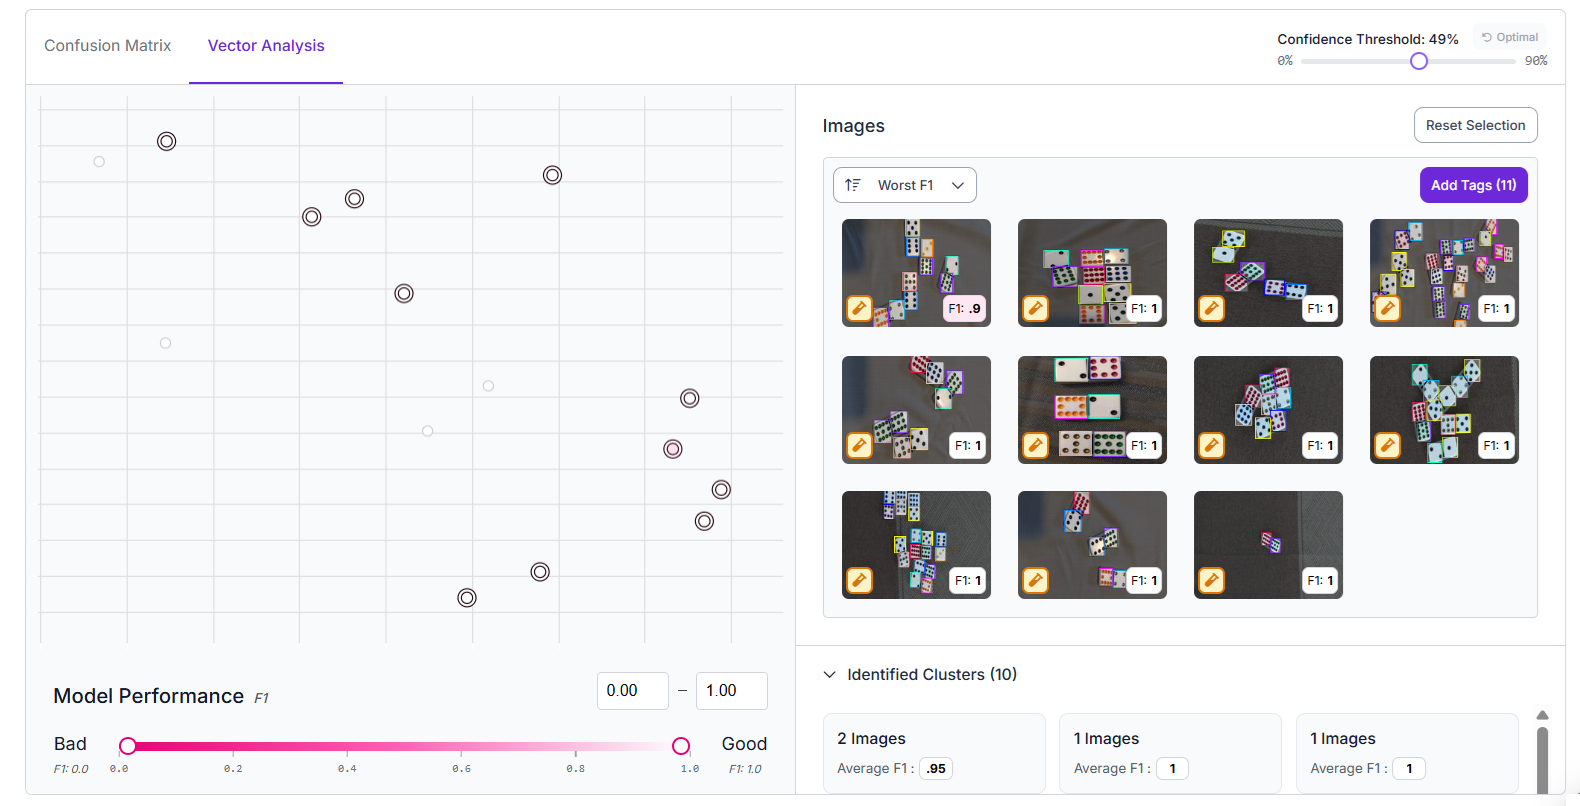
The "Vector Analysis" view plots every image as a point to show how well the model performed on it. Images with low scores are easy to spot, so you can find clusters of weak predictions. It’s a quick visual way to identify difficult cases or labeling problems that can be fixed to improve accuracy.
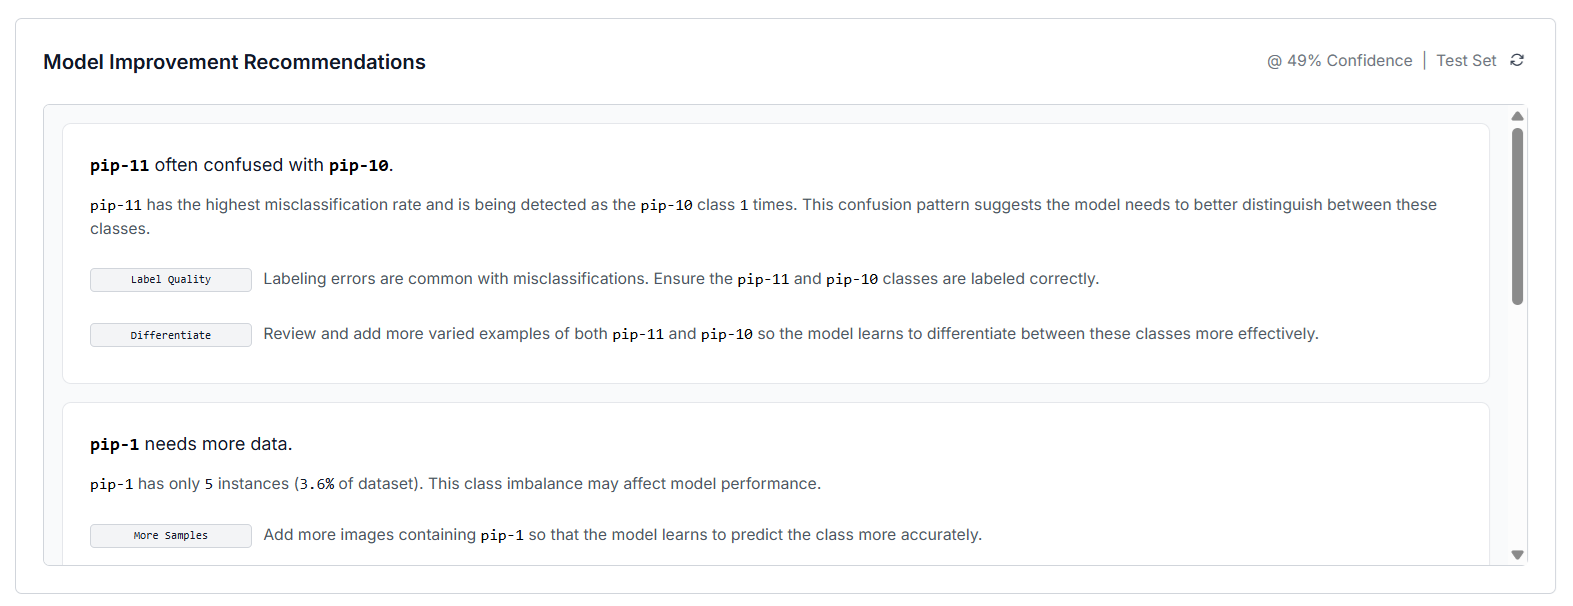
The "Model Improvement Recommendations" section automatically analyzes your model’s training results and suggests practical ways to improve performance. It highlights issues such as class confusion (when the model mixes up similar categories), data imbalance (when some classes have too few images), and small or unbalanced dataset splits. For each issue, it gives clear guidance, such as add more examples, improve label quality, or adjust data splits which helps you make your dataset stronger and your model more accurate in future training rounds.
All of these model analysis features provide insight into how your model is performing and where it needs to be improved. Once satisfied, deploy your model via Roboflow’s hosted API, edge deployment, or on‑device inference. In production, monitor model performance and collect new data from failure cases. Feed these images back into the dataset for continual improvement.
Conclusion: How Much Training Data Is Needed to Train a Computer Vision Model
The size of your dataset should be determined by your task complexity, class diversity, label quality, and compute budget. By combining careful data collection, splitting, evaluation, and active learning, you can achieve production‑grade performance with a manageable amount of data. You will know when you have “enough” by looking at your learning curves and real‑world performance. Get started today with Roboflow.
Cite this Post
Use the following entry to cite this post in your research:
Timothy M. (Nov 10, 2025). How Much Training Data Do You Need to Train a Computer Vision Model?. Roboflow Blog: https://blog.roboflow.com/how-much-training-data/