
Automated fault identification is an emerging application of computer vision that is revolutionizing pipeline monitoring and maintenance. Using automated fault detection systems, businesses can better manage critical infrastructure for the transportation of petroleum products, natural gas, water, sewage, chemicals, and more.
In this guide, we're going to talk through how to build a physical pipeline monitoring system with computer vision. We will:
- Define a problem statement;
- Choose a dataset with which we will train our model;
- Define the hardware required to collect images;
- Train an RF-DETR model to identify various defects in a pipeline, and;
- Test our model.
Without further ado, let's begin!
Understanding the Problem
Using computer vision algorithms, businesses can analyze images and video streams for various signs of physical pipeline degradation, including:
- Cracks
- Corrosion
- Leakages
This technology provides numerous advantages, such as increased efficiency, expense savings, enhanced safety, and data-driven decision-making.
Automated pipeline fault detection using computer vision can help guarantee the safe and dependable operation of pipelines and reduce the risk of environmental catastrophes with continuous monitoring of pipelines, identifying defects, and giving real-time feedback.
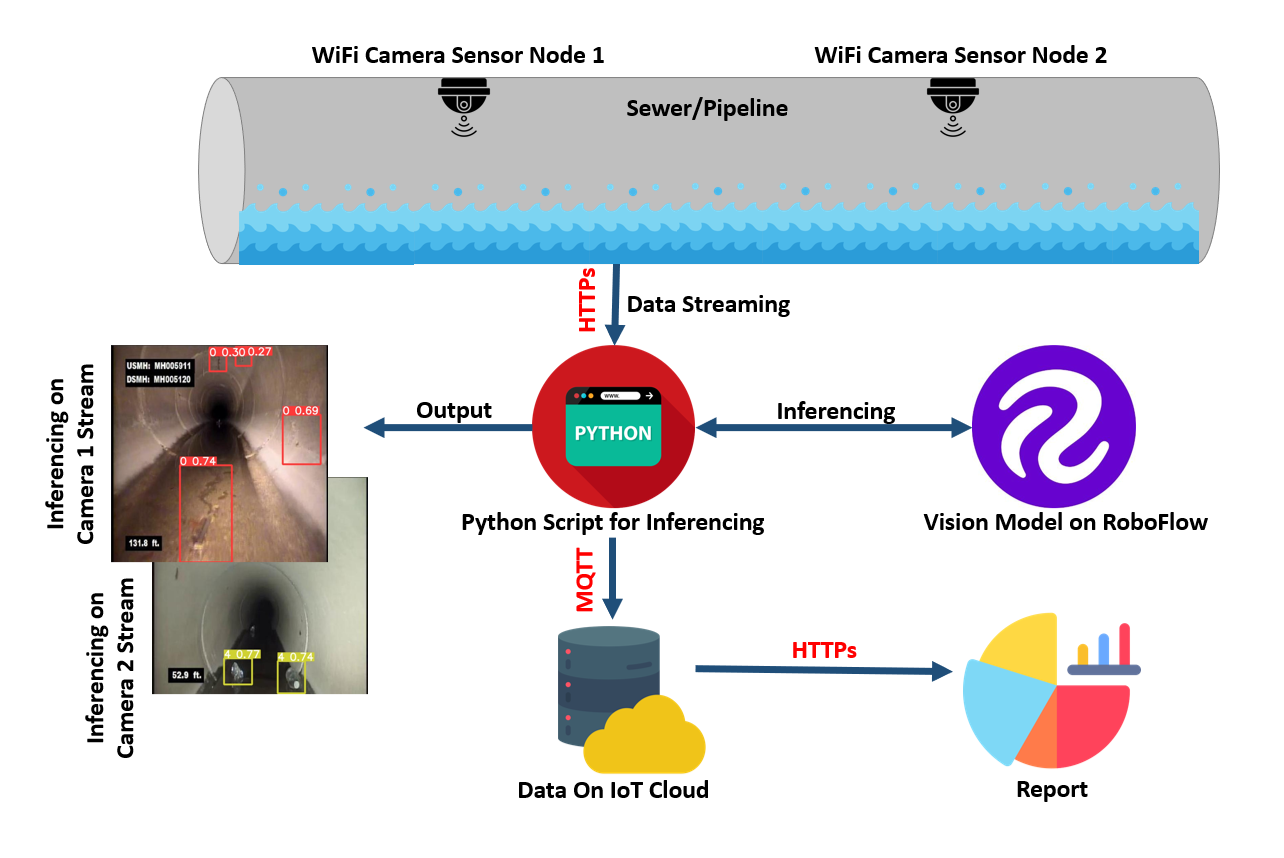
To solve this problem, we're going to build a system that uses computer vision to identify issues with the pipeline. We will build logic on top of this model to save data when issues are identified in a pipeline. Here is a diagram of the system we are going to build:
Why Use Computer Vision for Pipeline Inspection?
When compared to conventional manual checks, computer vision is a more efficient, robust, and cost-effective way of finding pipeline defects.
First, continuous inspection using computer vision allows for the early discovery of defects before they become significant. This results in reduced downtime and savings from expensive repairs or even pipeline failures.
Furthermore, computer vision models can identify flaws in real time, giving instant feedback and allowing for prompt action. This helps businesses ensure pipelines are in good shape, lowering the risk of environmental catastrophes and ensuring continuous service delivery.
Here are a few more benefits of using computer vision for pipeline inspection:
- Worker Safety: Independent of environmental circumstances or operator biases, it can identify faults reliably, ensuring that all defects are found and also help identify potential hazards before they cause accidents, protecting both workers and the environment.
- Predictive maintenance: Computer vision-assisted pipeline fault identification can provide data and ideas that can be used for predictive maintenance. Operators can detect possible faults in pipeline data by analysing trends over time, decreasing delay and upkeep costs.
- Regulatory compliance: Using computer vision to identify pipeline faults can assist pipeline owners in meeting regulatory requirements for pipeline safety and environmental protection. Operators can guarantee regulatory compliance by offering constant tracking and fault detection.
- Decision-making: Using this method, a significant quantity of data can be generated that can be used to make data-driven decisions. Operators can spot patterns and make informed choices about upkeep and repairs by analysing pipeline data over time, lowering costs and increasing efficiency.
Automated Pipeline Inspection System Architecture
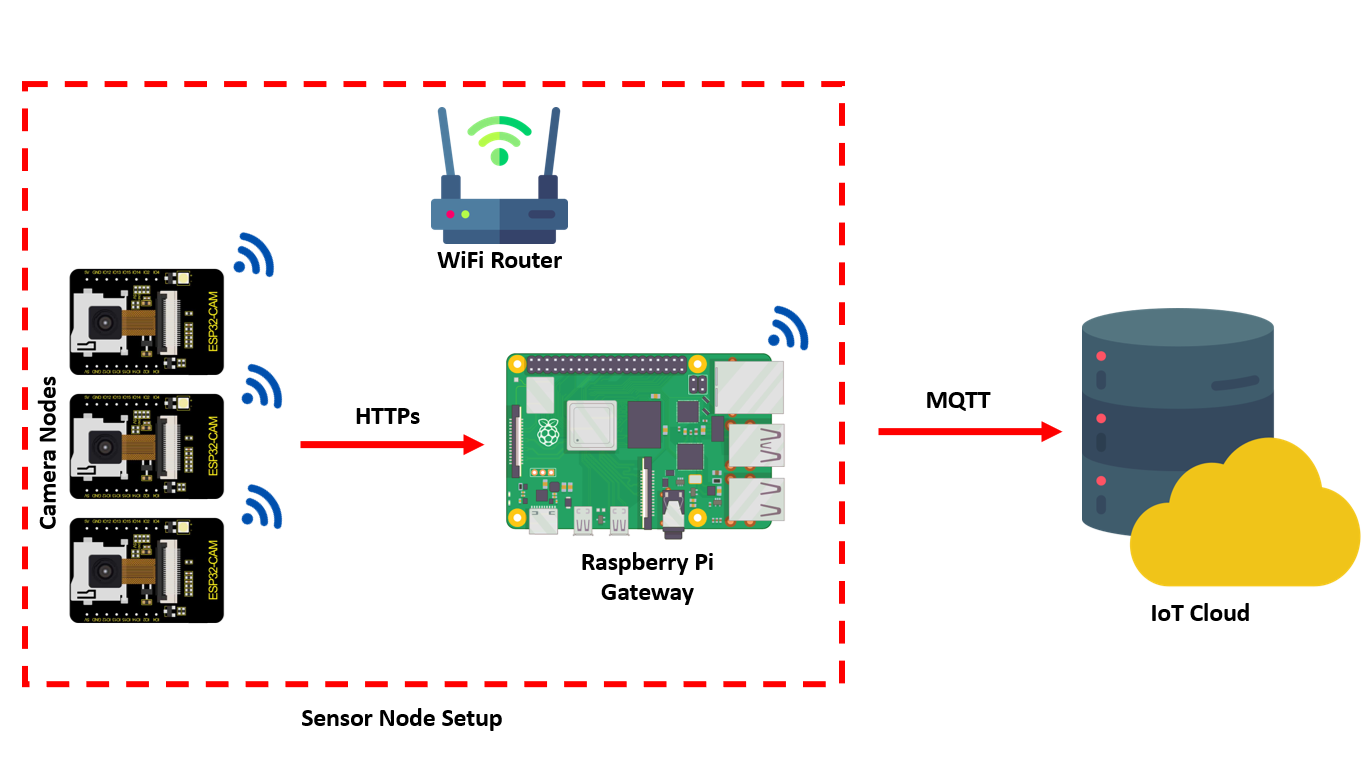
The pipeline defect detection system that we'll build in this article is made up of a number of low-cost, low-power, resource constraint camera nodes placed at various points along the pipeline to be examined.
The camera nodes are placed at a determined distance apart and positioned to provide a constant view of the pipeline.
The camera nodes can stream footage over Wi-Fi or other wireless technology so that it can be accessed from a remote location. The video stream is then fed into the computer vision algorithm, which helps in decision making. The inferencing results are uploaded to the IoT server to make data available for analysis and reporting.
In this project, the video stream captured by the ESP32 camera node is transmitted to a Python script running on the Raspberry Pi gateway over HTTP.
Once the video stream is received on the gateway, the stream is processed and analyzed using a machine learning model trained using RF-DETR and uploaded to Roboflow.
After the analysis is complete, the results are sent to an IoT server via the MQTT protocol. The Raspberry Pi gateway acts as an MQTT client and sends the results to the IoT server using the publish-subscribe messaging pattern. The use of HTTP and MQTT protocols for transmitting data in this project allows for efficient communication between devices in a distributed IoT network.
Choosing a Dataset
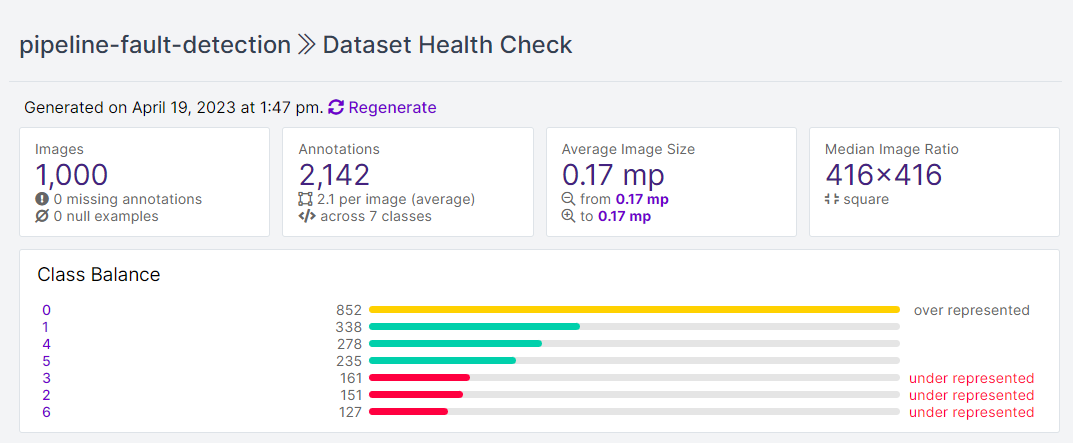
For this project, we'll use the "Storm drain" pipeline dataset hosted on Roboflow Universe. The dataset consists of 1,000 images and is labeled with the following classes:
- 0: Crack
- 1: Utility intrusion
- 2: Debris
- 3: Joint offset
- 4: Obstacle
- 5: Hole
- 6: Buckling
Roboflow provides a Health Check feature which can be used to get more insight about the dataset such as class balance, dimension insights, annotation heat map, and a histogram of object counts. This will help in understanding the dataset and assist in making choices regarding preprocessing and augmentation for the dataset.
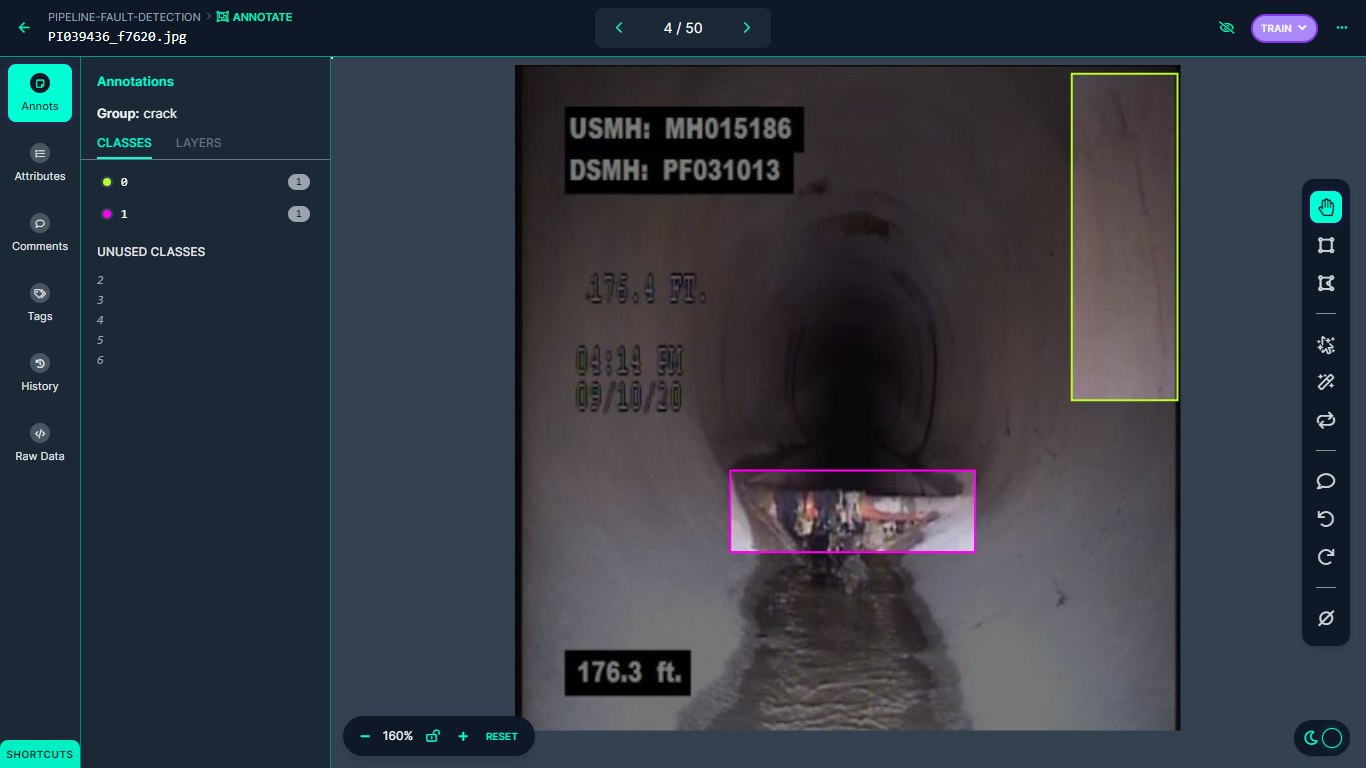
The following figure shows an example labelled image in our dataset:
Building the Automated Pipeline Inspection System
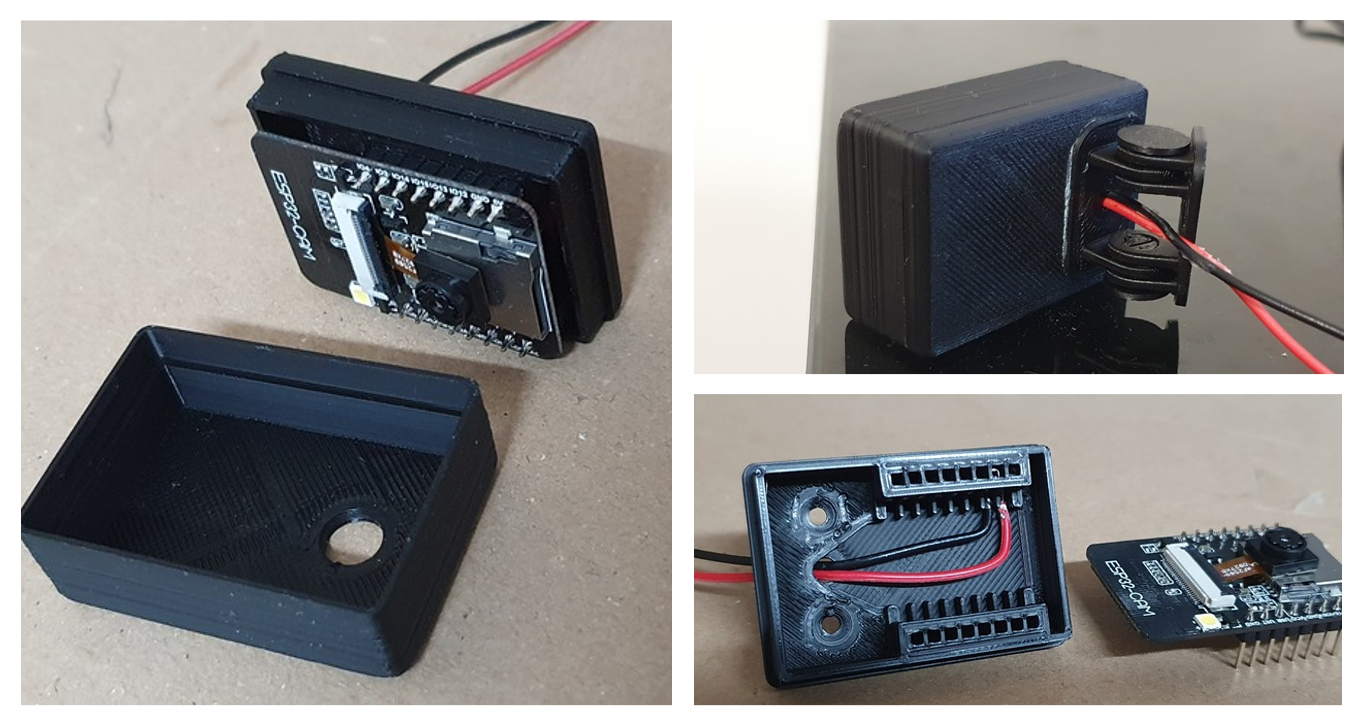
To collect images, we'll use the following pieces of technology:
- ESP32 Camera
- Li-Po 3.7 v battery
- Raspberry Pi 4
Together, this technology forms a "node" that could be part of a network of multiple sensors monitoring a pipeline.
With the hardware in place, we need to build a software component that can identify the aforementioned issues in a pipeline.
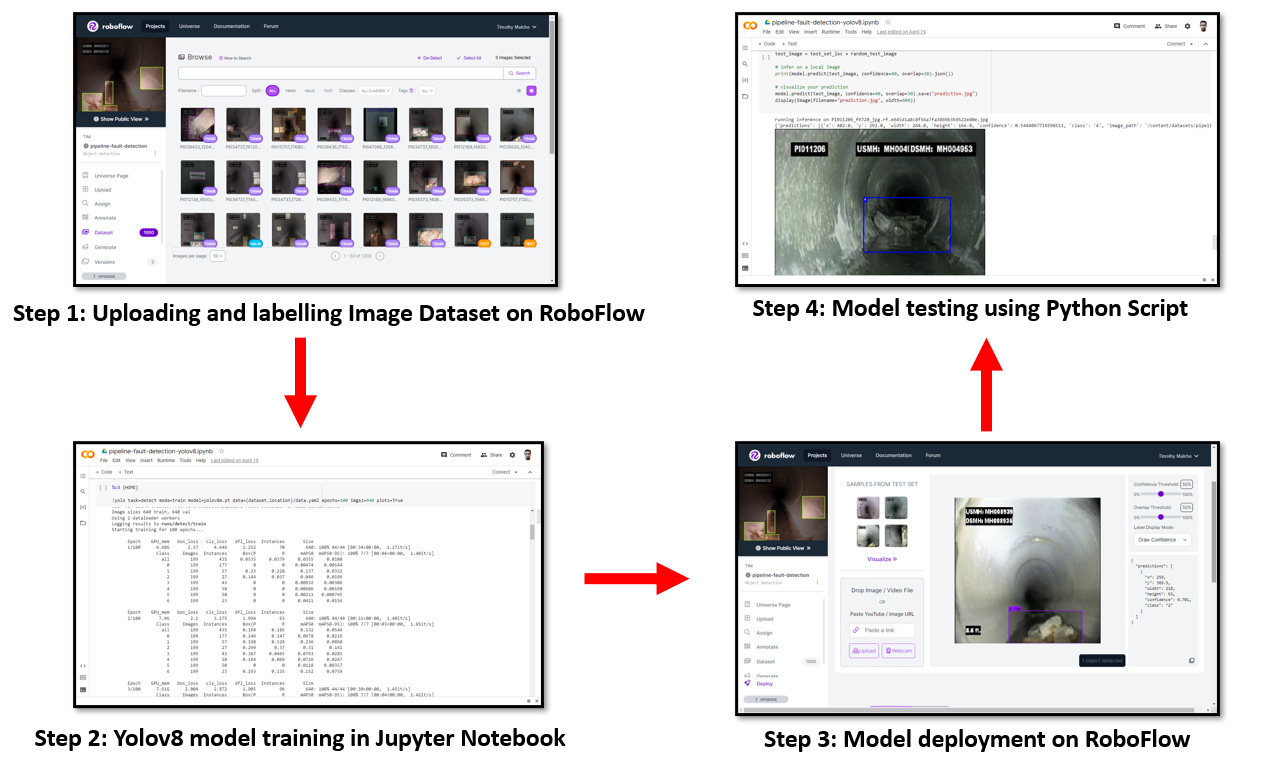
To build the software, we will go through the following steps:
- Upload and label the image dataset
- Train an RF-DETR model in a Jupyter Notebook
- Deploy the model to Roboflow
- Test the model with a Python script
Step 1: Upload and Label Images
An image dataset was collected and uploaded to Roboflow and then annotated for different classes of damage such as crack, utility intrusion, debris, joint offset, obstacle, hole, and buckling using Roboflow Annotate. This annotation process enables the computer vision model to understand and classify different types of damage accurately.
Step 2: Train an RF-DETR Model
After annotation, a Jupyter Notebook was used to train the RF-DETR object detection model. Once the RF-DETR model is trained, the trained weights are deployed back to Roboflow, making the trained model available for inferencing via Roboflow's hosted inference API.
Step 3: Deploy the Model to Roboflow
After deploying the model, a Python script is used to access the model via API, and live inferencing is done on new and unseen data. The script feeds new images to the RF-DETR model, which then identifies and localizes the different types of damages present in the image. The output of the inferencing process is used to generate a report, which can be used for analysis.
Roboflow offers a simple interface to upload the trained model and make it ready to use. The model can be deployed from python code to the Roboflow platform using the code given below:
project.version(dataset.version).deploy(model_type="yolov8", model_path=f"{HOME}/runs/detect/train/")Remember to supply the path to the trained weights for the model_path parameter that corresponds with the folder in which you have saved your weights.
Step 4: Test the Model
Once the model is deployed, it can be tested with the following Python code against the test set in the dataset or by feeding a real-time image.
#load model
model = project.version(dataset.version).model

#choose random test set image
import os, random

test_set_loc = dataset.location + "/test/images/"
random_test_image = random.choice(os.listdir(test_set_loc))
print("running inference on " + random_test_image)
test_image = test_set_loc + random_test_image

#infer on a local image
print(model.predict(test_image, confidence=40, overlap=30).json())

#visualize your prediction
model.predict(test_image, confidence=40, overlap=30).save("prediction.jpg")display(Image(filename="prediction.jpg", width=600))
In the code above, inference is done using a pre-trained model deployed on Roboflow. The model was loaded using project.version(dataset.version).model.
First, a random image from the test set is chosen by selecting a file randomly from the test_set_loc directory. The path of the selected image is then printed to the console.
Next, the model.predict function is called with the path of the selected image as input. The confidence and overlap parameters are set to 40 and 30, respectively. These parameters control the threshold for accepting predicted bounding boxes and the degree of overlap allowed between bounding boxes, respectively. The json() method is called on the returned prediction object so we can read the predictions as structured data.
The model.predict function is called again on the same image, this time with the save method to save the predicted bounding boxes on the image as a new file named prediction.jpg. Finally, the saved image is displayed to the console.
Here is a code example of how to perform object detection on a single image using a pre-trained model in Roboflow:
Running inference on PI011206_f9720_jpg.rf.e645d1a8c8f56a7fa3869b3bd522e80e.jpg, the code will generate following output:
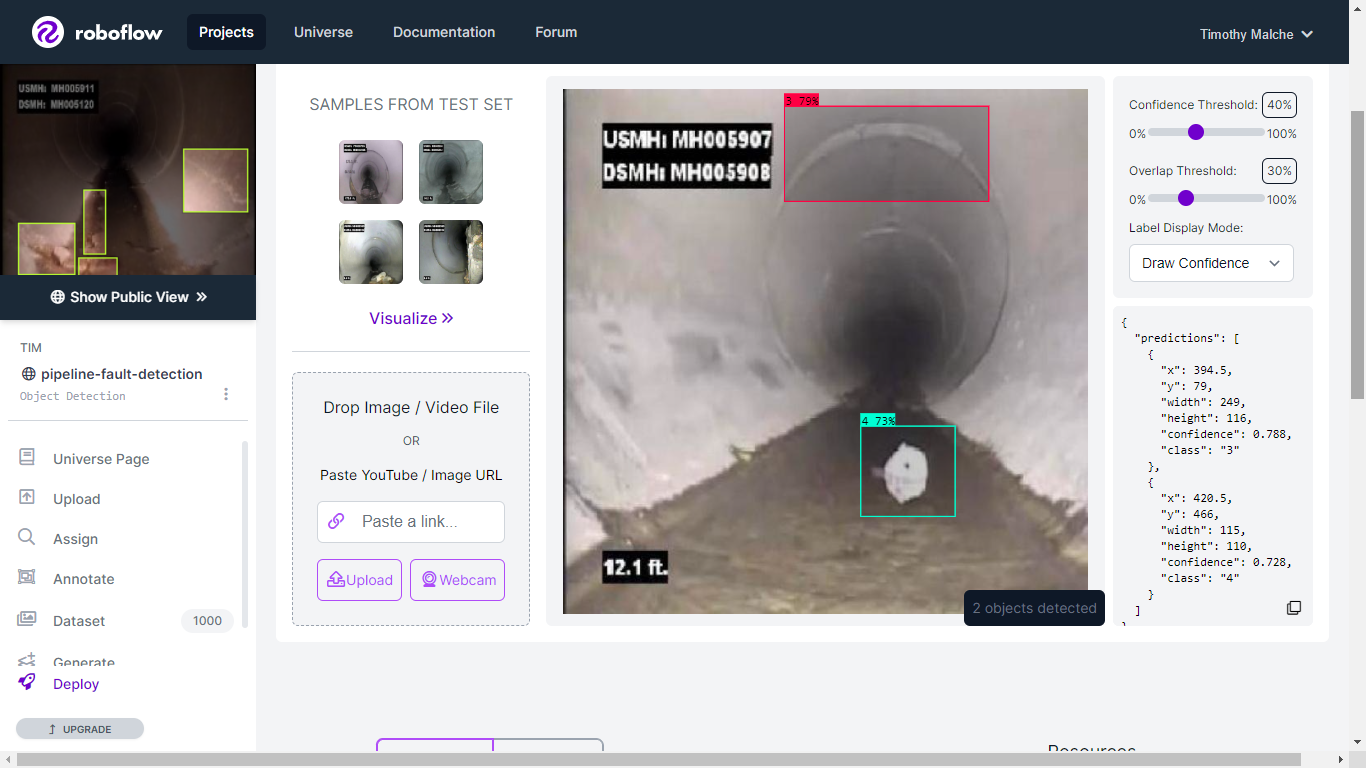
{'predictions': [{'x': 402.0, 'y': 292.0, 'width': 264.0, 'height': 166.0, 'confidence': 0.5444067716598511, 'class': '4', 'image_path': '/content/datasets/pipeline-fault-detection-1/test/images/PI011206_f9720_jpg.rf.e645d1a8c8f56a7fa3869b3bd522e80e.jpg', 'prediction_type': 'ObjectDetectionModel'}], 'image': {'width': '640', 'height': '640'}}Since the model is uploaded to a Roboflow project space, (pipeline-fault-detection), it can be used for inferencing on the Roboflow Deploy page. The following image shows inferencing using the uploaded RF-DETR model on Roboflow.
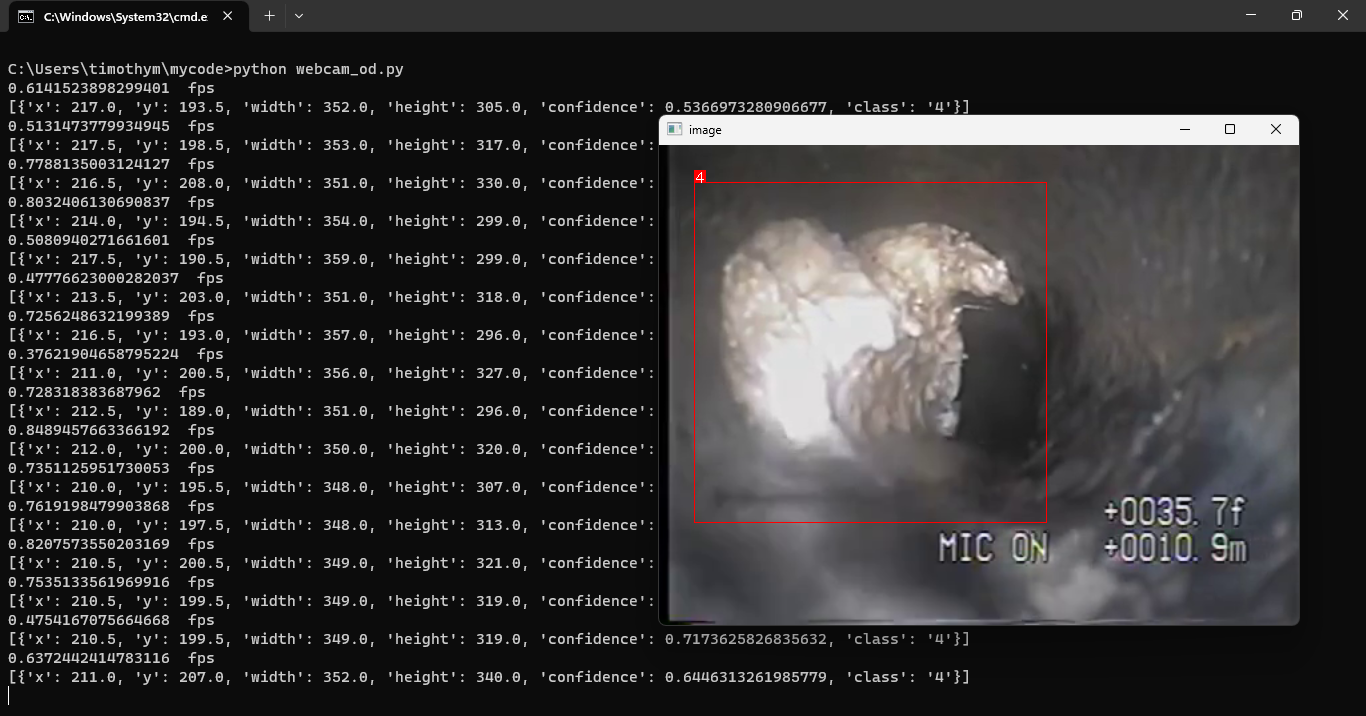
Finally, the main application can be built using the deployed model from Roboflow in a Python script. A detailed tutorial is available here. The following is the output from the python script. The model has detected class 4 (which maps to Obstacle according to the ontology we outlined earlier in the post) in the live video stream.
Conclusion
By leveraging computer vision, pipeline fault detection can be automated, allowing businesses to monitor pipelines for issues in real time without manual inspection. The RF-DETR object detection model trained on images annotated using Roboflow can accurately detect different types of damage, such as cracks, utility intrusions, debris, joint offset, obstacles, holes, and buckling.
Cite this Post
Use the following entry to cite this post in your research:
Timothy M. (May 18, 2023). Automated Computer Vision Inspection of Physical Pipelines. Roboflow Blog: https://blog.roboflow.com/pipeline-inspection-computer-vision/