
A Quality Management System (QMS) is the set of processes a manufacturer uses to consistently deliver products that meet standards, covering inspection, defect tracking, corrective action, and continuous improvement. According to the American Society for Quality, manufacturers lost 15-20% of total sales revenue to the cost of poor quality, scrap, rework, warranty claims, and recalls.
In this tutorial, you’ll build a Visual QMS loop in Roboflow: detect steel surface defects with a trained computer vision model, alert the team through Slack, and upload flagged images back to the dataset for continuous improvement.
How to Build a Visual Quality Management System with Roboflow
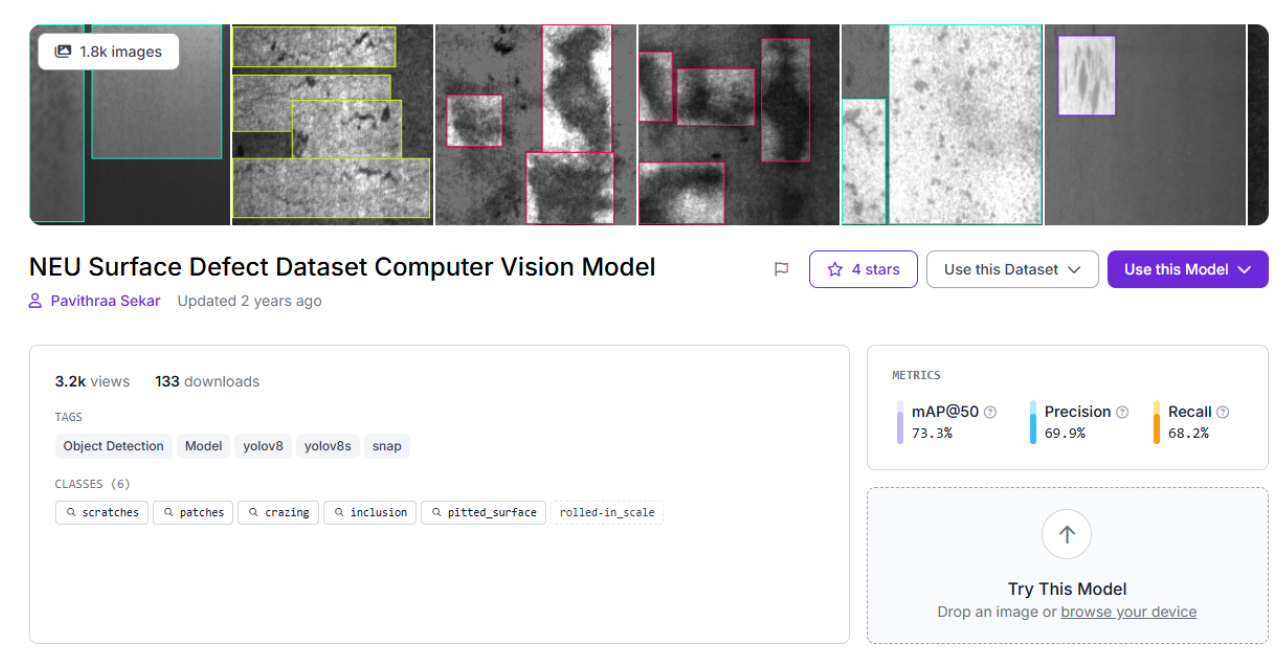
For this tutorial, we’ll use the NEU Surface Defect Dataset, an object detection dataset on Roboflow Universe with 1,799 images across 6 defect classes: crazing, inclusion, patches, pitted_surface, rolled-in_scale, and scratches. It's already been validated by the community (3.2k views, 133 downloads) and it covers the kinds of real-world variation that matter for a first model: different defect types, varying surface textures, and subtle visual differences between classes.
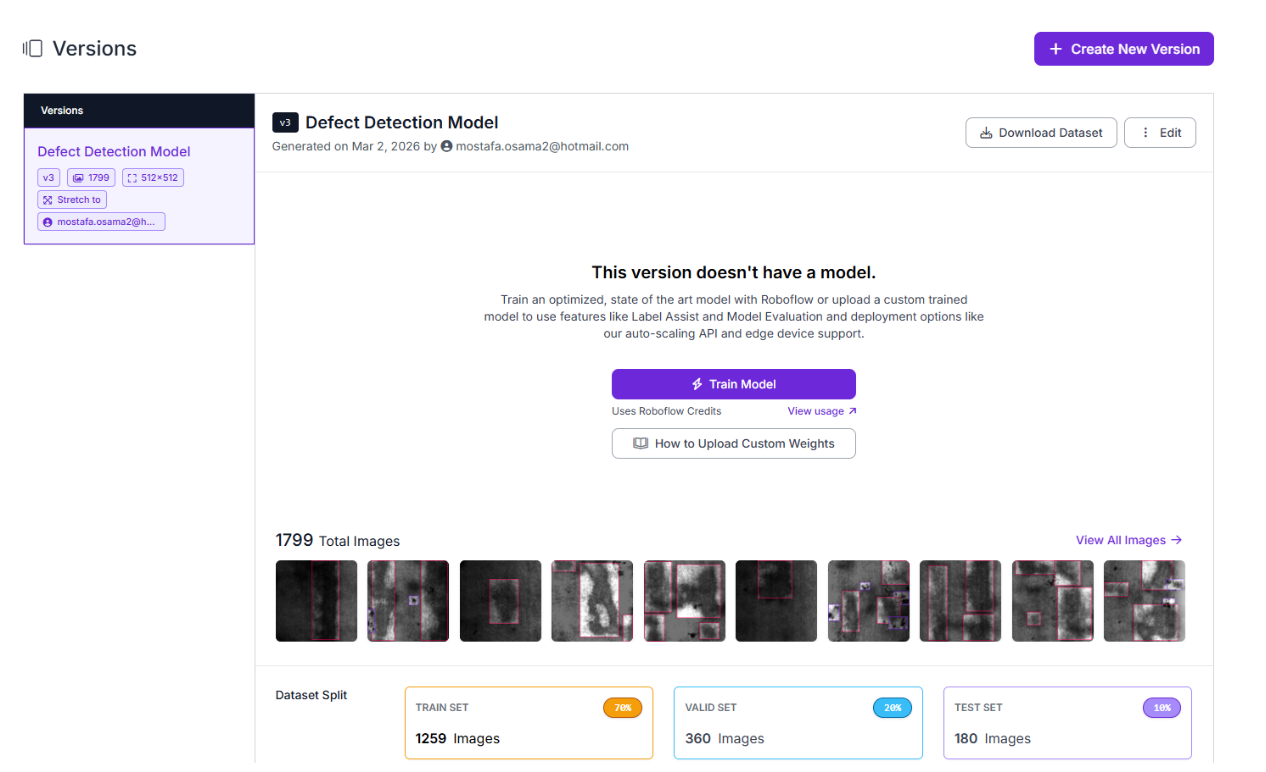
Start by forking the dataset into your workspace, then create a new version with no preprocessing or augmentation to establish a clean baseline.
Train a Defect Detection Model in Roboflow
Training configuration:
- Task: Object detection
- Model Size: Small
- Architecture: RF-DETR
- Initialization: Train from pretrained weights
Go to your dataset version and click Custom Train. Select the configuration above and launch the job. For 1,799 images, expect training to take several hours, significantly longer than for smaller datasets, but no manual intervention is needed.
In a QMS context, prioritize high recall to catch real defects even if it means some false positives. A surface defect that escapes the line is far more costly than a false alert, which a quality engineer can quickly dismiss.

Once training completes, you'll have a defect-detection model ready to drop into Roboflow Workflows, where predictions can trigger alerts and feed data back into the training pipeline.
Build a QMS Workflow That Routes Defects to Slack and Logs Them for Retraining
This is where the project stops being "a model that detects defects" and becomes a quality management system. Roboflow Workflows connects inference to action, detections trigger alerts, and feed back into improving the model.
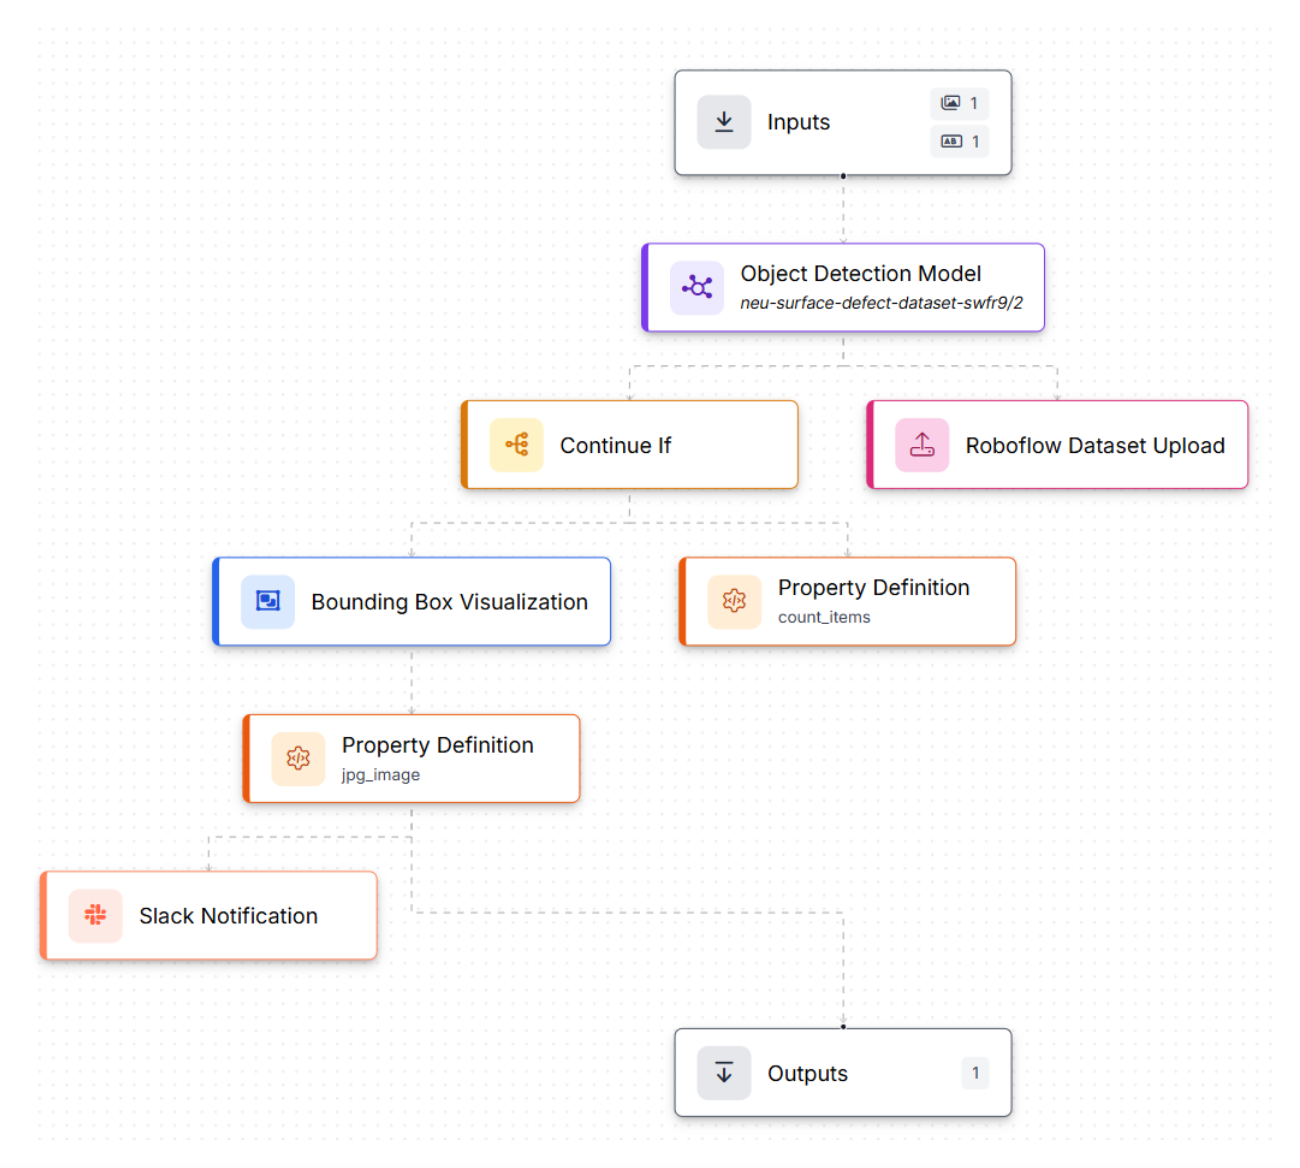
The workflow: production image → run inference → if defects detected → alert the team + log for retraining. Here's the workflow we'll build.
Step 1: Generate the Workflow Scaffold
Go to your trained model and click Try Workflows → Build My Own. Roboflow creates a basic workflow: Inputs → Object Detection Model → Outputs. From there, you extend it into a QMS pipeline.
Step 2: Inputs (Image + Line Context)
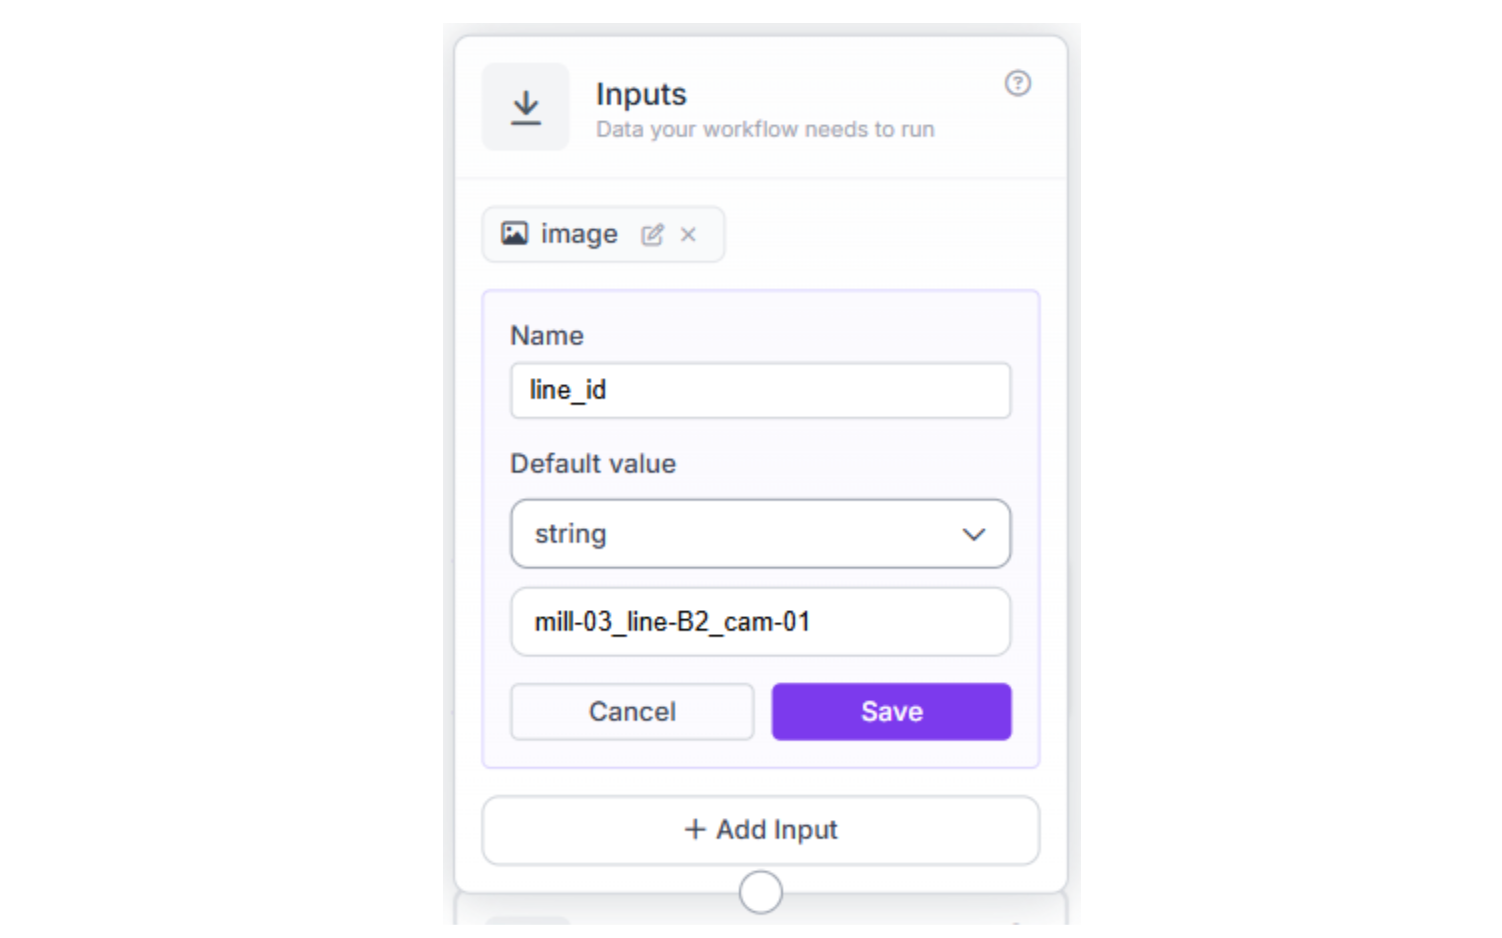
Set up two inputs: a production surface image and a line_id parameter so the alert maps to a specific production line. The line_id follows a naming convention that maps to your facility layout, for example, mill-03_line-B2_cam-01.
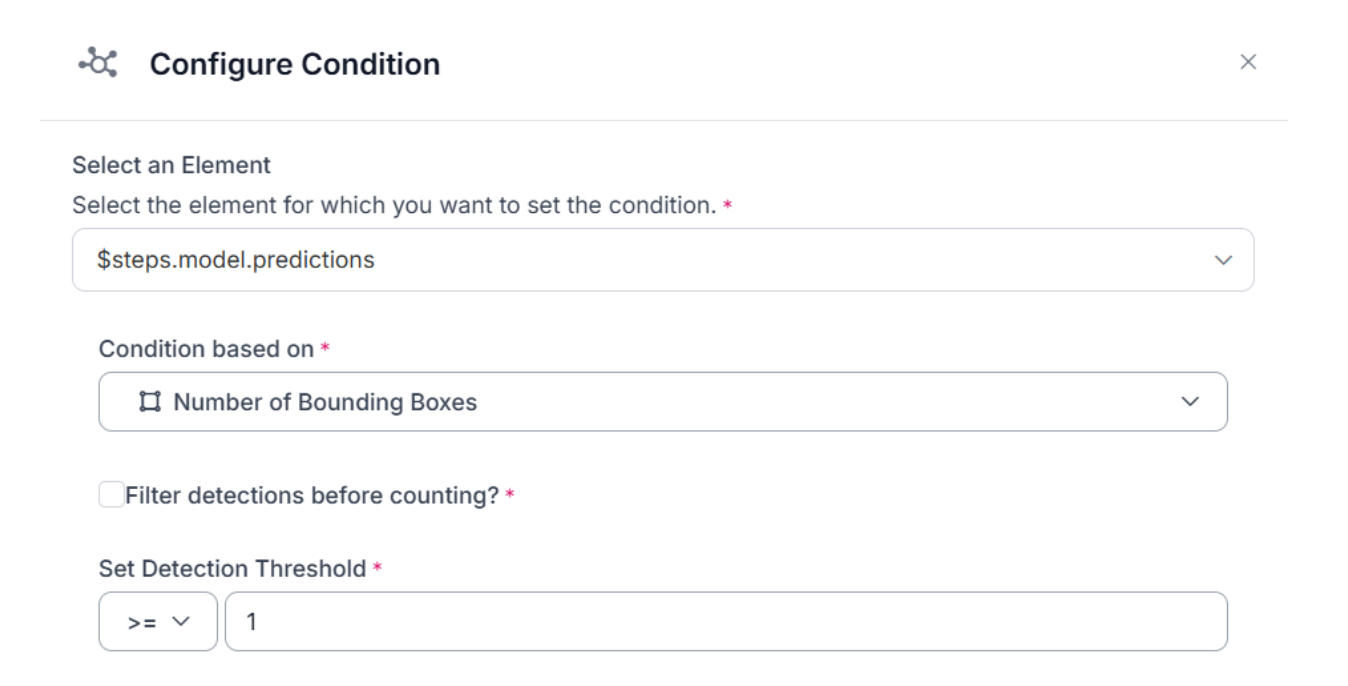
Step 3: Only Continue If Defects Were Detected
Add a Continue If block that checks the number of bounding boxes returned by the model and continues only if it's ≥ 1.
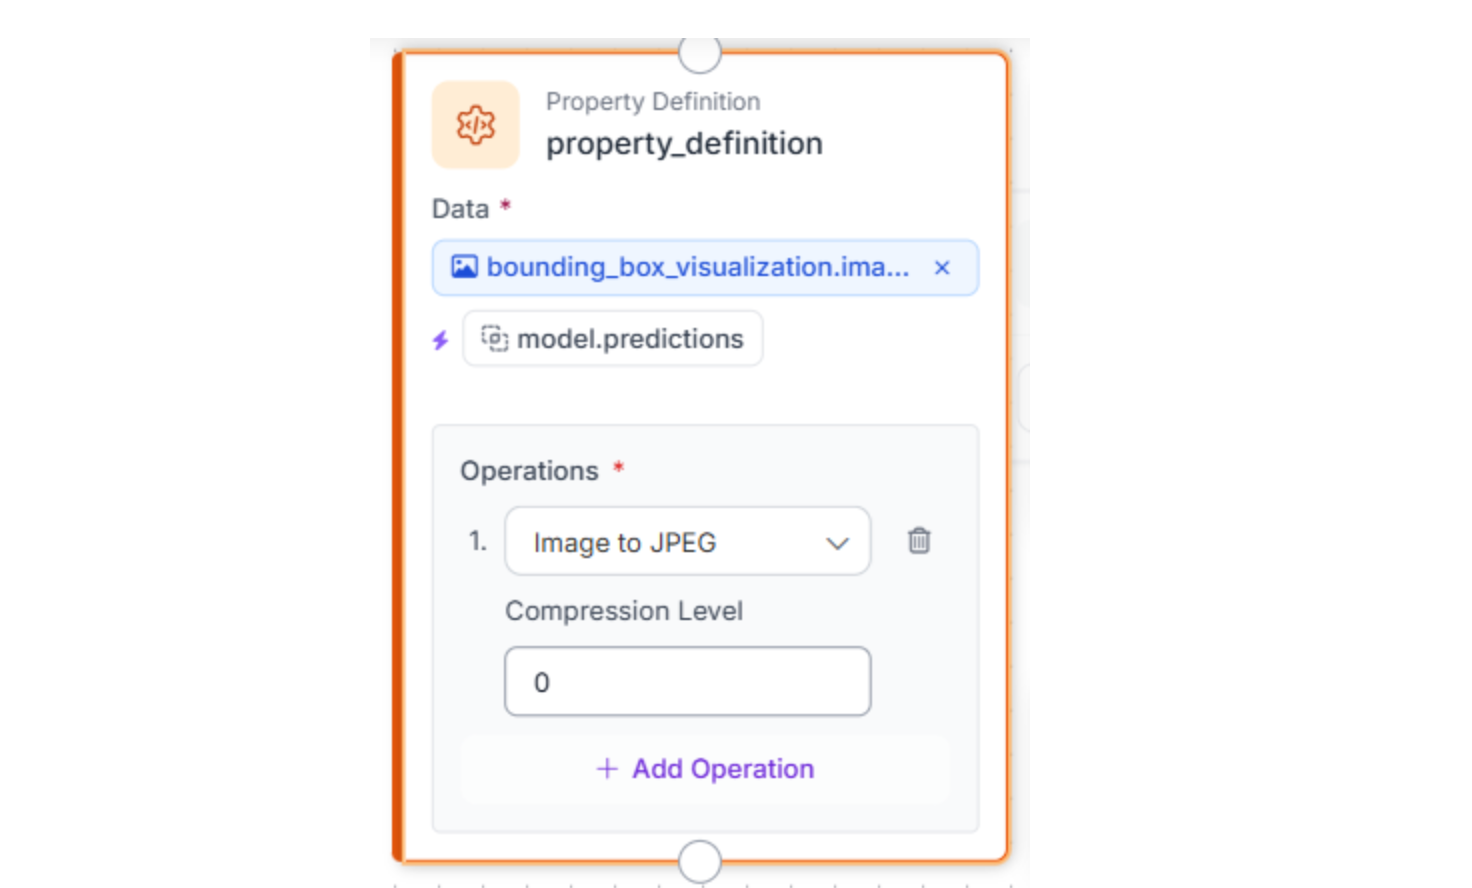
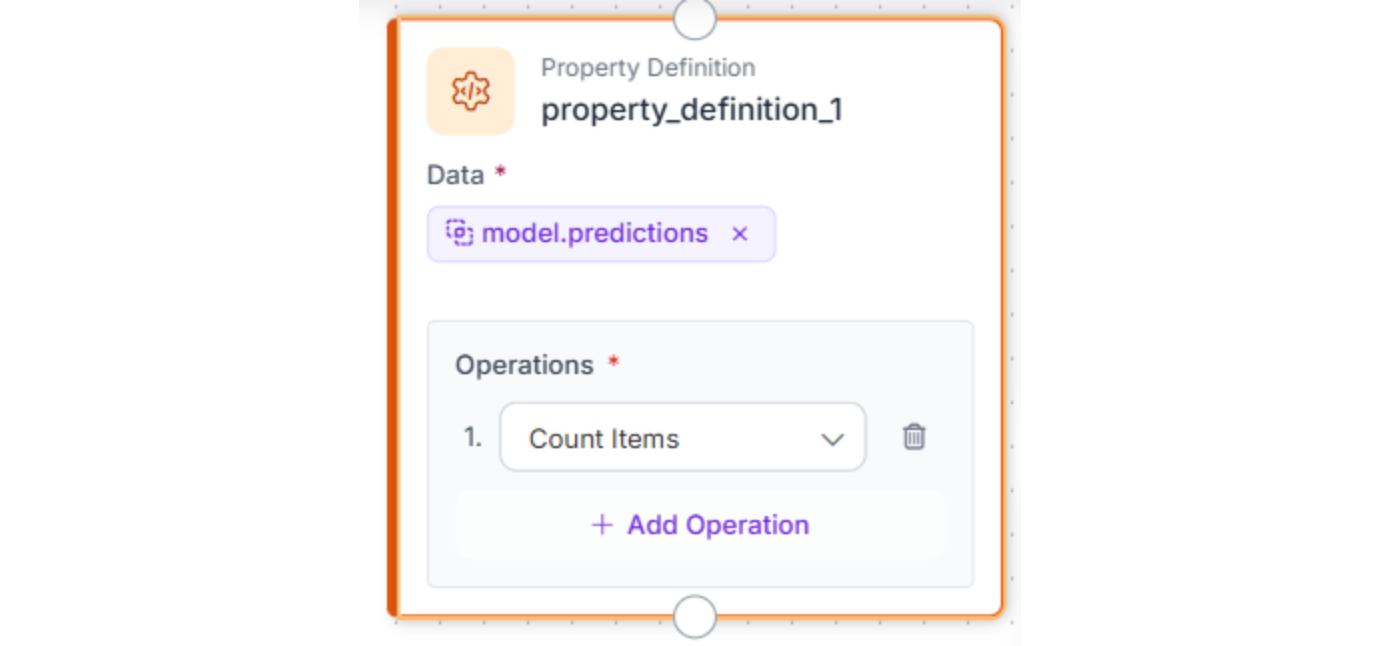
Step 4: Prepare Outputs for Slack (Annotated Image + Defect Count)
Create two artifacts: a visualized image (bounding boxes drawn on the surface image), converted to JPEG for Slack attachment, and a numeric defect_count calculated by counting the model's prediction items.
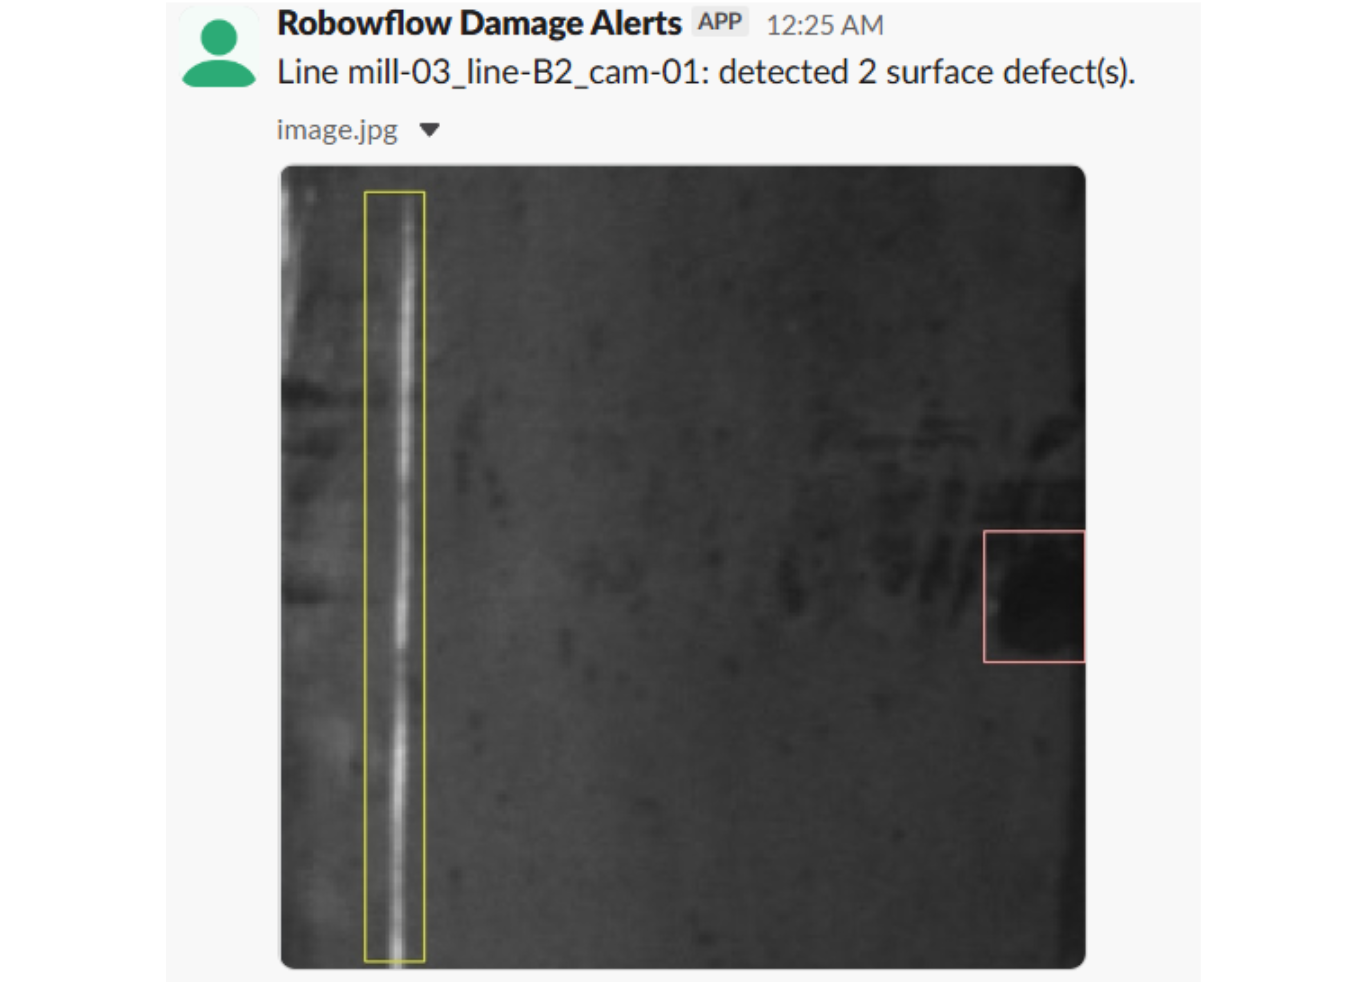
Step 5: Send the Slack Alert
The Slack Notification block sends a message with line_id, defect_count, and the annotated image attached. (For Slack token + channel setup, reference Roboflow's Slack Notification guide.)
Message:
Line {{ $parameters.line_id }}: detected {{ $parameters.defect_count }} surface defect(s).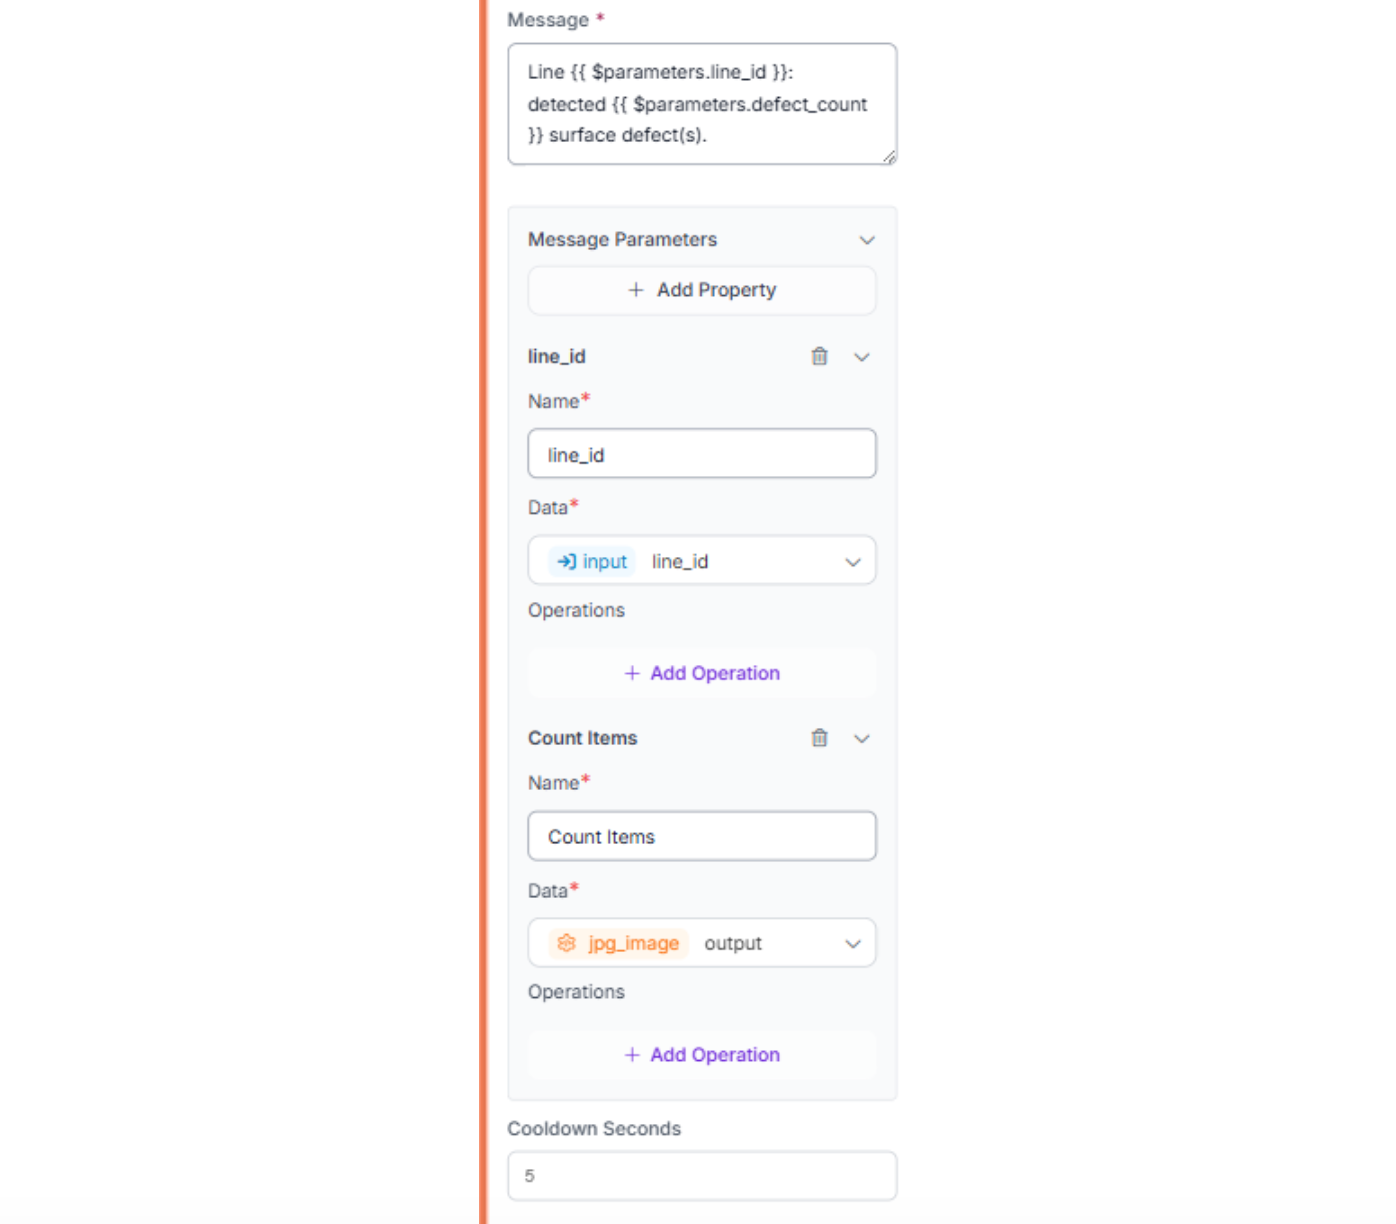
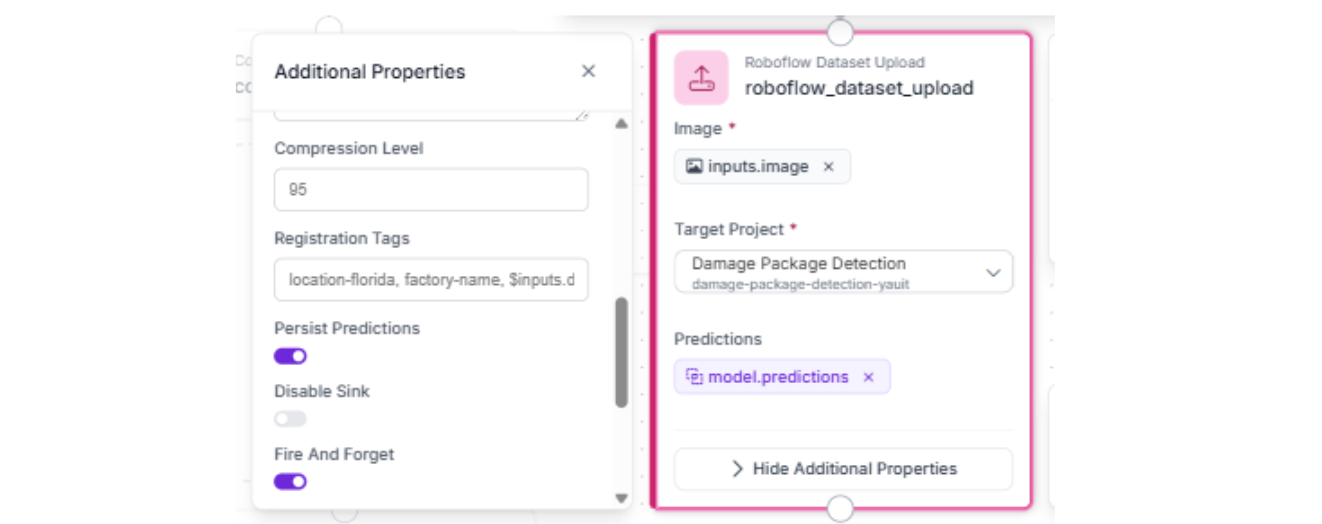
Step 6: Upload Flagged Images for Retraining
Add a Roboflow Dataset Upload block that uploads every flagged image, with model predictions as pre-annotations, back to your dataset. Set a data_percentage to control sampling (100% for testing, 10–30% in production) and a labeling_batch_prefix, such as production-defects, to organize incoming data.
Step 7: Test the Workflow
Run a quick sanity check:
- Test with a sample surface image + line_id
- Confirm you get one Slack message with an annotated image + defect_count + line_id
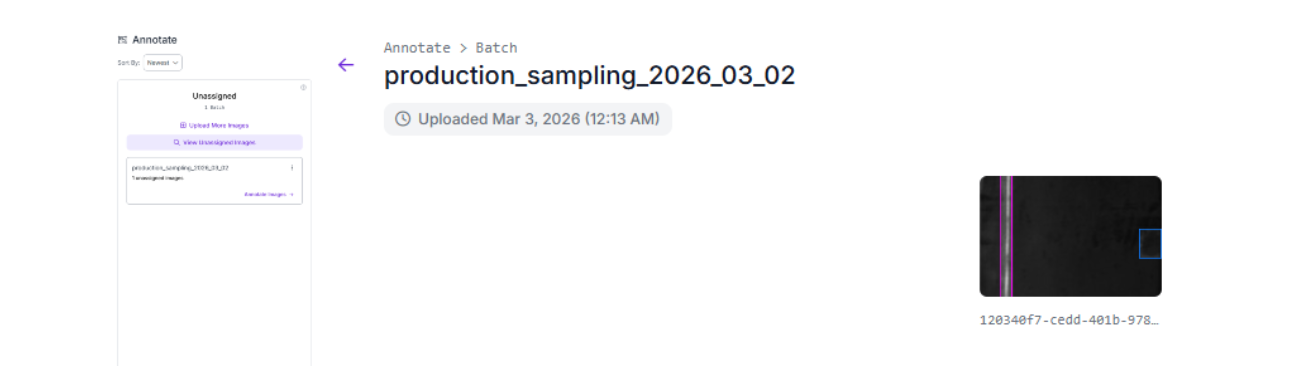
- Check your dataset to confirm the flagged image was uploaded with pre-annotations
Annotate tab showing the production-defects batch with the uploaded image and pre-annotations
From Tutorial to Production: Scaling a Visual Quality Management System
The workflow you built is the core QMS loop: detect, alert, and capture data for retraining. In production, the alerting system usually breaks before the model does. Here's how teams harden each layer.
Reduce alert noise without losing real signals.
A steel mill camera running at 1 fps generates 3,600 images per hour. Without guardrails, one persistent roller scratch triggers an alert every second. Three controls fix this:
- Confidence threshold (0.6–0.7): Filters out detections from surface texture, oil residue, or lighting reflections.
- Cooldown (cooldown_seconds: 600–900): Suppresses repeat alerts per line_id for 10–15 minutes, long enough to stop 900 alerts per shift from the same scratch, short enough that new defect types (sudden pitting from a bad steel batch) surface within minutes.
- Digest grouping: One summary instead of 12 messages, "Line B2: 12 defects in 15 min (8 scratches, 3 inclusions, 1 crazing)" with the worst-scoring image attached.
Use the Roboflow Dashboard as your quality command center.
Model Monitoring tracks inference volume, confidence distributions, and class breakdowns over time. Tag each inference with custom metadata, line number, shift, steel grade, and operator ID, and the dashboard becomes a defect-trending tool.
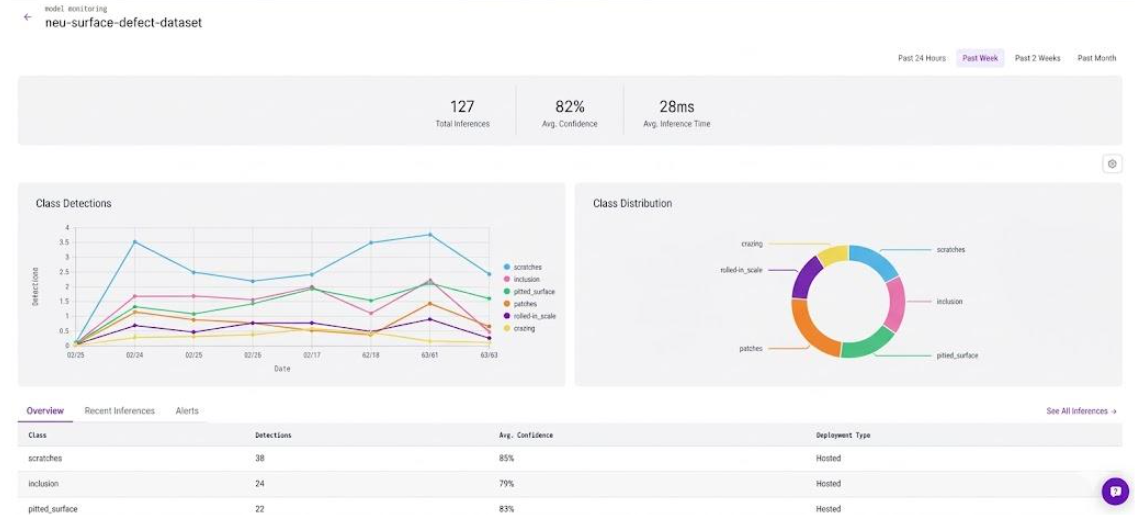
For example, if scratch detection spikes from 2% to 14% on mill-03_line-B2 only during night shifts, that's not a model problem; it's a mechanical one (worn roller, misaligned guide) or an environmental one (reduced lighting). That signal triggers a root cause investigation, and the same data satisfies ISO 9001 auditors expecting evidence of systematic monitoring and continuous improvement.
Scale from one line to many.
Replicate the workflow per line, with each line routed to a dedicated Slack channel (#quality-mill-03, #quality-mill-04). As you add lines, different cameras and lighting conditions will reveal edge cases; a warm-tinted camera might cause the model to underdetect inclusion defects that appear darker than in the training data. The Dataset Upload block catches these automatically: flagged images flow back, you review and correct labels, retrain, and redeploy. After two or three iterations, the model covers the new line's conditions. This data drift feedback loop is what keeps model accuracy from degrading over time in production.
Go beyond Slack when traceability matters.
When a customer returns defective steel, and your team needs to prove the defect was caught, Slack won't hold up. Route workflow outputs via the Webhook Sink block to Jira. The workflow creates a ticket ("Review surface defect, Line B2, batch #4471") with the annotated image, defect count, class breakdown, and timestamp. The engineer resolves it after inspection, providing you with a documented chain of events from detection to resolution. For teams feeding data into MES/ERP systems, the webhook bridges visual inspection and formal quality records.
Visual Quality Management System Conclusion
A visual QMS is valuable because the cost of missed defects is measurable: scrap, rework, recalls, and broken trust. But the real win isn't drawing boxes on an image, it's closing the loop between detection, action, and improvement.
In this tutorial, you built that full loop: a defect detection model deployed in Roboflow Workflows that turns every production image into an operational signal, Slack receives an alert with the annotated image, line ID, and defect count, while flagged images feed back into the dataset for retraining. Detect, alert, log, improve.
Discuss your manufacturing use cases with an AI expert.
Further Reading
Below are a few related topics you might be interested in:
Cite this Post
Use the following entry to cite this post in your research:
Contributing Writer. (Mar 4, 2026). Visual Quality Management with Roboflow. Roboflow Blog: https://blog.roboflow.com/visual-quality-management-system/