
This tutorial builds an automated player positioning system for pickleball that combines RF-DETR for detection with Claude Sonnet 4.5 for tactical reasoning inside a Roboflow Workflow. Upload a match photo, and the pipeline returns an annotated image alongside coaching-grade commentary about court coverage and player positioning derived from a single frame. The detect-then-reason pattern is what makes this work: a specialized detector localizes players and the ball, then the VLM interprets what that positioning means tactically.
Pickleball has grown 311% in participation since 2021, making it America's fastest-growing sport four years running. Yet most players still improve the same way they always have: gut feeling, a friend's advice, and rewatching blurry phone footage after a loss.
This tutorial closes that gap. We'll build an automated player positioning analysis system using RF-DETR for detection and Claude Sonnet 4.5 for tactical reasoning. Upload a match photo, and the workflow returns an annotated image with AI-generated commentary describing court positioning and coverage, coaching-grade insight from a single frame.
How to Automate Pickleball Performance Analytics
Step 1: Prepare the Dataset
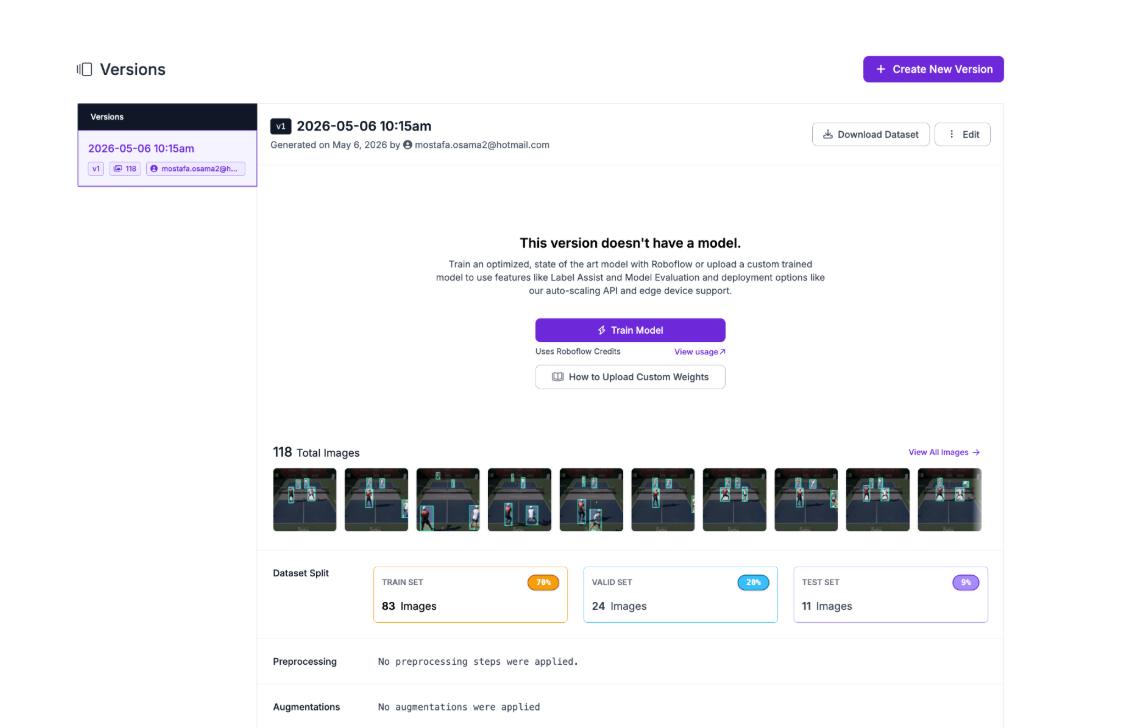
We'll use the Pickleball dataset from Roboflow Universe, a publicly available dataset containing 118 images across four classes: Player, person, Paddle, and Pickleball. The images are extracted from match footage, capturing real court conditions with the detection targets we need: players and the ball, already annotated and ready for training.
The dataset is compact and focused, which makes it ideal for this tutorial. We don't need thousands of images to train a reliable detector for a controlled court environment. Four clean classes covering the key objects on a pickleball court are enough to build a strong foundation.
To get started, fork the dataset into your own Roboflow workspace. Once forked, navigate to the dataset in your workspace and generate a new version. Configure a 70/20/10 train/validation/test split to give the model enough training data while preserving a held-out test set for evaluation.
Step 2: Train the RF-DETR Model
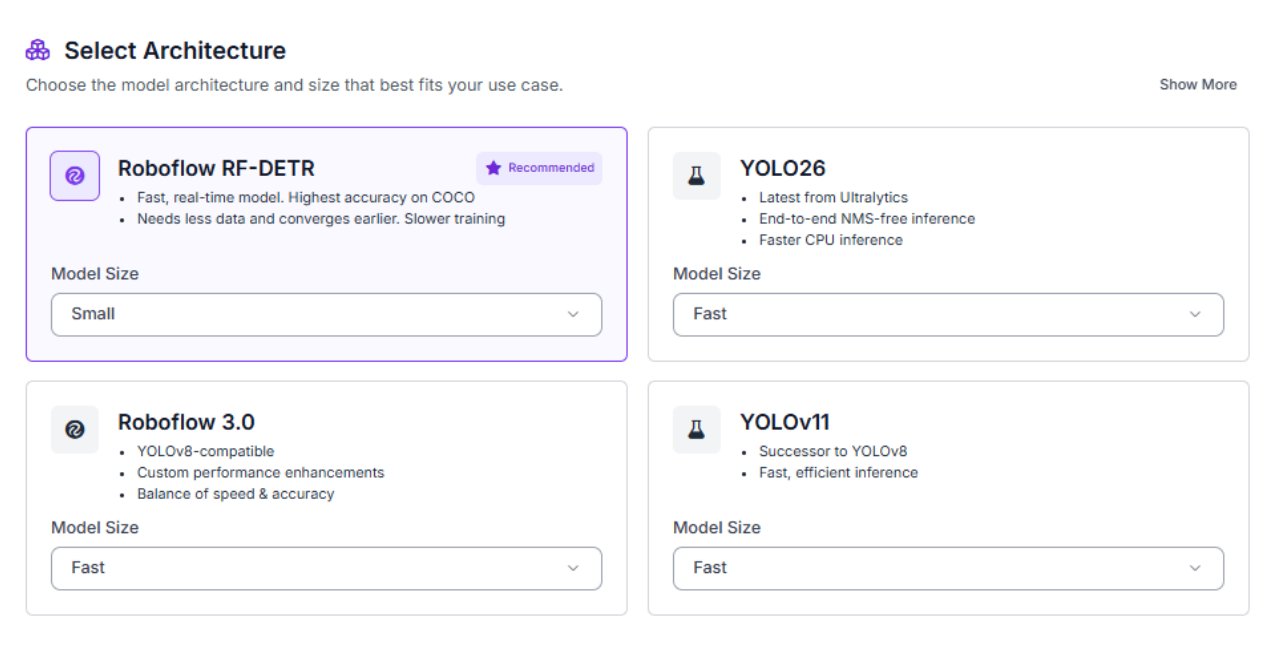
With your dataset version ready, click "Train Model" to begin configuring your training job. Select RF-DETR as the model architecture, Roboflow's state-of-the-art detection model that combines transformer-based accuracy with inference speeds fast enough for real-time applications.
For model size, select Small. Larger variants offer marginal accuracy gains but come with significantly higher compute costs and longer training times. For a focused court environment like pickleball, Small strikes the right balance between performance and efficiency.
Once training completes, review your model's performance metrics before moving to deployment.
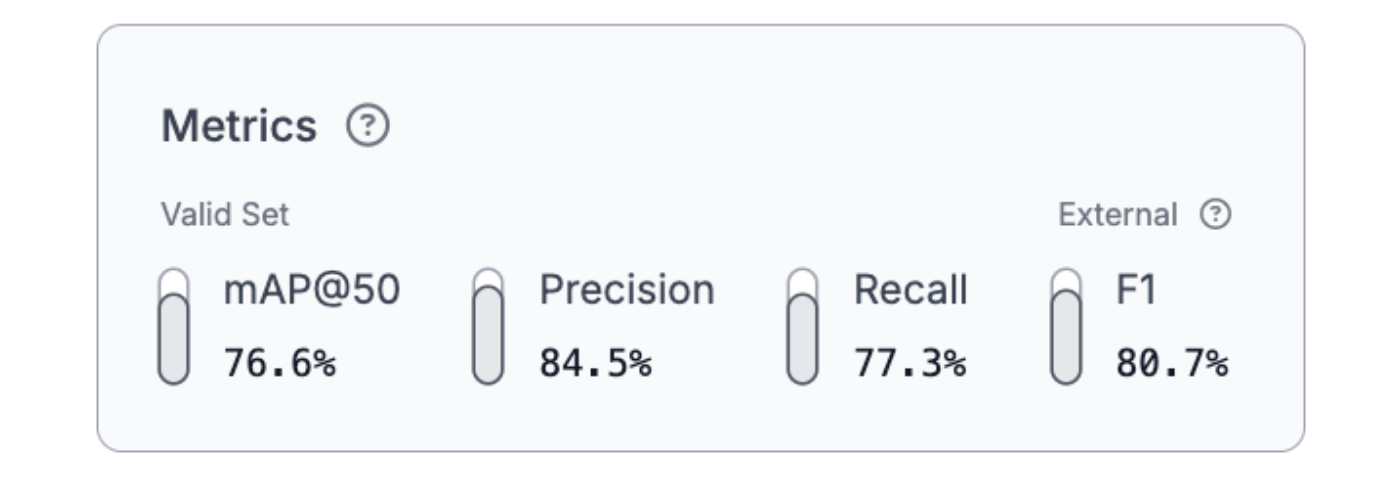
The results are strong across all four classes. A 76.6% mAP@50 demonstrates reliable detection performance on both players and the ball, with 84.5% precision and 77.3% recall producing a balanced 80.7% F1 score. The high precision means the model rarely flags false detections, while the solid recall ensures players and the ball are consistently located across frames. For downstream tactical analysis, this reliability matters. Claude Sonnet 4.5 can only reason accurately about positioning when the detections feeding it are trustworthy.
Step 3: Deploy to Workflows
Roboflow Workflows provides a visual interface for building computer vision pipelines that connect detection, visualization, and language understanding. Our final workflow connects six blocks: the RF-DETR model detects players and the ball, a bounding box visualization block annotates the frame, Claude Sonnet 4.5 reads the annotated image and generates tactical commentary, a custom Python block word-wraps that commentary, and a text display block burns it onto the final image.
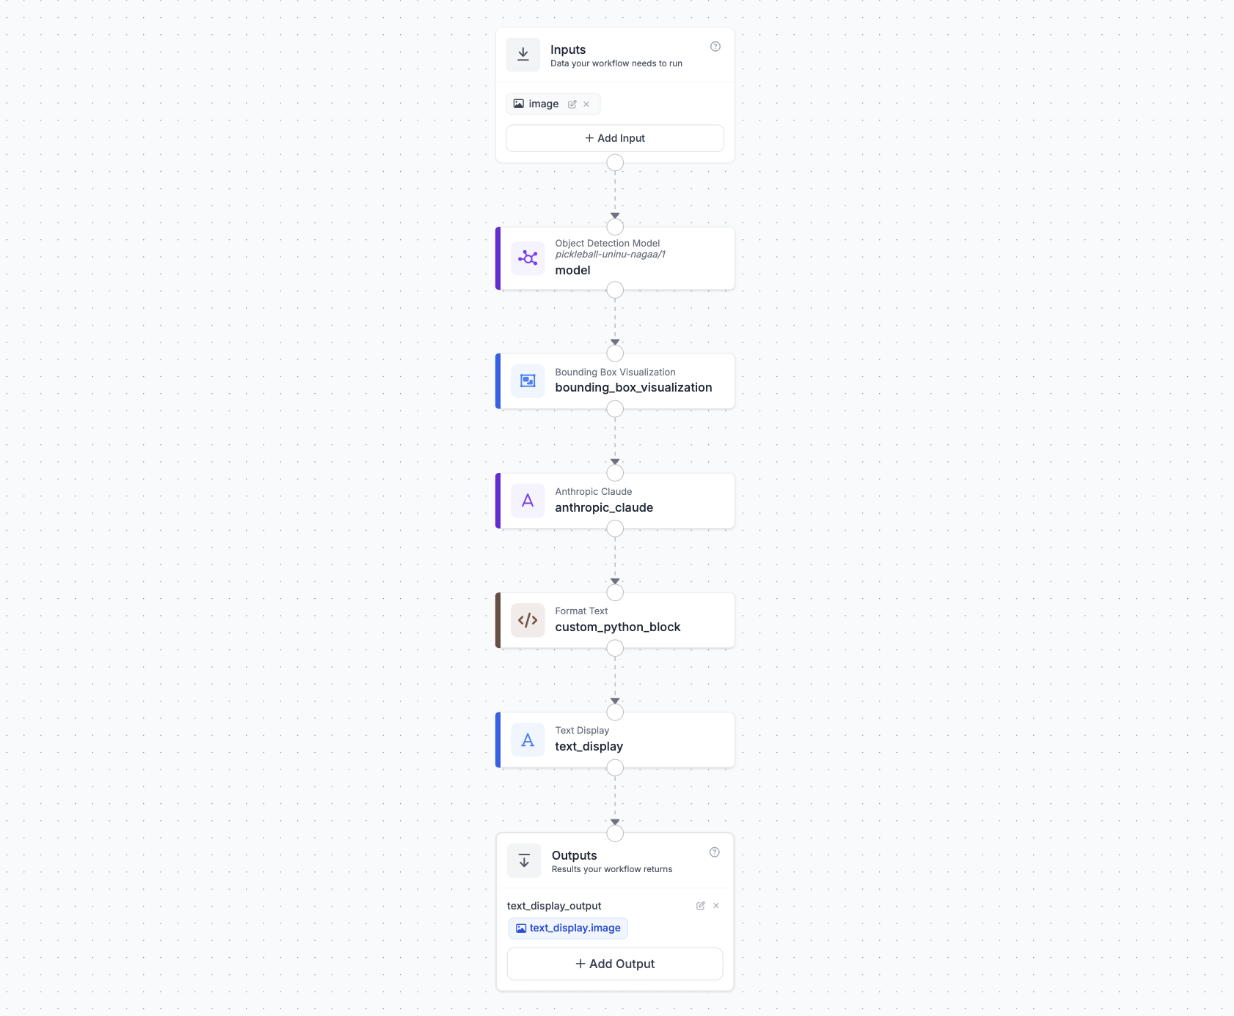
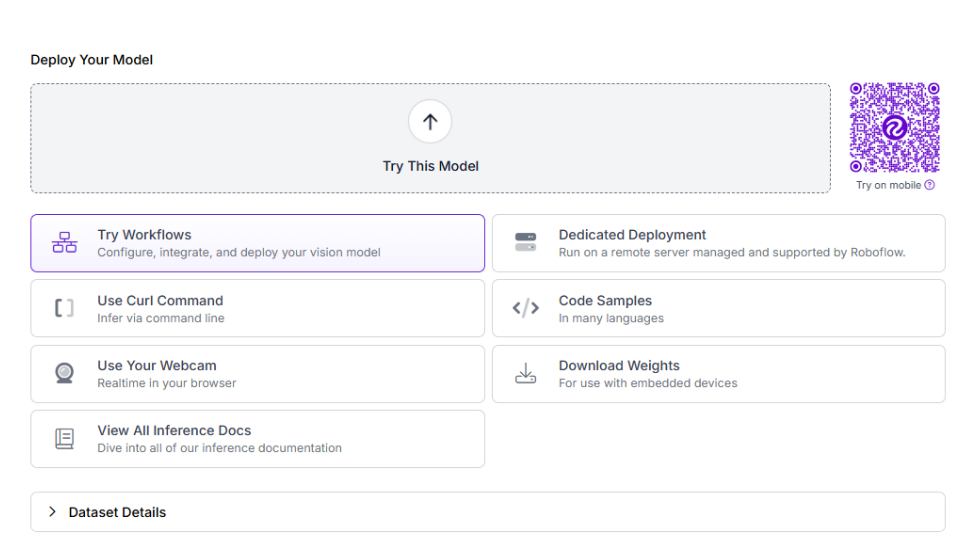
To create this workflow, click "Try Workflows" when viewing your trained model's deployment options.
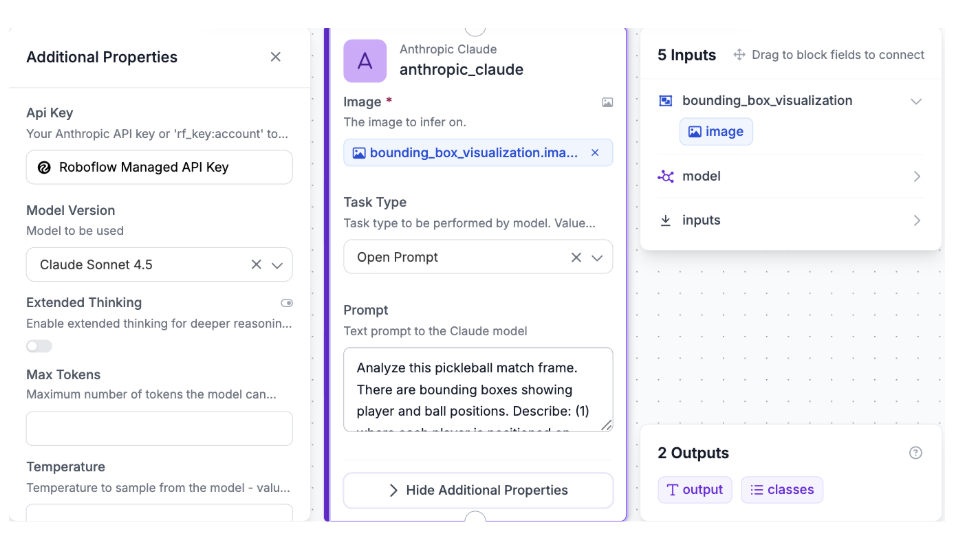
Configure the Claude VLM Block
Add a Claude block and connect it to the Bounding Box Visualization output. Configure:
- Model: Claude Sonnet 4.5
- Images: Connect to the annotated image from the Bounding Box Visualization block
- Prompt:
Analyze this pickleball match frame. There are bounding boxes showing player and ball positions. Describe: (1) where each player is positioned on court (kitchen line, transition zone, or baseline), (2) any notable tactical observations based on player spacing, court coverage, and net presence. Keep it concise, 2-3 sentences max.
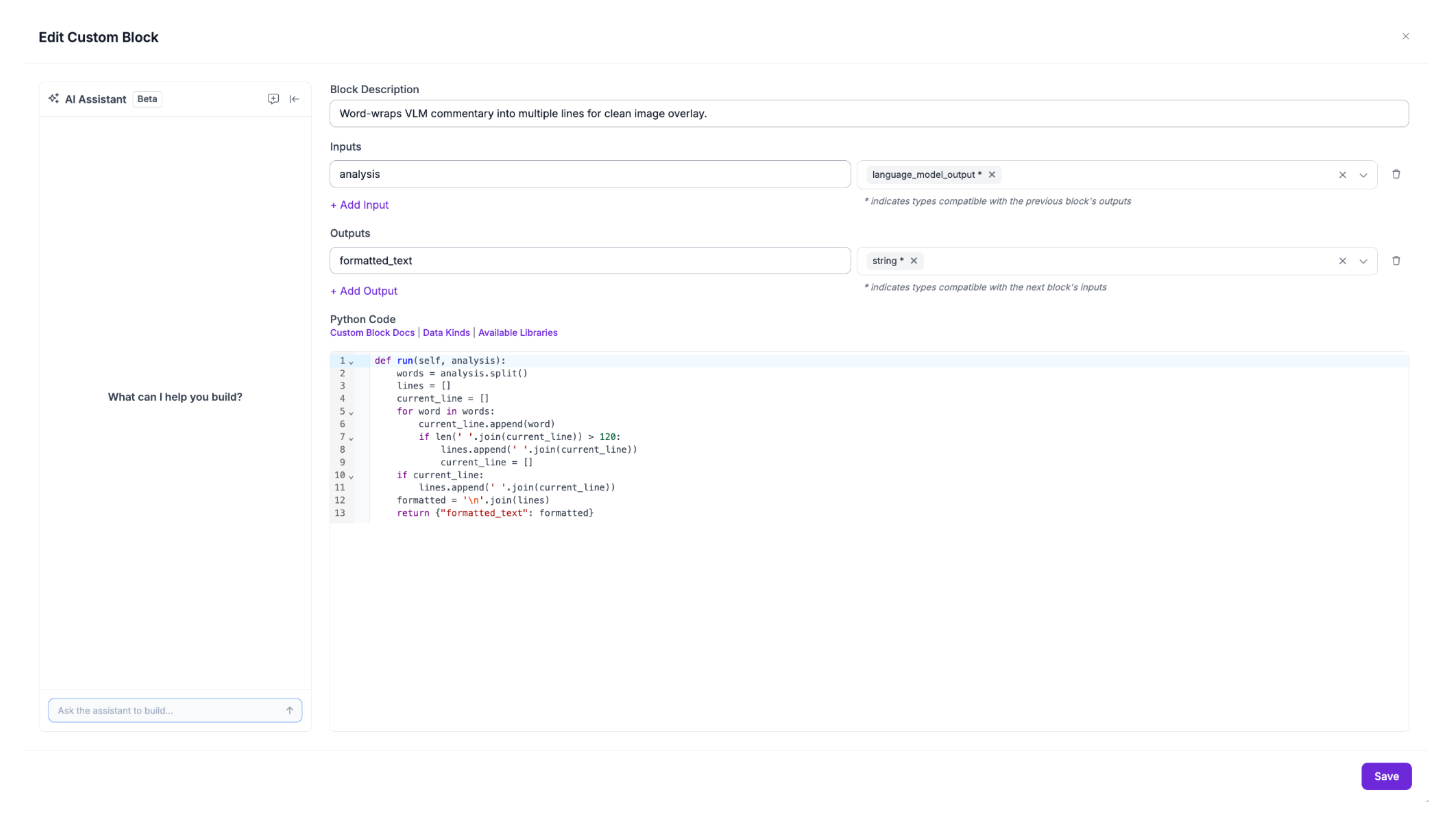
Configure the Format Text Block
Add a Custom Python Block after the Claude block to word-wrap the commentary into multiple lines for clean image overlay. Set the input as `analysis` with type `language_model_output`, connected to the Claude block's output. Set the output as `formatted_text` of type `string`. Use the following code:
def run(self, analysis):
    words = analysis.split()
    lines = []
    current_line = []
    for word in words:
        current_line.append(word)
        if len(' '.join(current_line)) > 120:
            lines.append(' '.join(current_line))
            current_line = []
    if current_line:
        lines.append(' '.join(current_line))
    formatted = '\n'.join(lines)
    return {"formatted_text": formatted}
Without this step, Claude's response would render as a single long line that runs off the edge of the frame.
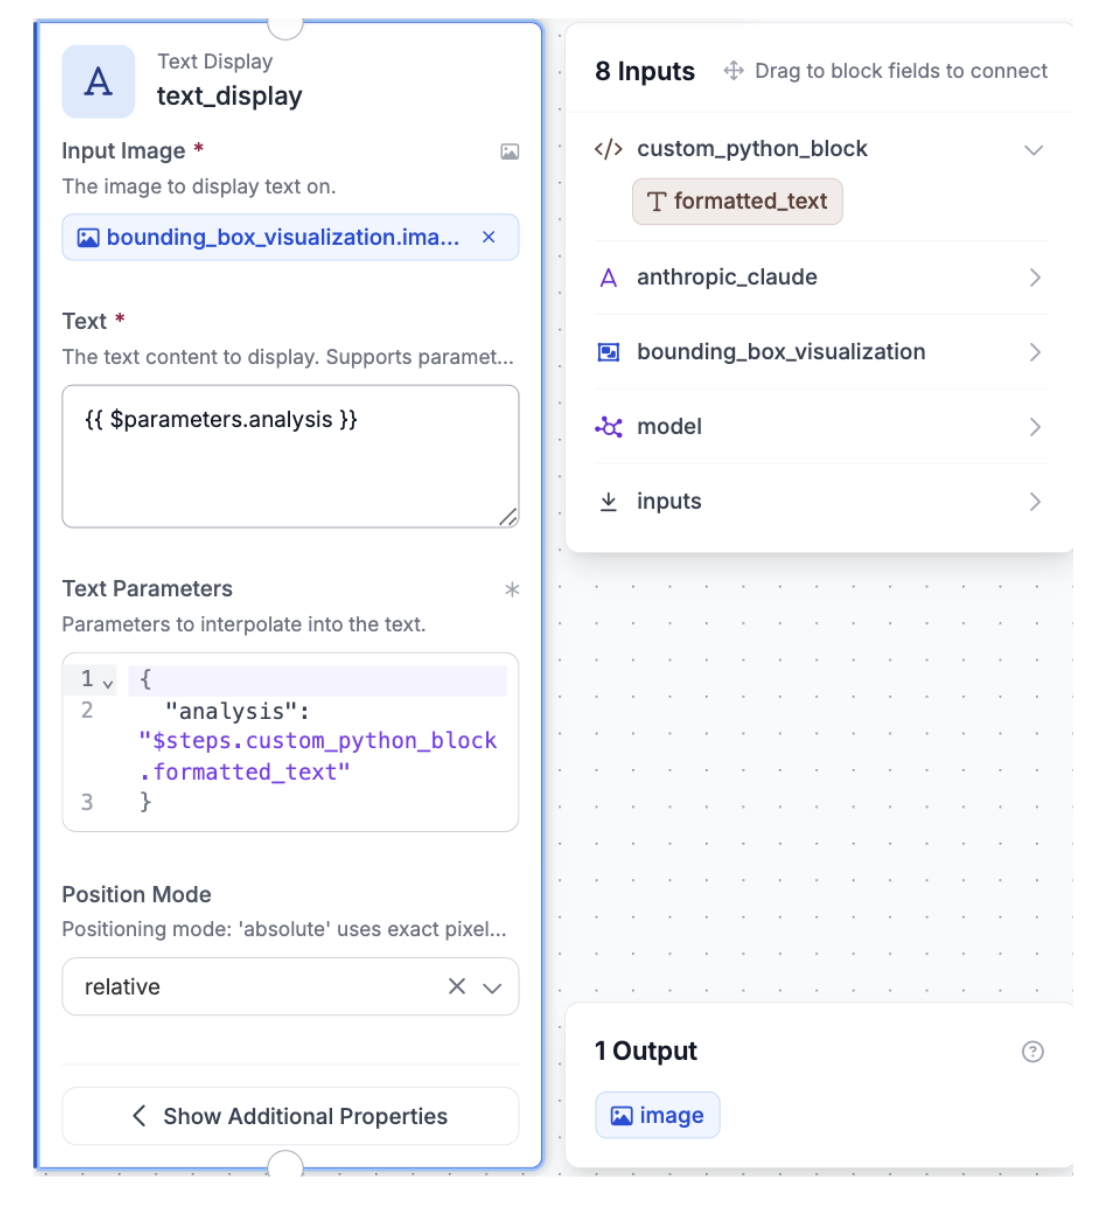
Configure the Text Display Block
Add a Text Display block and connect it to the Format Text output. Configure:
- Text color: White
- Background color: Black
- Background opacity: 0.5
- Font scale: 0.4
- Font thickness: 1
- Padding: 15 pixels
- Anchor: Bottom center
This burns the wrapped commentary directly onto the annotated image, producing a single output frame with bounding boxes and tactical analysis ready to view.
Step 4: Test the Workflow
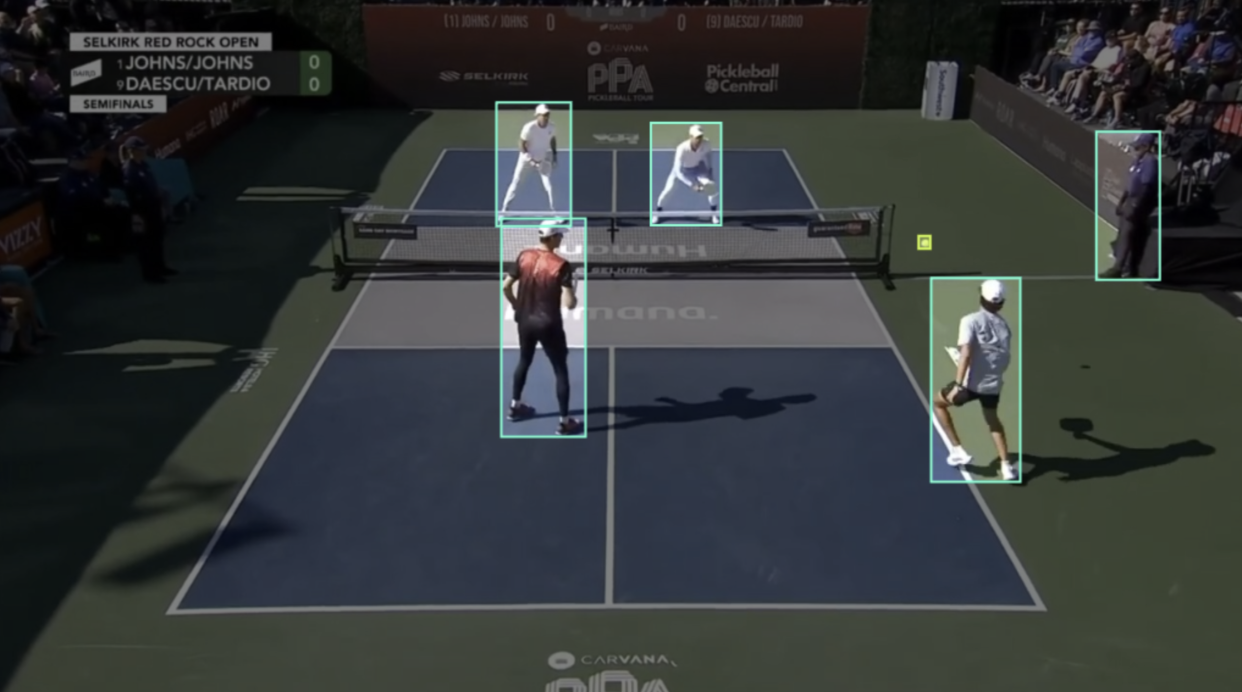
Click the run symbol in the top-right corner of the Workflows Builder. Upload a test image of a pickleball match, capturing both players and the ball during a rally.
Within seconds, you'll receive the output: the final annotated image with bounding boxes and AI commentary burned into the bottom of the frame.
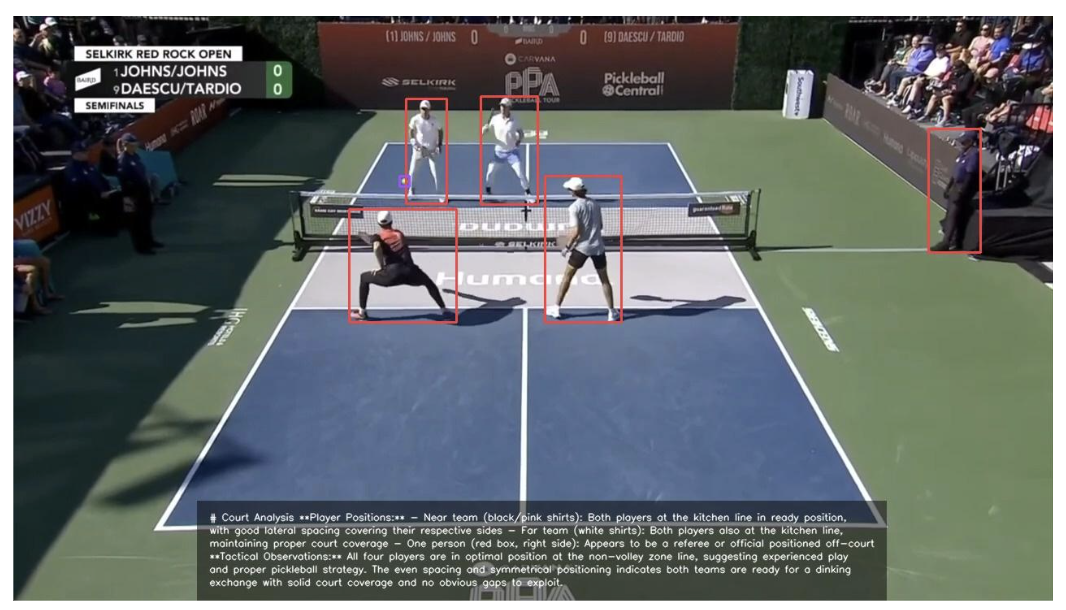
If a field is wrong or the commentary misreads positioning, iterate the prompt rather than retraining the model. Adding context like player count or court surface is a single prompt edit away.
Using Roboflow Agent for Pickleball Tracking
You can also use Roboflow Agent for pickleball tracking. Agent is on the Roboflow app homepage, and acts as a conversational layer on top of Roboflow’s tools, including models, datasets, and workflows.
You can describe what you want in plain English, and it handles the process of building it for you making it easier to create, test, and deploy computer vision applications without needing to write complex code. Here's an example of how you can use it to build your pickleball workflow.
Automated Pickleball Analytics Conclusion
You've built a pickleball player positioning analysis system that combines RF-DETR's object detection with Claude Sonnet 4.5's tactical reasoning to deliver coaching-grade insights from a single match frame. The detect-then-reason pattern is what makes this work: a specialized detector localizes players and the ball, then Claude Sonnet 4.5 analyzes the annotated frame to interpret what the positioning means tactically.
From here, the natural extension is running the workflow across multiple frames to aggregate positioning patterns over time, or integrating player tracking IDs to follow individuals across frames. Both are achievable within the Roboflow Workflows ecosystem.
Further reading
Below are a few related topics you might be interested in:
Cite this Post
Use the following entry to cite this post in your research:
Contributing Writer. (May 11, 2026). Pickleball Player Performance Analytics with Roboflow. Roboflow Blog: https://blog.roboflow.com/automate-pickleball-analytics/