
Detecting potholes from a vehicle moving past 100 km/h means a single missed frame breaks the tracking chain and degrades the data repair crews depend on, so this tutorial builds a pothole tracking pipeline that holds detections across consecutive frames. You train an RF-DETR detector on a Roboflow Universe road dataset, then build a Roboflow Workflow that pairs it with ByteTracker for persistent IDs, counts unique potholes, flags severity, and overlays a live repair status on the feed. The same workflow can be generated from a plain-language prompt using the Roboflow Agent.
Maintaining safe transportation infrastructure is a massive logistical challenge for modern cities. The presence of potholes leads to significant vehicle damage and safety hazards, yet traditional manual inspection methods are often too slow to keep pace with road deterioration. Developing a computer vision system for this task requires high precision and consistent detection. When identifying road defects from a moving vehicle (which may travel at speeds exceeding 100 km/h), the software must accurately pinpoint hazards across consecutive video frames to produce reliable telemetry.
Relying on a single snapshot is insufficient; losing a detection during a high-speed drive or in low-light conditions breaks the tracking chain, reducing the utility of the data for repair crews. Transitioning to automated vision pipelines enables municipalities to use standard camera feeds to gather real-time infrastructure metadata with high efficiency. This guide details the construction of a pothole tracking prototype using the Roboflow platform.
Building a Pothole Tracking Pipeline with RF-DETR
Step 1: Establish Your Development Environment
Begin by logging into the Roboflow Dashboard. A centralized hub is essential for organizing image datasets, hosting custom neural networks, and maintaining project versioning as you iterate on your model. For teams working on public works projects, this environment provides a shared workspace to track model progress and deployment status.
Step 2: Source a Good Dataset
The performance of an artificial intelligence model is rooted in training data that reflects the actual deployment environment. For infrastructure tasks, Roboflow Universe provides an extensive library of public datasets containing various pavement types, weather conditions, and lighting angles. Finding a dataset that includes diverse road surfaces (smooth asphalt, weathered concrete) helps ensure the model generalizes well to different neighborhoods.
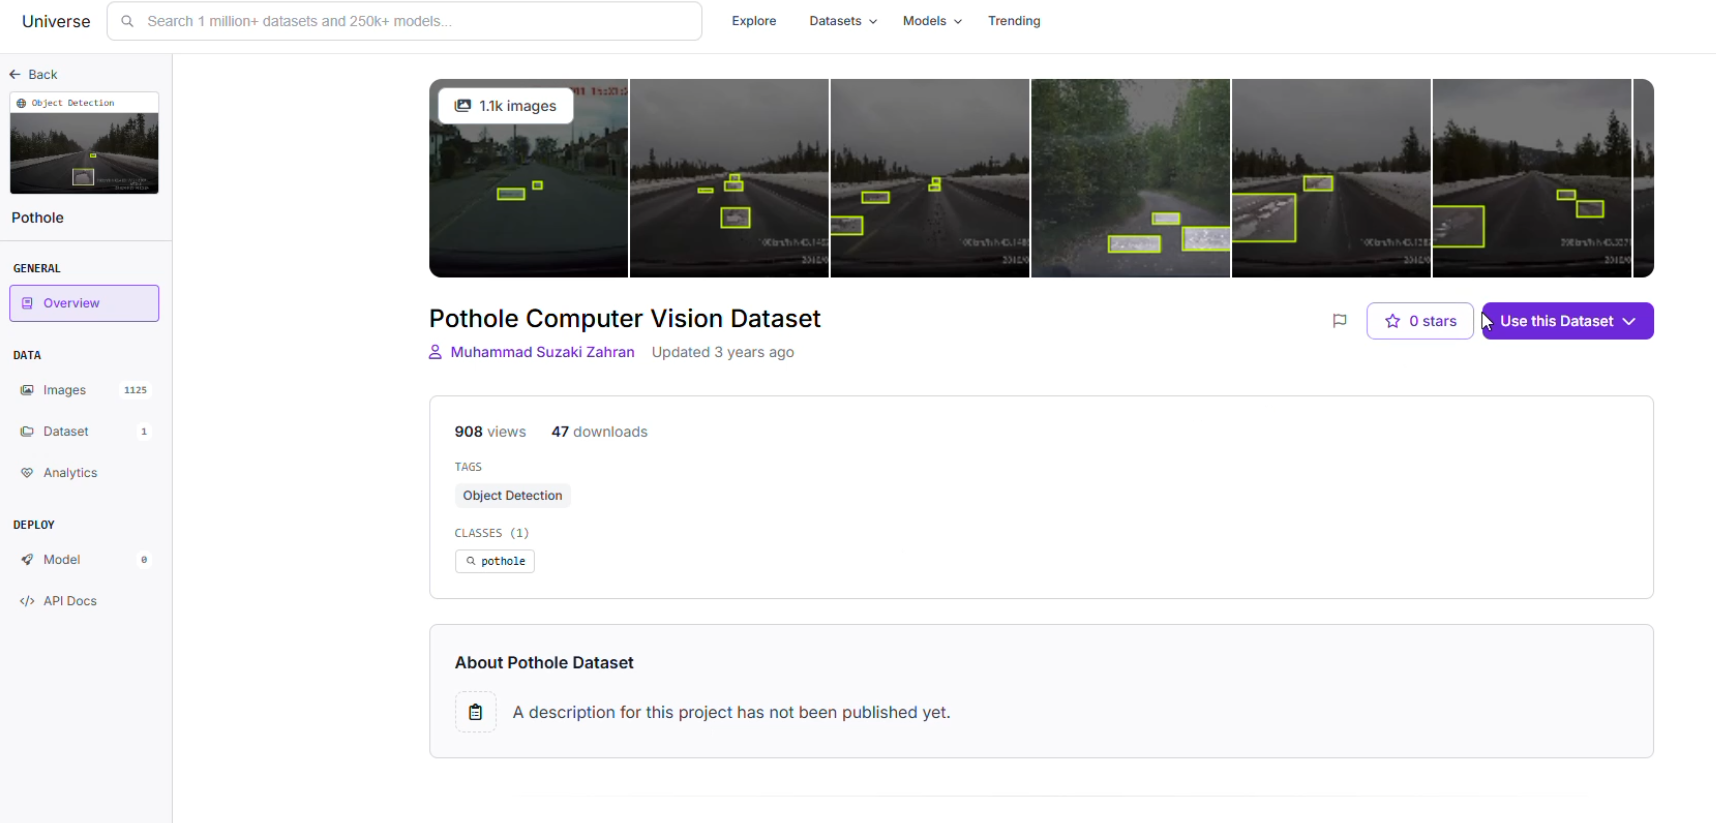
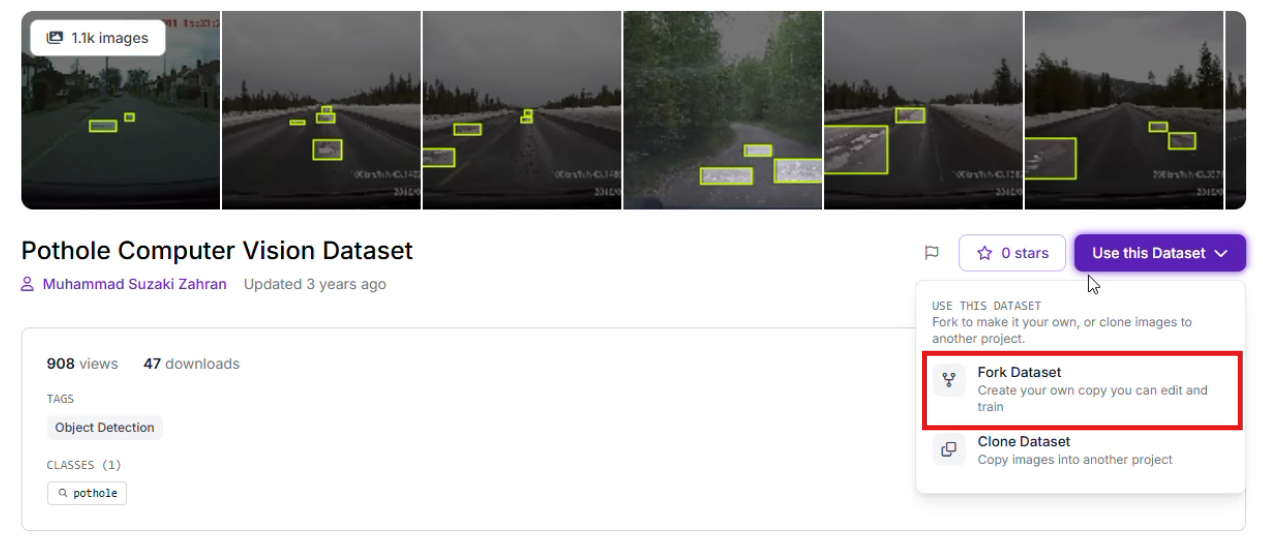
Once a suitable foundation is found, use the "Clone" feature to bring the images into your workspace for customized refinement.
Step 3: Precise Labeling and Annotation
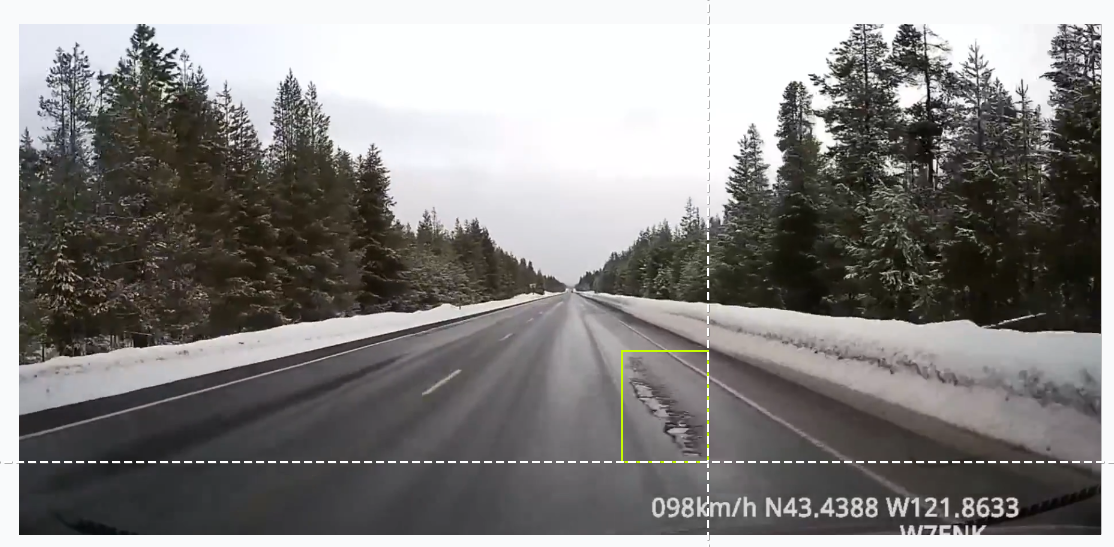
If you are collecting original footage from local dashcams in suburban areas, utilize Roboflow Annotate to define your targets. Creating tight bounding boxes around road defects is critical. To maximize the precision of a region-specific model, you should curate and annotate a custom dataset or at least add images to a pre-built dataset that reflects the unique geographic and environmental conditions of your target area. Accurate labels help the model distinguish the irregular, dark texture of a deep pothole from benign features like shadows, road patches, or damp pavement.
Step 4: Training the RF-DETR Model
This project utilizes Roboflow's RF-DETR architecture. This transformer-based model is engineered for low-latency inference, providing the processing speed required for high-velocity environments. By choosing a transformer-based approach, the system can better understand the global context of a road scene compared to some traditional architectures.
To begin the training process:
- Navigate to the "Train" section of your project.
- Select the Roboflow RF-DETR Object Detection (Small) model.
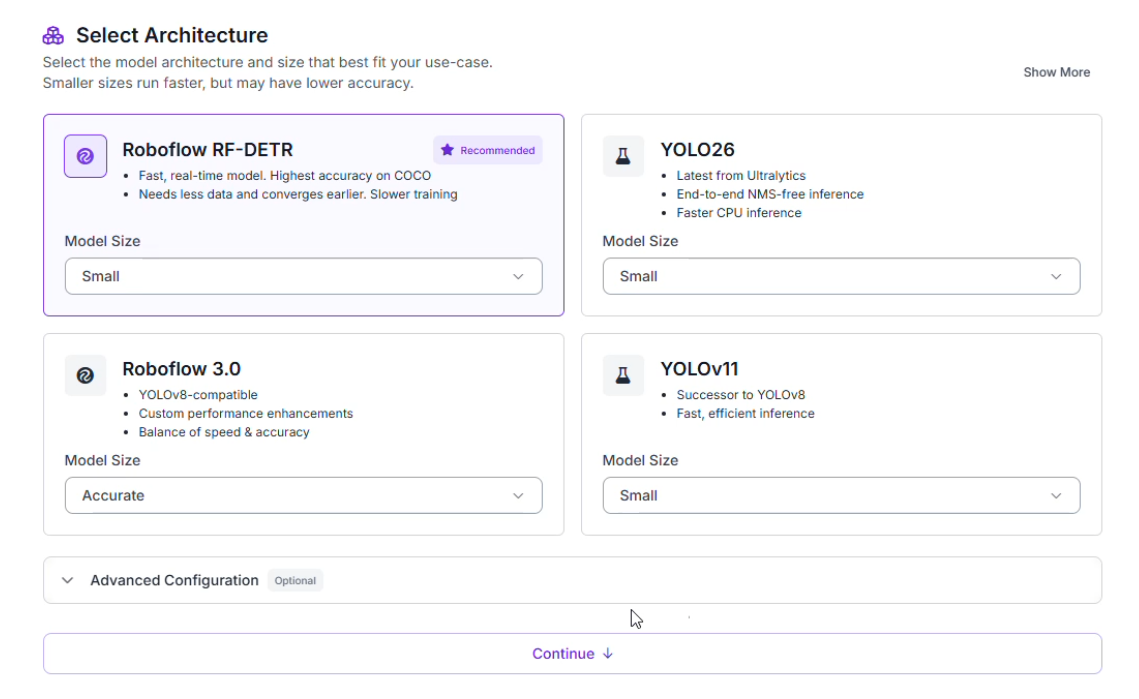
Why choose RF-DETR Small?
- Rapid Inference: Infrastructure safety applications require high frames-per-second (FPS) to ensure hazards are not missed at highway speeds.
- Hardware Compatibility: The compact architecture allows the model to operate efficiently on edge devices or mobile units, minimizing the need for heavy cloud infrastructure during a mobile patrol.
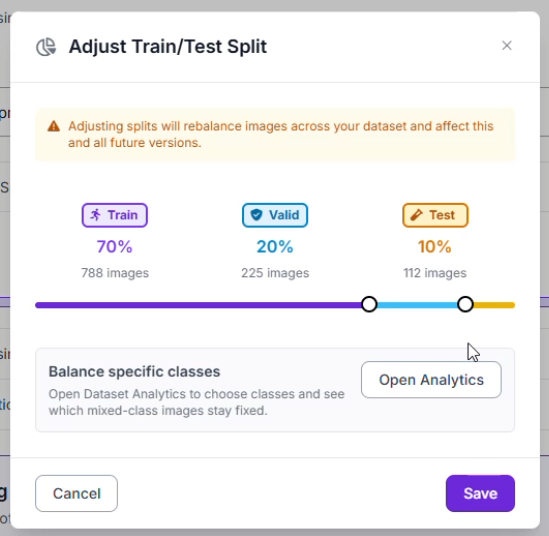
Step 5: Data Partitioning and Preprocessing
To confirm the network performs well across various venues, the dataset was organized into a standard split: a Training Set (70%) to teach patterns, a Validation Set (20%) to prevent overfitting, and a Testing Set (10%) for an unbiased final assessment.
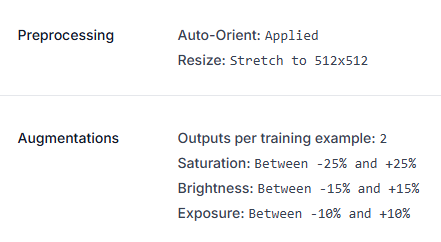
Specific image preprocessing and augmentation steps were implemented to maintain stability despite varying light reflections or weather conditions:
- Standardization: All inputs were resized to a consistent 512x512 resolution.
- Dataset Multiplier: The training pool was expanded by generating 2 augmented versions for every original image.
- Visual Adjustments: Variations in Saturation (±25%), Brightness (±15%), and Exposure (±10%) help the model recognize objects under different color temperatures and lighting conditions, such as harsh overhead stadium lights or glare on the road surface.
Step 6: Analyzing Model Performance
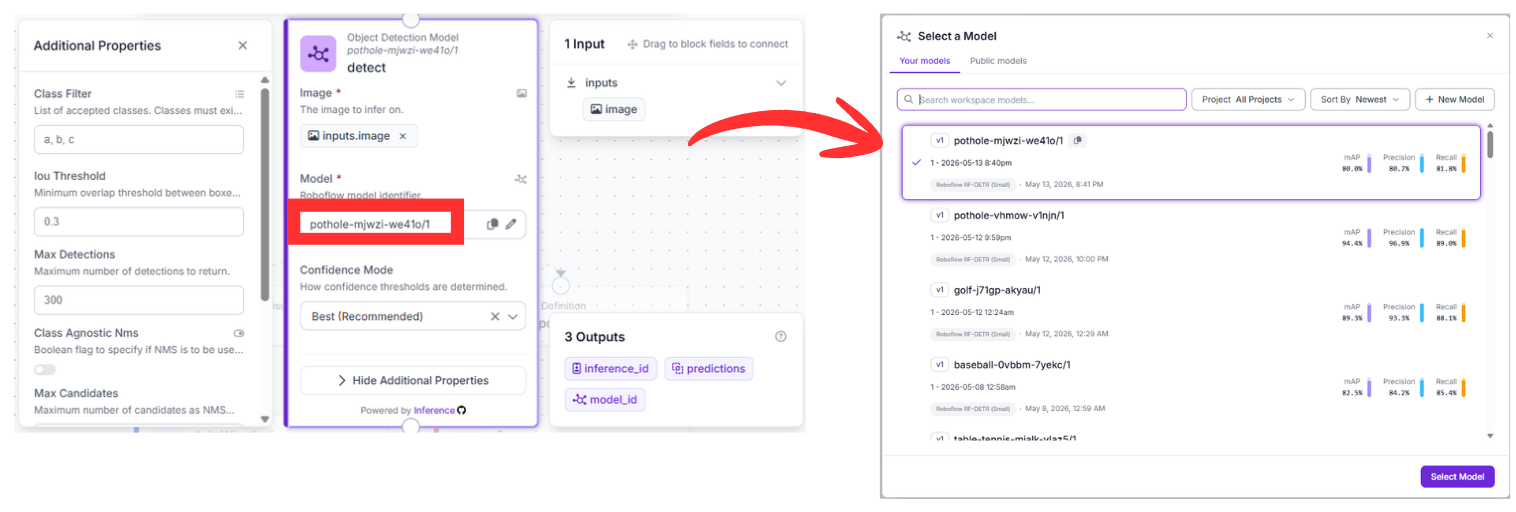
After the training cycle finished, the model (pothole-mjwzi-we41o/1) was assessed through the Production Metrics Explorer. At an optimal confidence level of 50%, the detector produced these results:
- mAP@50: 80.0%
- Precision: 80.7%
- Recall: 81.8%
- F1-Score: 81.3%
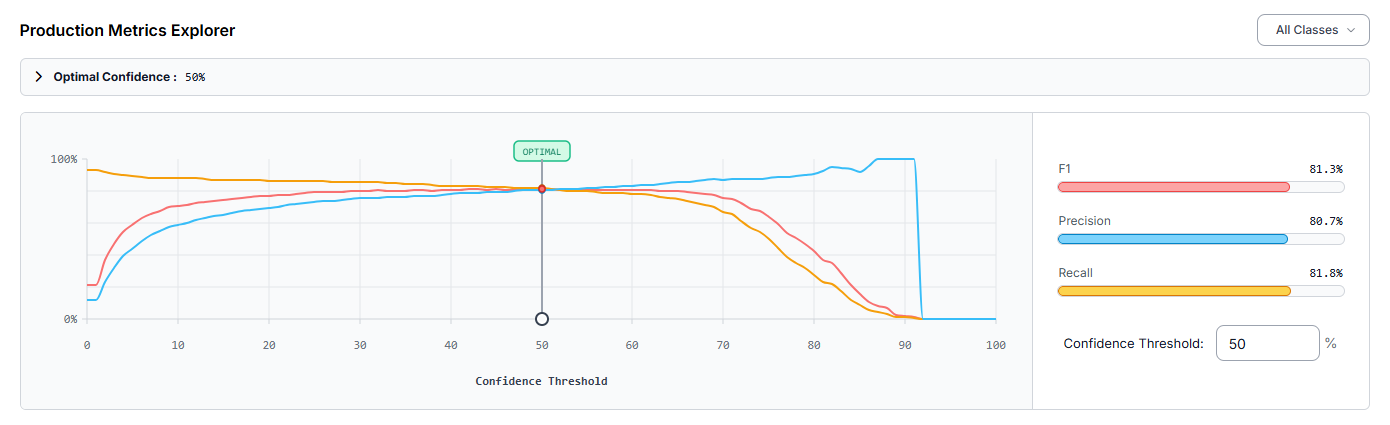
A Precision of 80.7% indicates that most detections were legitimate objects, which helps minimize "ghost" detections from cracks or road debris. The mAP (Mean Average Precision) confirms solid performance across the dataset. However, the evaluation identified that the "pothole" class is occasionally missed (false negatives). To reach higher accuracy, one could add more training images specifically showing potholes at diverse angles or utilize Slicing Aided Hyper Inference (SAHI) for small defects captured from distant cameras.
Constructing the Automated Road Maintenance Workflow
Once the detection model is finalized, the next objective is to architect the logic that governs how the system interprets video data. For monitoring, simply finding a pothole in a single frame is not enough; the system must understand how many unique hazards exist and determine the urgency of repairs.
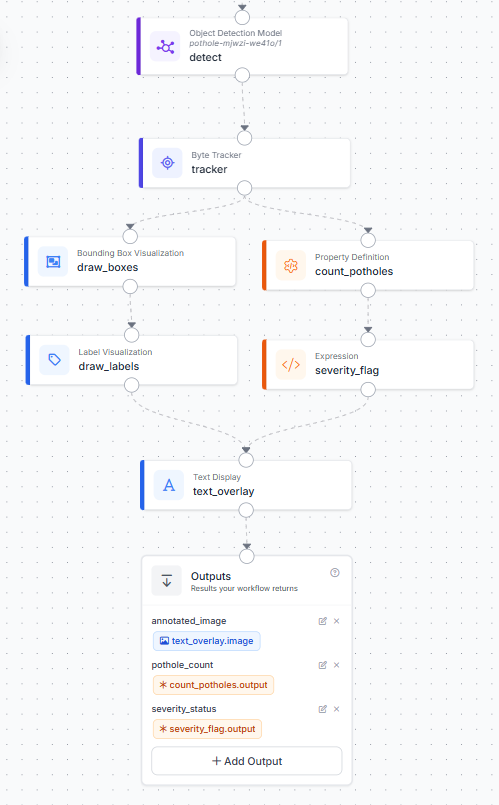
This architecture is built using Roboflow Workflows, a low-code environment for orchestrating complex computer vision tasks. By linking modular blocks, we can transform raw pixels into a visual "Heads-Up Display" (HUD) for road maintenance crews. Here’s the workflow made in this article.
Here is a detailed breakdown of the internal logic displayed in the workflow diagram:
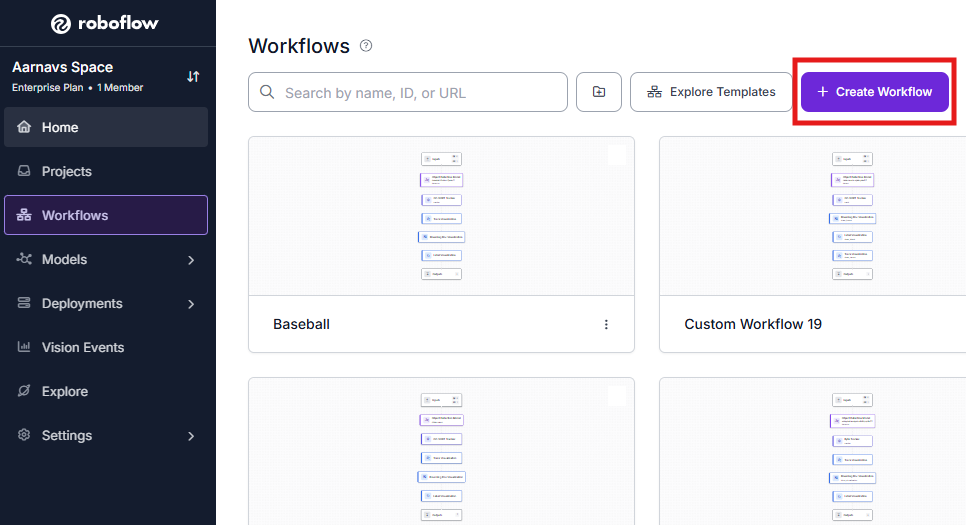
1. Initialize the Workflow
Open the platform dashboard and enter the Workflows builder. Starting a clean development template gives you an environment to place, configure, and link your functional blocks.
2. The Detection Foundation (detect)
The pipeline begins with the Object Detection Model block. This node serves as the "eyes" of the system, pulling raw pixel data directly from the camera input. It is configured to run inference using our specific model: pothole-mjwzi-we41o/1.
As the vehicle moves, this block scans every frame to identify the coordinates of road defects. The output is a list of raw predictions containing the location and confidence scores for every detected pothole.
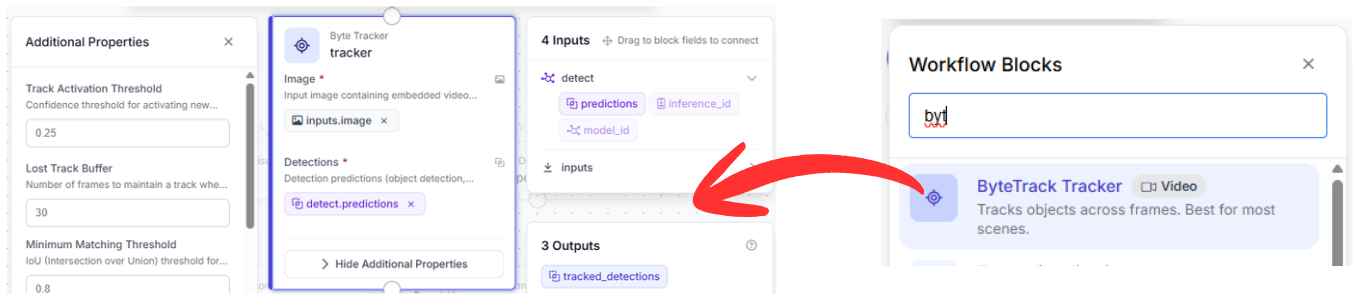
3. Temporal Memory via Byte Tracker (tracker)
Standard object detection models are "stateless," meaning they treat each frame as an isolated snapshot. Without memory, a system would count the same pothole as a "new" detection thirty times per second as you drive over it.
The Byte Tracker block solves this by introducing temporal consistency. It receives both the raw image and the predictions from the previous step. By calculating the movement and momentum of the detections, it assigns a persistent "Tracker ID" to each hazard. This ensures that a single pothole is recorded as one unique event throughout its entire duration in the frame.
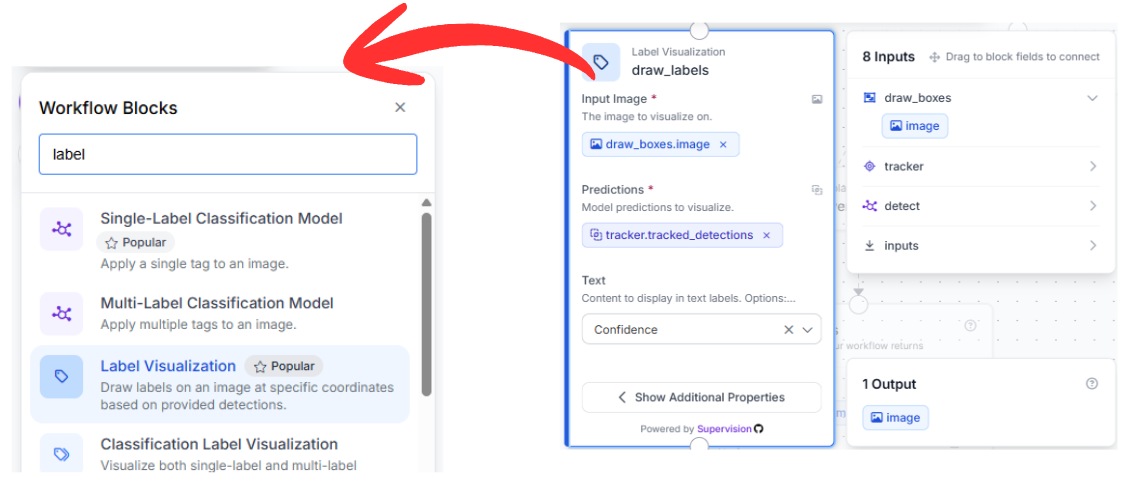
4. Progressive Visual Overlays (draw_boxes & draw_labels)
To make the data accessible to human reviewers or drivers, we use a serial sequence of visualization blocks:
- Bounding Box Visualization: This block takes the tracked detections and renders bounding boxes directly onto the frame. It uses the refined coordinates from the tracker to ensure the boxes remain stable even during high-speed motion.
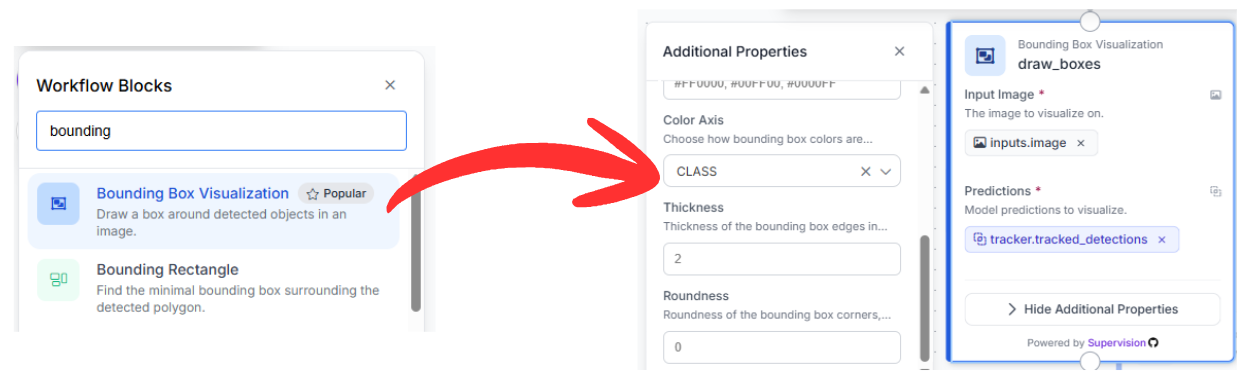
- Label Visualization: Chained directly after the boxes, this node adds text overlays. It is configured to display "Confidence," which helps operators understand the model's certainty. By using the image output from draw_boxes as its input, it builds the visualization layer-by-layer.
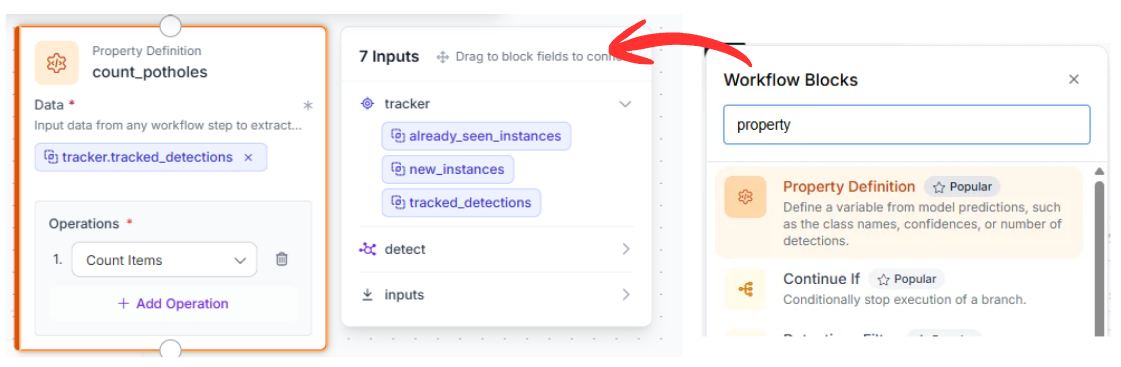
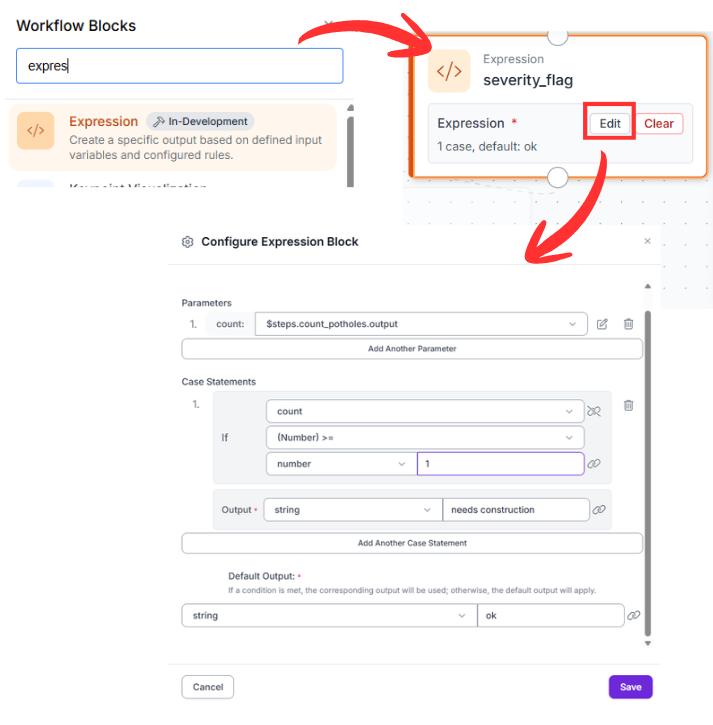
5. Intelligent Data Analysis (count_potholes & severity_flag)
Beyond visuals, the workflow performs real-time data processing to assess road quality:
- count_potholes: This Property Definition block uses a SequenceLength operation. It looks at the list of tracked detections and calculates exactly how many potholes are currently visible.
- severity_flag: This is an Expression block that acts as the system's "brain." It takes the integer count and applies a logical test. If the count is >= 1, it returns a status of "needs construction." This provides a simplified binary output that can trigger automated alerts or work orders.
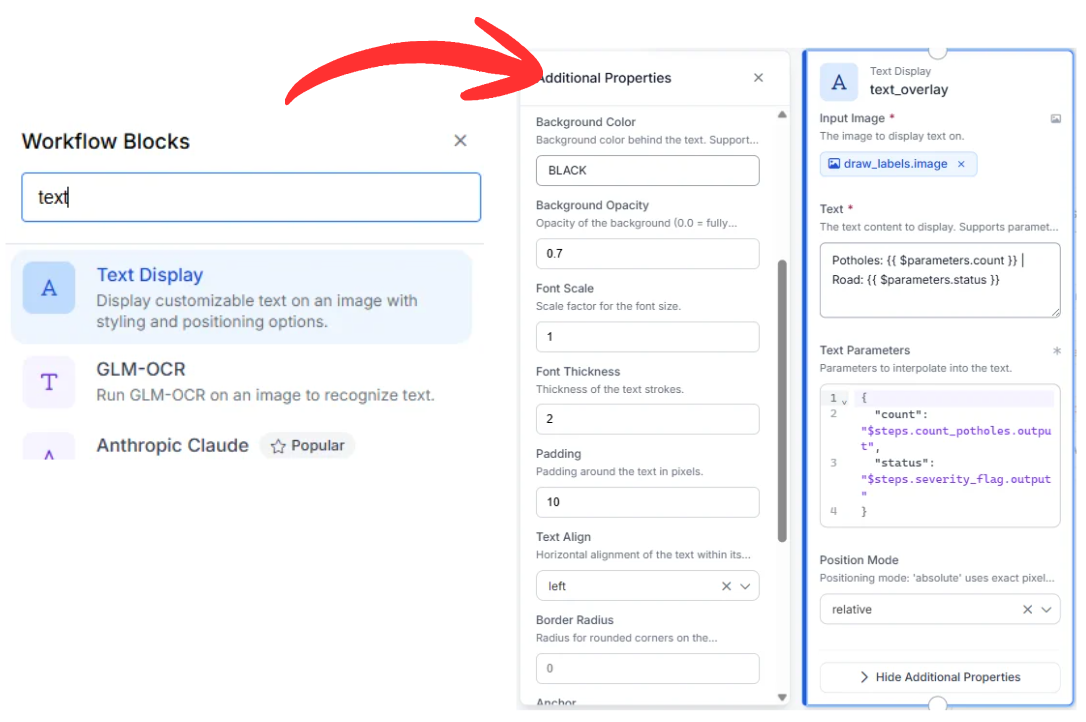
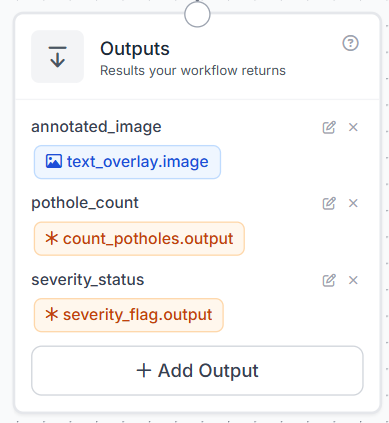
6. Final HUD Integration (text_overlay)
The last functional node is the Text Display block. It gathers three distinct pieces of information: the labeled image, the numerical count, and the severity status.
It generates a stylized overlay (white text on a semi-transparent black background) positioned in the top-left corner. This creates a real-time summary for the user: "Potholes: {{count}} | Road: {{status}}". The output is a simple, broadcast-style prototype video stream ready for live monitoring.
7. Finalizing the Workflow
The Outputs block is where the workflow sends all the final information. Instead of just getting a simple image back, this step organizes the data so you can use it in other apps or save it to a database.
Running the Pothole Detection Workflow
When you run this computer vision pipeline, the system takes your raw video and immediately identifies any road hazards it sees. It follows each pothole so it doesn't count the same one twice, and adds a clear status label to the screen. You’ll get a processed video feed along with a data summary that makes it easy to plan road repairs.
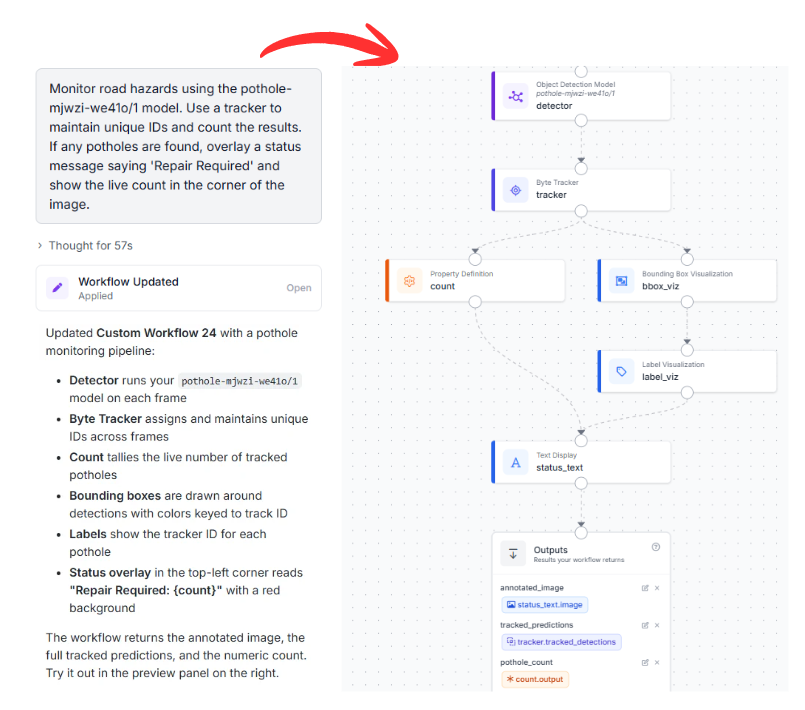
Alternative Deployment: Leveraging the Roboflow Agent
If you prefer to accelerate your development cycle, you can utilize the Roboflow Agent. This AI assistant can generate this entire multi-block architecture based on a simple natural language request.
Example Prompt:
"Monitor road hazards using the pothole-mjwzi-we41o/1 model. Use a tracker to maintain unique IDs and count the results. If any potholes are found, overlay a status message saying 'Repair Required' and show the live count in the corner of the image."
The Agent will analyze the request, verify the compatibility of the model, and automatically construct the block graph, allowing you to move from a concept to a functional deployment in seconds.
Pothole Detection Conclusion
Integrating an RF-DETR detector with a Byte Tracker and logical expressions provides an analytics framework for smart cities. This setup allows for the precise logging of road conditions and automated prioritization of repairs.
Ready to optimize your infrastructure? Create a free Roboflow Account and start building your own vision-powered solutions today.
Cite this Post
Use the following entry to cite this post in your research:
Aarnav Shah. (May 15, 2026). Pothole Detection with RF-DETR. Roboflow Blog: https://blog.roboflow.com/pothole-detection/