
Many industrial gauges and meters remain analog because cost, compatibility, or aging equipment make replacement impractical. This tutorial shows how to bridge that gap with computer vision: an object detection model is trained to locate the dial center and needle tip on a pressure gauge, then a Python script calculates the needle angle and maps it to a PSI reading using a calibration formula. The result is a repeatable pipeline that converts an analog gauge into a live digital feed any downstream system can act on.
Most useful data you will find is already digitized, but a surprising number of gauges and meters are still analog. The most obvious solution is to replace the dials with a digital sensor and display. However, this isn’t always possible due to cost, compatibility, and other constraints. Equipment may be dependent on analog dials because manufacturers do not support analog dials or because there is no way to retrofit new dials into old equipment.
This blog shows how computer vision can be used to turn an analog measurement into useful computer data. Let’s begin.
The Problem: Reading Analog Dials
Imagine a large reactor where chemicals produce heat while reacting. The temperature and pressure gauges in the reactor can show thermal runaway or accumulation of excess energy which causes the chemicals to react even faster until the system explodes.
A safety shutoff valve, insertion of inert elements or molecules, or rapid cooling can be used to stop the reaction. But, before these methods are executed, the computer needs to understand that action is needed. The computer needs a way to read the analog data on the temperature and pressure dials.
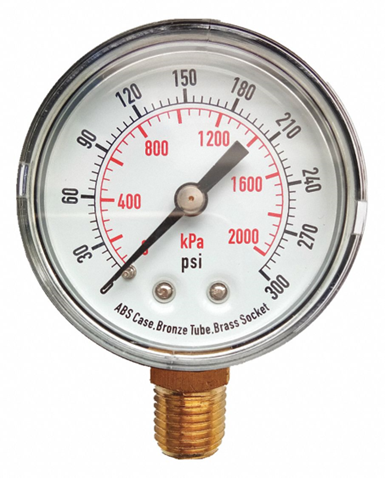
Once the computer can read information on dials, information can be processed. The computer can understand if measurements have reached a critical threshold and react to stabilize the system faster than humans can. The first step to solving such a problem, and the focus of this blog, is to create a way to read analog data with a computer and a camera. An analog pressure gauge, as shown below, will be used in this example.
The Solution: Object Detection
Object detection (OD) is a computer technology related to computer vision and image processing that deals with detecting instances of objects of a certain class (such as humans, buildings, numbers, or cars) in digital images and videos.
Humans can look at a pressure gauge and understand the values. Computers, with help from a camera and a computer vision model, can also monitor the pressure gauge even though the gauge is analog. The computer can identify objects like numbers, needle tip location, the angle of the needle, and more.
To make scripting and annotating simpler, this example chooses the least number of objects needed to read the gauge: the needle tip and needle base. These will be used to find the angle of the needle which will then be used to calculate the pressure.
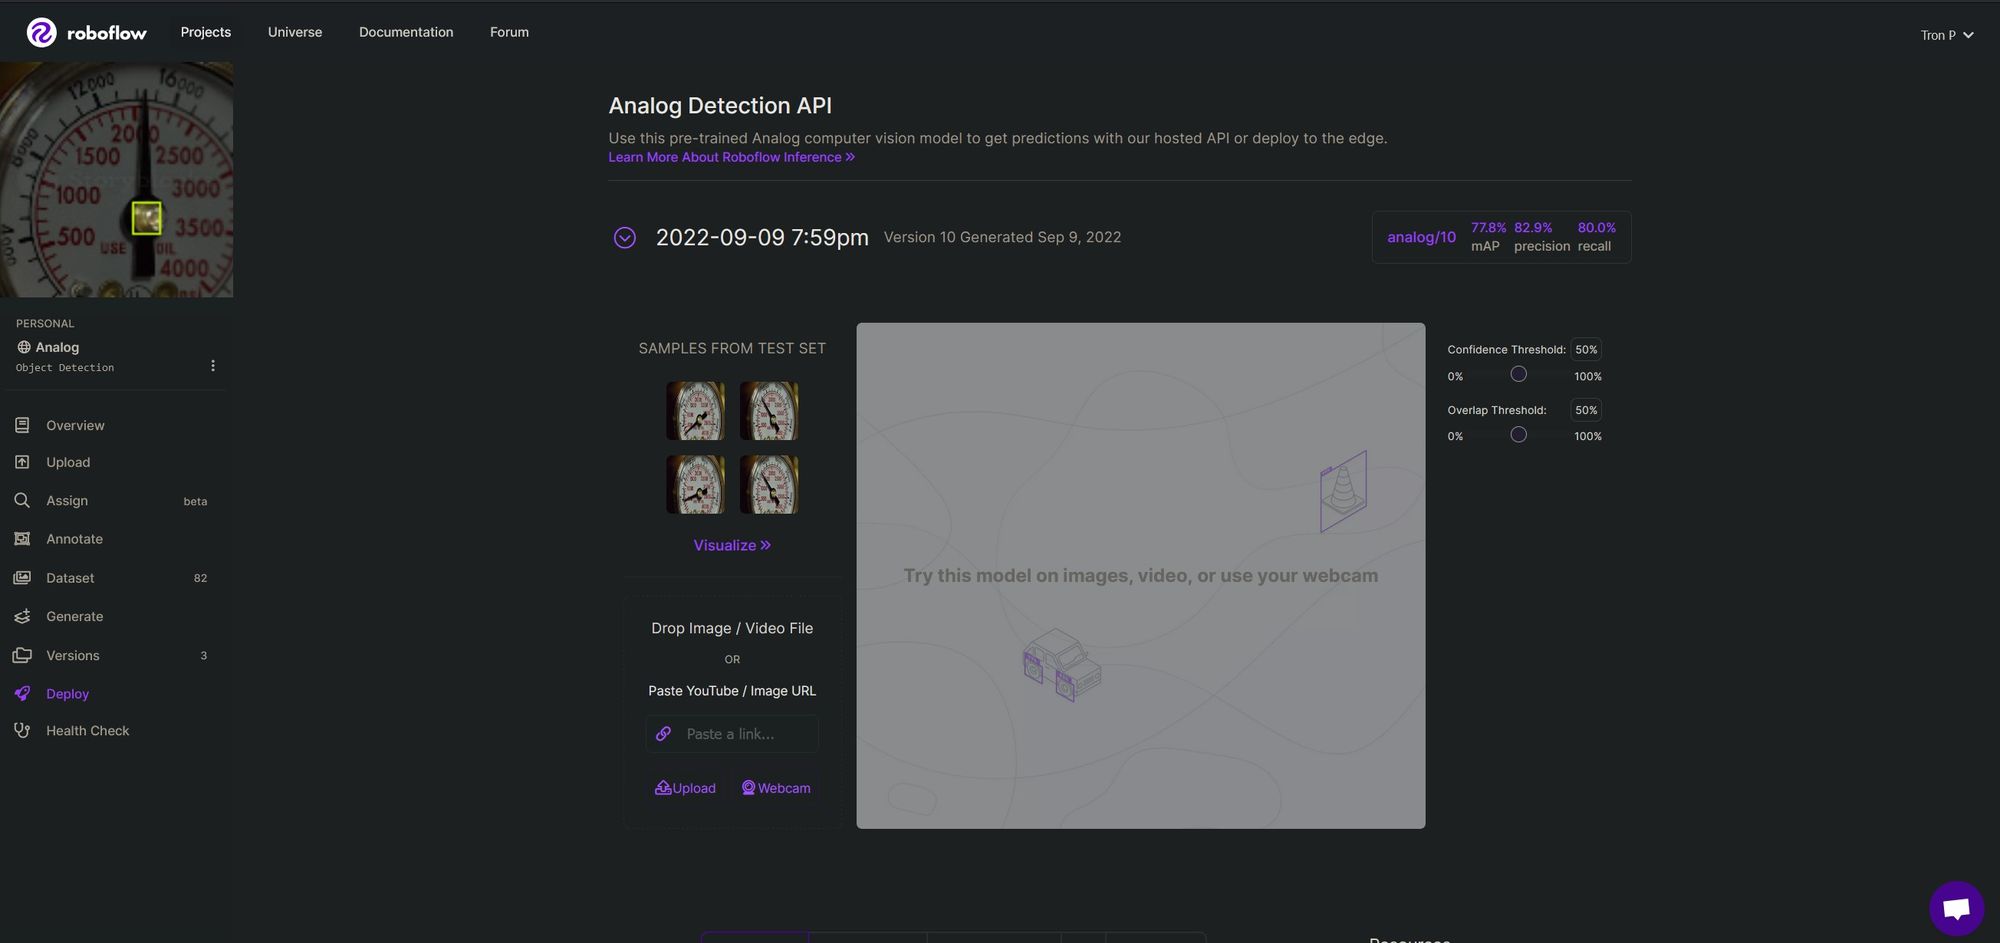
Before we continue, below you will see the results of the project to give you an idea of where we are heading. The source code for this project is live on GitHub.
0:00/1×
Step 1: Upload and Annotate Images
First, we’re going to upload a video of a pressure gauge to Roboflow. We will use Roboflow to divide the video into frames – individual pictures – which we can annotate. The annotations we create will be used later to train our model to identify various features in an image.
This video of a pressure gauge will be used to train a model to detect the dial tip and base. Note that images and videos from any source can be used to upload directly to Roboflow for annotating, training, and deploying. To upload the video, use Roboflow’s drag-and-drop web UI.
When prompted to choose at how many frames per second the video should be cut, choose 5 frames per second. This will yield 103 images for us to annotate.
Keep in mind that the more diverse images or videos uploaded and annotated, the higher accuracy of the model becomes after training. This includes generalizing that can help in detecting accurate objects with different cameras, changes of lighting, different gauges, etc.
After you have uploaded the images from the video, it is time to annotate each frame. You should draw tight boxes around:
- The needle tip
- The needle base
You should draw an annotation box as close as you can around both of these properties. This will help the model learn to locate the needle tip and base with a higher degree of accuracy.
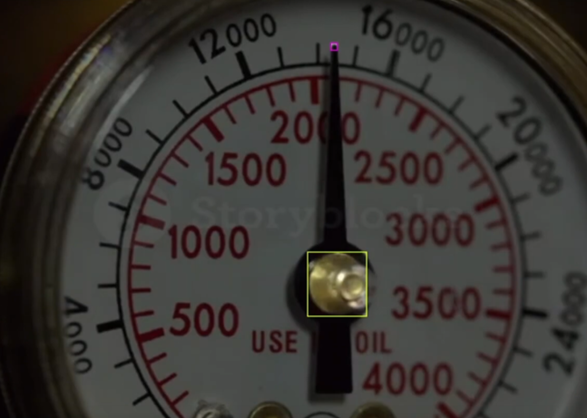
Here is an example of an annotated gauge:
guide to image annotation best practices
Click the “Add [number of images] image to Dataset” button to add the images you have annotated to the dataset that will be used in training. Roboflow will then ask you what train, valid, and test split you want.
It is recommended to use the default values, which are 70% of images for training, 20% for validation, and 10% for testing. You can learn more about this data split in our guide to training, validation, and test datasets.
Step 2: Train a Model to Detect Dial Features
Now, let's train our model! To do so, first click on the “Generate” or “Versions” buttons found at the bottom left of the page. This will take you to a page where you will prepare your model for training.
On this page, we need to click “Edit” on the “Resize” value. Change “Stretch to” to “Fit within” to keep the images’ aspect ratio. This example uses an image resize of 640 px by 640 px. After this, we need to apply image augmentations, which generate new images based on a sample of images in our training dataset.
Augmentations create a diverse set of artificial images from the original that helps the model understand what specific features to look out for without bias introduced by lighting, orientation, location, hue, contrast, etc.
You should set the following augmentation values:
- Flip: Horizontal, Vertical
- 90 degree rotate: Clockwide, Counter-Clockwise, Upside Down
- Crop: 0% Minimum Zoom, 5% Maximum Zoom
- Rotation: Between -5 degrees and +5 degrees
- Hue: Between -6 degrees and +6 degrees
- Saturation: Between -7% and +7%
- Brightness: Between -9% and +9%
- Blur: Up to 1px
- Noise: Up to 5% of pixels
(Note, I have kept many values close to the original as I will only be demonstrating this model on the same video, but for better generalization, the reader can increase the range shown above.)
When asked to choose how many images to generate with our augmentations, select 3x. Then, click “Generate.” Now our augmentations have been applied, it is time for us to train our model.
Click the “Start Training" button. Depending on your preferences, click either “Fast” or “Accurate.” This example will use “Accurate” as less than 110 images were used and we want our model to be as accurate as possible. Give your model 10 minutes to 24 hours to train, and an email will notify you when this has finished.
To deploy your video and images, click “Deploy” on the bottom left and drag and drop your content to the “Try this model on…” section.
Step 3: Write a Script to Read Dials
Now that the model can predict the location of the needle tip and needle base, it is time to write the requisite code to infer on videos. Using data from our inferences, we will run a few calculations to generate pressure measurements.
Let's start coding!
Initialize the Script
First, let's import the requisite dependencies for our project and set a few parameters that we'll use later in our code. The predicted paths are the folder paths of the original video placement and the annotated placement. A minimum score of 0.4 is used, which means our model must return a confidence value of 40% or greater before showing us a prediction.
import os
import cv2
import time
import shutil
import math
import winsound
import requests
from PIL import Image
import io
from requests_toolbelt.multipart.encoder import MultipartEncoder


# User parameters
TO_PREDICT_PATH         = "./To_Predict_Videos/"
PREDICTED_PATH          = "./Predicted_Videos/"
MIN_SCORE               = 0.4 # Minimum object detection score
Prepare Code to Read Videos
Next, we're going to loop through each video in our "To_Predict_Videos" directory. This is the directory where we are keeping all of the videos of pressure gauges whose readings we want to take. For each video, we're going to capture images of a frame on which we can infer.
frequency = 700  # Hertz
duration = 150  # Millisecond

# Loops through each video found in TO_PREDICT_PATH folder
for video_name in os.listdir(TO_PREDICT_PATH):
    video_path = os.path.join(TO_PREDICT_PATH, video_name)

    video_capture = cv2.VideoCapture(video_path)

    # Video frame count and fps needed for VideoWriter settings
    frame_count = int(video_capture.get(cv2.CAP_PROP_FRAME_COUNT))
    video_fps = round( video_capture.get(cv2.CAP_PROP_FPS) )

    # If successful and image of frame
    success, image_b4_color = video_capture.read()

    fourcc = cv2.VideoWriter_fourcc(*'MP4V')
    video_out = cv2.VideoWriter(PREDICTED_PATH + video_name, fourcc, video_fps, (int(image_b4_color.shape[1]), int(image_b4_color.shape[0])))
Send Frames from Video to the Roboflow API
Next, we want to send each photo we take to the model we trained on Roboflow earlier. We can do this by making a HTTP POST request to the Roboflow Inference API. This API will accept an image and return a JSON object with predictions returned from our trained model. Add this code to the for statement we wrote in the last section:
    while success:
        success, image_b4_color = video_capture.read()
        if not success:
            break

        # Inference through Roboflow section
        # ----------------------------------
        # Load Image with PIL
        image = cv2.cvtColor(image_b4_color, cv2.COLOR_BGR2RGB)
        pilImage = Image.fromarray(image)

        # Convert to JPEG Buffer
        buffered = io.BytesIO()
        pilImage.save(buffered, quality=100, format="JPEG")

        # Construct the URL
        upload_url = "".join(
            [
                "https://detect.roboflow.com/analog/10",
                "?api_key=ROBOFLOW_API_KEY",
                "&confidence=" + str(MIN_SCORE),
            ]
        )

        # Build multipart form and post request
        m = MultipartEncoder(
            fields={"file": ("imageToUpload", buffered.getvalue(), "image/jpeg")}
        )

        response = requests.post(
            upload_url,
            data=m,
            headers={"Content-Type": m.content_type},
        )

        predictions = response.json()["predictions"]
Calculate the Corners of the Objects
The next step is to retrieve the coordinates for the corners of the objects returned by the API. We're going to save these values in a list for later use. We can do this using the following code:
	object_coordinates = []
        labels_found = []
        confidence_level_list = []
        for prediction in predictions:
            x1 = prediction['x'] - prediction['width']/2
            y1 = prediction['y'] - prediction['height']/2
            x2 = x1 + prediction['width']
            y2 = y1 + prediction['height']
            object_coordinates.append([x1, y1, x2, y2])

            label = prediction['class']
            labels_found.append(label)
The information we have so far tells us where important features are – the tip and the center of the needle – but we don't have one crucial piece of data: the angle of the needle. Our model can only detect objects in images, but luckily for us we can use a bit of math to calculate the angle of the needle.
Calculate the Angle of the Needle
To do this, the center of the needle tip’s bounding box as well as the center needle base’s bounding box is needed. We can use trigonometry to calculate the angle.
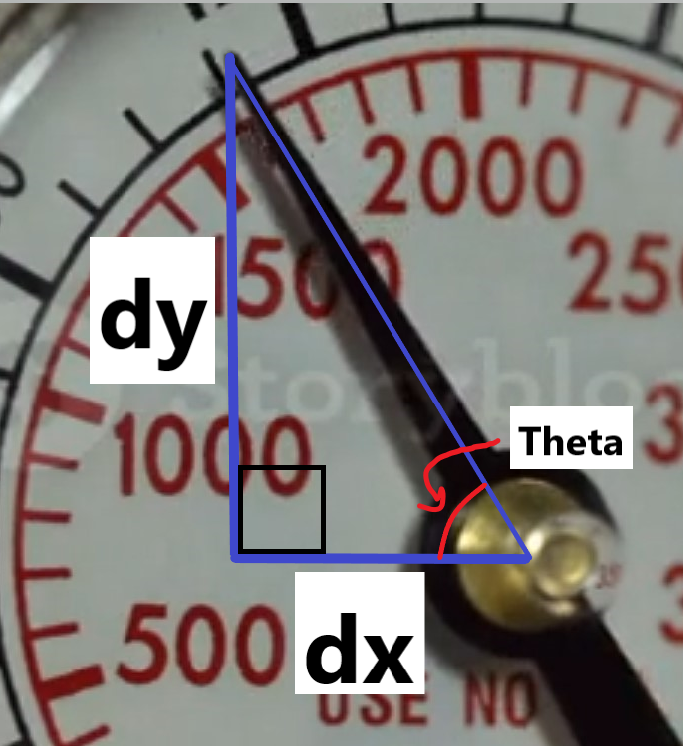
We can draw a right-angled triangle using the center of the bounding box for the needle tip and needle base. The calculated center of these bounding boxes is used to find the distance in the x and y direction from the needle base to the needle tip (or dx and dy shown in the image below).
Now that we know dx and dy (known as adjacent and opposite sides of the triangle in trigonometry), we use this to find theta (Θ) (equation shown below). (Note arctan and tan^-1 are the same things.)
The image below illustrates how the dx and dy values will allow us to calculate theta for the angle of the needle.
In the following code snippet, we will:
- Find coordinates for the center of the needle
- Find coordinates for the needle tip
- Find the theta angle of the needle tip using trigonometry
To calculate the theta angle, we need to find the Arctan (inverse tangent) of the length of the opposite divided by the adjacent side:
Theta = Arctan (Opposite side / Adjacent side)
Here is the code we'll need to use:
# If both Center and Needle Tip found, then calculate angle
if "Center" in labels_found and "Needle_Tip" in labels_found:
    # Grabs "Center" label coordinates
    center_indexes = [
        index for index, x in enumerate(labels_found) if x == "Center"
    ]
    center_coordinates = object_coordinates[center_indexes[0]]

    # Finds center x and y coordinates for "Center" label bbox
    center_x_center = int(
        center_coordinates[0]
        + (center_coordinates[2] - center_coordinates[0]) / 2
    )
    center_y_center = int(
        center_coordinates[1]
        + (center_coordinates[3] - center_coordinates[1]) / 2
    )

    # Grabs "Needle_Tip" label coordinates
    needle_tip_indexes = [
        index for index, x in enumerate(labels_found) if x == "Needle_Tip"
    ]
    needle_tip_coordinates = object_coordinates[needle_tip_indexes[0]]

    # Finds center x and y coordinates for "Needle_Tip" label bbox
    center_x_needle_tip = int(
        needle_tip_coordinates[0]
        + (needle_tip_coordinates[2] - needle_tip_coordinates[0]) / 2
    )
    center_y_needle_tip = int(
        needle_tip_coordinates[1]
        + (needle_tip_coordinates[3] - needle_tip_coordinates[1]) / 2
    )

    # Finds angle - look at triginometry and arctangent
    dy = center_y_needle_tip - center_y_center
    dx = center_x_needle_tip - center_x_center
    theta = math.atan2(dy, dx)
    theta = math.degrees(theta)
theta = round(theta)The issue with the above code is that the theta calculated shows a value of 0 when the needle is on the left and horizontal. The value becomes positive until it reaches 180, where the value goes counterclockwise and negative until it reaches -180 clockwise.
This isn't ideal because our dial isn't a 360 degree circle with different values. Instead, we want zero to start at the 6 o’clock position, 90 at 9 o’clock, 180 at 12 o’clock, and 360 at 3 o’clock. We'll need to add the following code below the code we wrote to calculate the theta value to ensure theta contains a useful value:
    # Changes negative theta to appropriate value
    if theta < 0:
        theta *= -1
        theta = (180 - theta) + 180

    # Sets new starting point
    theta = theta - 90

    # Changes negative thetat to appropriate value
    if theta < 0:
        theta *= -1
        theta = theta + 270

    # theta of 74 is 500 psi and theta of 173 is 2,000 psi
    if theta <= 74 or theta >= 173:
        winsound.Beep(frequency, duration)
At the end of this snippet, we use the winsound library to trigger an audible beep when the theta value – which corresponds with our dial – reaches a certain point.
So far, we have:
- Built a model to recognise needle tips and the center of a dial
- Written code to use that information to calculate the angle of the needle
- Created an audible alert that triggers when our dial records a value over a certain amount
Note that could substitute the beep that triggers in our script for any other alert monitoring system. Imagine a factory that needs to keep tabs on a pressure dial for a gas pipe. If this gas pipe reaches a certain pressure, safety inspectors and management need to be notified immediately. In this scenario, we could have alarms go off in the building, make a record of the exact time the pressure exceeded an acceptable value in a database, and alert on-call engineering staff.
Plot Pressure Annotation on Videos
We're still missing one key feature in our project: the ability to see a dial with the theta angle annotated. We can do this using the following code:
for label_index, label in enumerate(labels_found):
    if "Center" in label:
        labels_found[label_index] = label + " " + str(theta) + " deg"
We're also going to draw bounding boxes and write the labels that correspond to the objects we identified using the Roboflow Inference API. This will let us see an annotation of our needle tip and the center of our dial.
This information is crucial to have because it will let us save videos that show how our model works on real-world dials when given a video.
Here's the code we will need to draw our bounding boxes and labels:
if "Needle_Tip" in label:
        psi = int(15.21 * theta - 638.21) # TODO: Fill out the right values (we'll talk about this later in this post)
        labels_found[label_index] = label + " " + str(psi) + " psi"

        # Writes text and boxes on each frame - used for boxes, degrees, and psi
        for object_coordinate_index, object_coordinate in enumerate(object_coordinates):

            # Recangle settings
            start_point = (int(object_coordinate[0]), int(object_coordinate[1]))
            end_point = (int(object_coordinate[2]), int(object_coordinate[3]))
            color_1 = (255, 0, 255)  # Magenta
            color_2 = (255, 255, 255)  # White
            thickness = 1

            cv2.rectangle(image_b4_color, start_point, end_point, color_1, thickness)

            # For text
            start_point_text = (start_point[0], max(start_point[1] - 5, 0))
            font = cv2.FONT_HERSHEY_SIMPLEX
            fontScale = 0.5
            thickness = 1

            cv2.putText(
                image_b4_color,
                labels_found[object_coordinate_index],
                start_point_text,
                font,
                fontScale,
                color_2,
                thickness,
            )

        # Saves video with bounding boxes
        video_out.write(image_b4_color)

    video_out.release()


print("Done!")We're done with the coding part of our tutorial. We now have a working computer vision model that identifies key features in a dial, a rudimentary alert monitor – a beep – and a way we can see our model on a video.
Run the Script
Run the script we made with a video in the input folder in your project folder. If you cloned the GitHub repository mentioned earlier, this folder will be called "To_Predict_Videos".
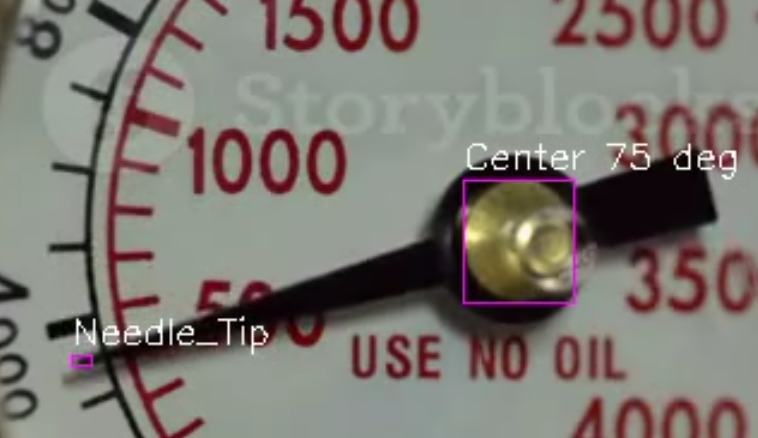
When we run the script, an annotated video is placed in the folder where predictions are placed (by default "Predicted_Videos"). This generated video should show the angle next to the “Center” label and box.
Calculate the PSI on a Dial
We know the angle of the needle, but this doesn't yet correlate with a value on our dial. Using the angle and manual readings of PSI, we can create an equation that finds the correlation between the angle of the dial and PSI.
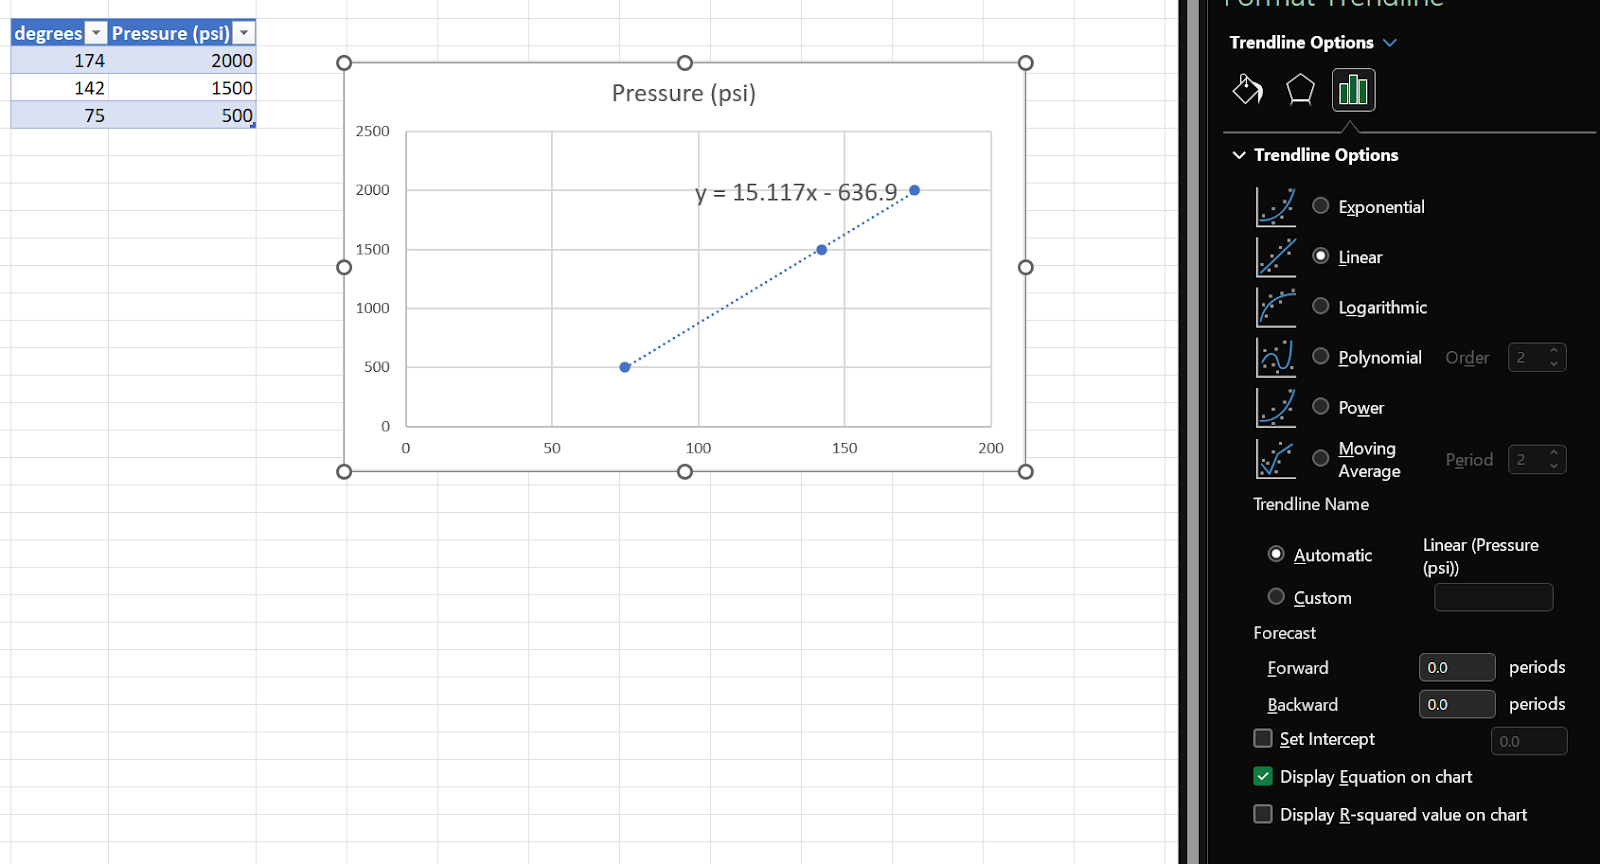
To do this, first record a few PSI measurements from the model and note the angle of the dial. Record this data in a spreadsheet program such as Excel or Google Sheets. We're going to use Excel below, but the same process is replicable in other spreadsheet software. Here's an example value of a reading we could take:
Let's create a table with a few different readings:
If you are using Excel, select the table created, click the “Insert” tab, add a scatter plot, right-click a data point on the plot, and select “Add Trendline.” Here Linear is chosen, and “Display Equation on the chart” is toggled. This will display a fitted equation to the data we entered:
Now we know how the angle of the needle tip and PSI correlate, we can update our script from earlier to use the formula we have calculated.
Below the line where we check for the "Center" in a label and add a Degree value to our gauge, add a statement that calculates the PSI. Here is how your code should look:
for label_index, label in enumerate(labels_found):
if "Center" in label:
labels_found[label_index] = label + " " + str(theta) + " deg"
# code to add
if "Needle_Tip" in label:
psi = int(15.21 * theta - 638.21)
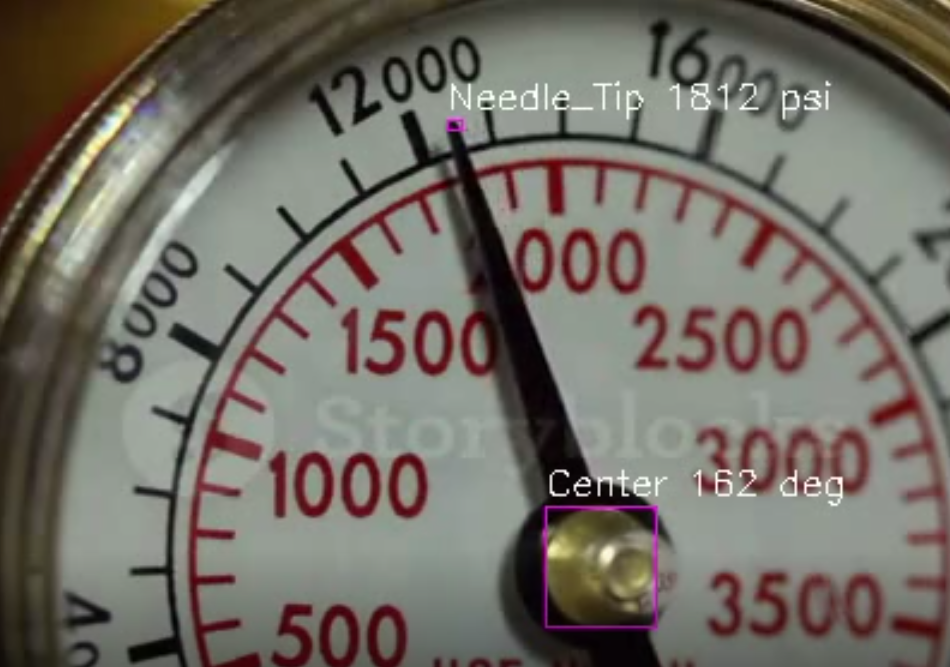
labels_found[label_index] = label + " " + str(psi) + " psi"Let's run our program again. When we do, we should see a PSI reading next to the needle tip. Now we no longer have the angle of the needle: we know what value it represents. That's great!
The photo below shows our new label on an image:
Conclusion
In this article, we have built and trained a computer vision model to recognize the center of a dial and the tip of the needle on a dial. We use that information to calculate the angle of the dial, and identify the correlation between the angle of the dial and the PSI displayed on the dial.
The model above is trained to work on a single type of dial. To deploy this code on multiple dials, you would need a system that saves the correlation between needle angle and reading to which cameras could refer when reading the dial.
Now you have the information and code you need to start reading dial values with computer vision!
Cite this Post
Use the following entry to cite this post in your research:
James Gallagher. (Nov 28, 2022). Turn Analog Dials into Digital Data with Computer Vision. Roboflow Blog: https://blog.roboflow.com/read-analog-dials-computer-vision/