
Selecting the right computer vision model for production starts with accurately measuring and comparing model performance. Evaluation metrics quantify a model’s capabilities, helping teams make informed decisions and choose models suited for real-world use. Among the many metrics available, Mean Average Precision (mAP) is a leading metric because it captures both detection accuracy and object localization.
To make meaningful comparisons, consistency is key: models must be evaluated using the same metric, with identical calculation methods, against the same test set, and under the same data processing and inference conditions. Without this alignment, comparisons can become misleading and ultimately unhelpful.
That’s why we built Verified Model Metrics in Roboflow. Now you’ll see unbiased evaluations, calculated using transparent and reproducible open-source code, using independent test sets, offering a clear picture of model performance.
This article will show you how to create verified metrics for your models and show an example.
Roboflow Verified Model Metrics
Going forward, Roboflow prioritizes unbiased evaluations using independent test sets, offering a clearer picture of real-world performance:
- Calculated using open-source code from Supervision, which reimplements COCO Evaluation for easier use.
- Fully transparent and reproducible.
- Reflective of real-world production scenarios.
In the Roboflow app, when those metrics are available, they are marked with the Roboflow Verified badge to indicate trusted, standardized evaluations. Additionally, you can toggle between standardized (Verified) metrics and provider-reported metrics for a clearer understanding of model performance:
- Toggle ON: Roboflow Verified (COCO Evaluation methodology, powered by supervision)
- Toggle OFF: Provider Self-Reported
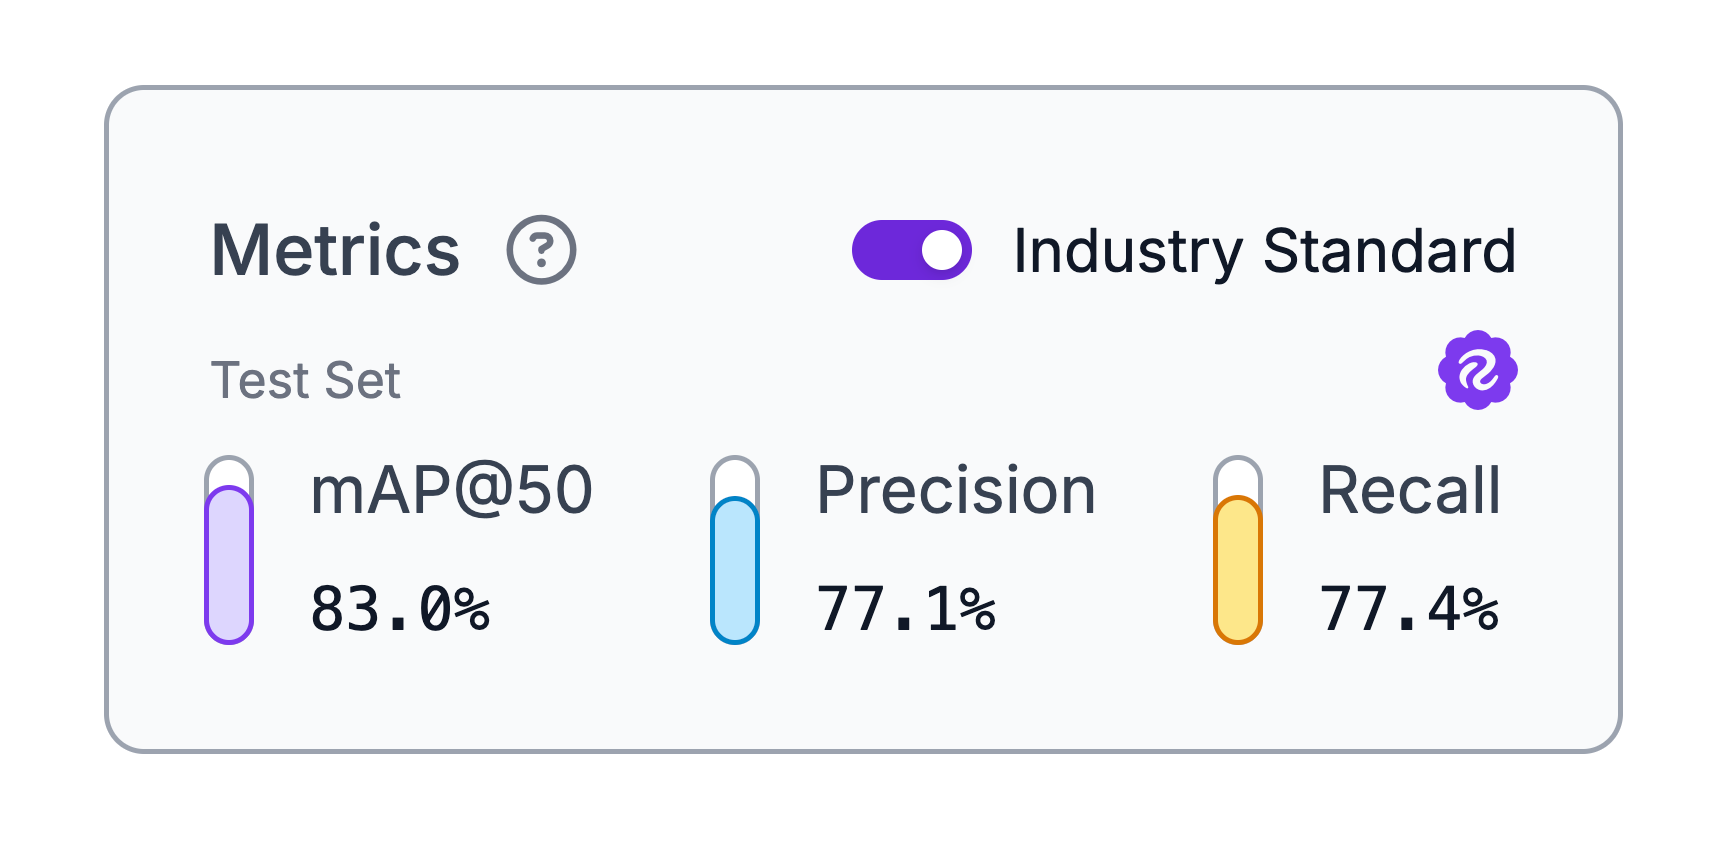
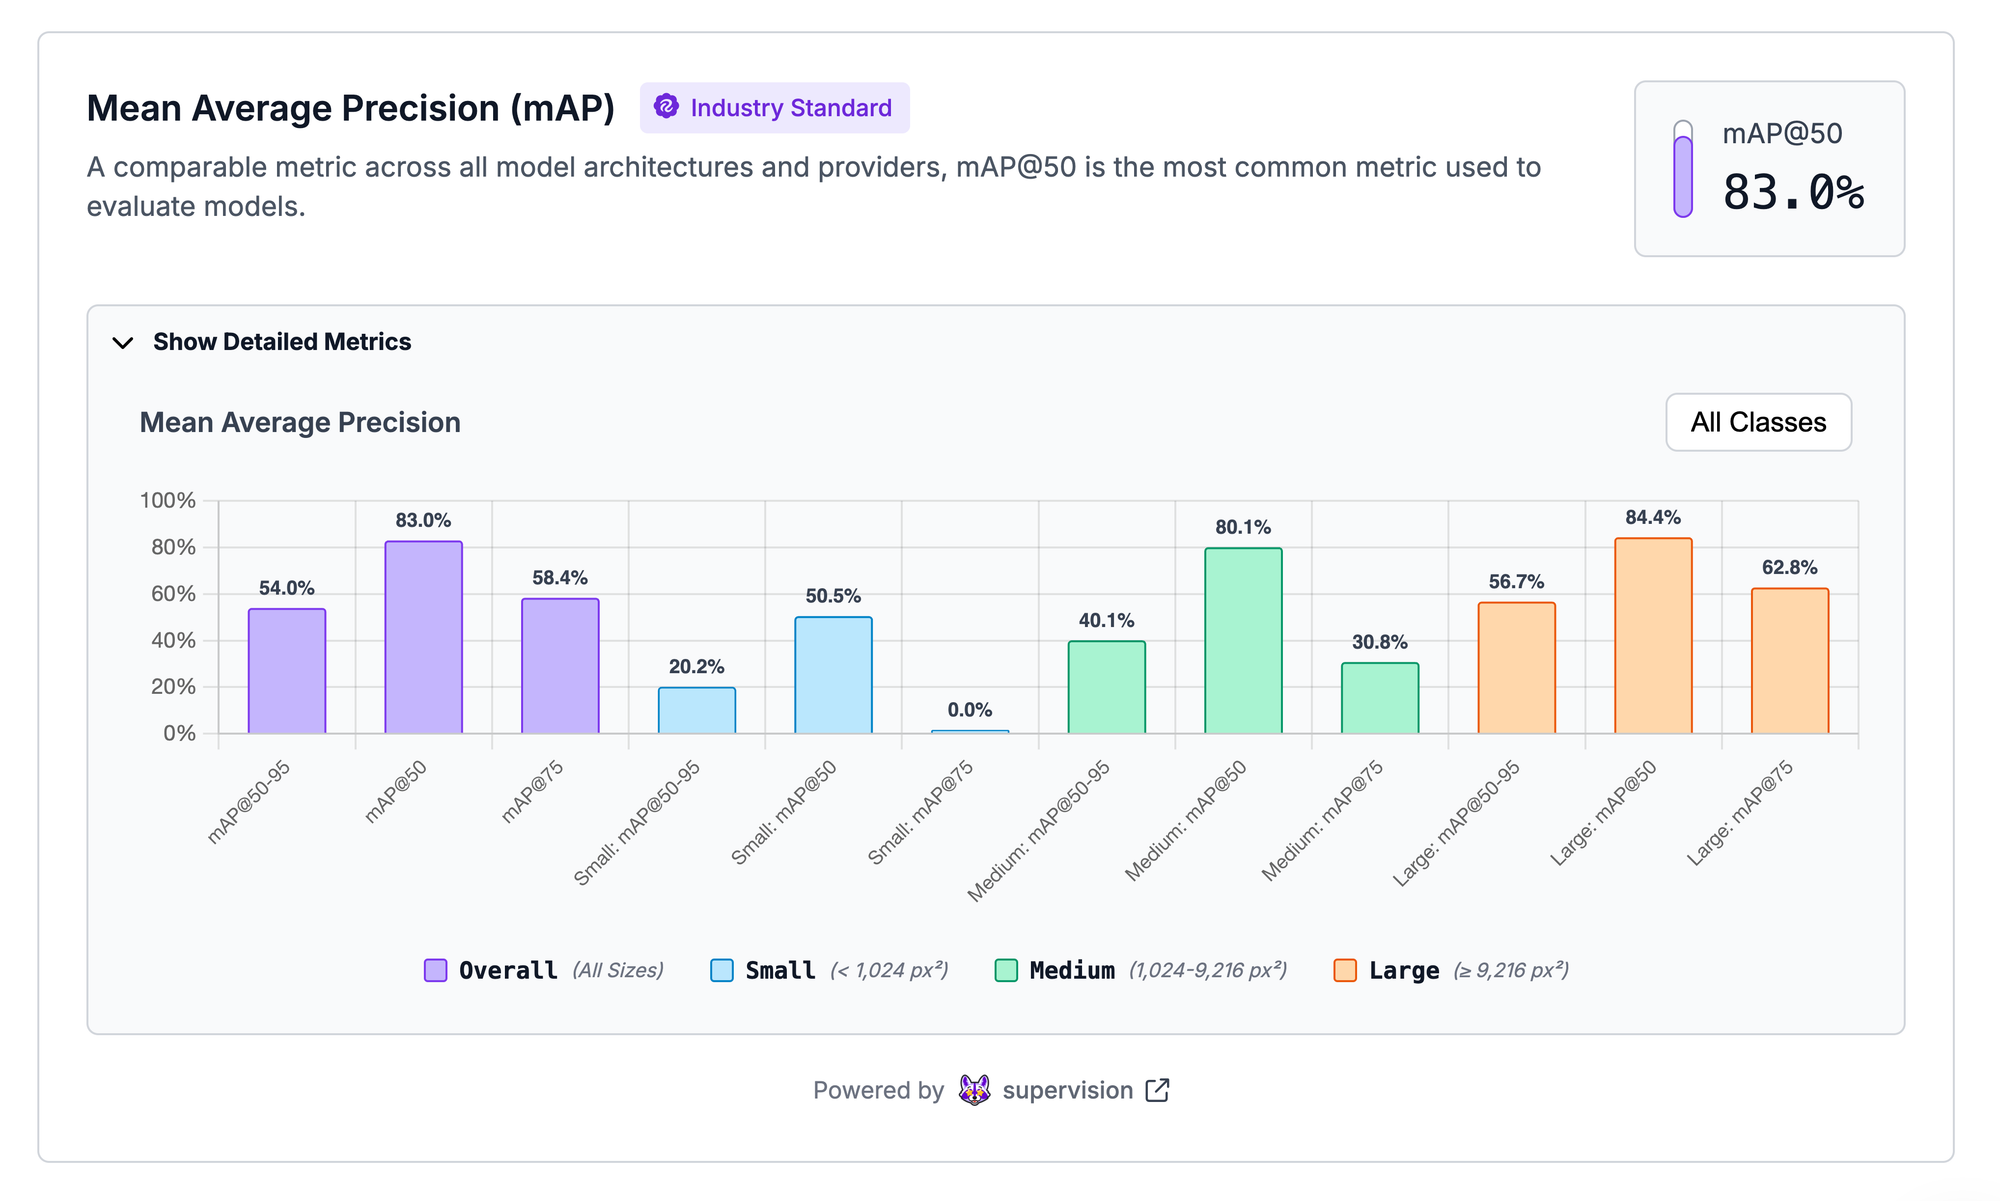
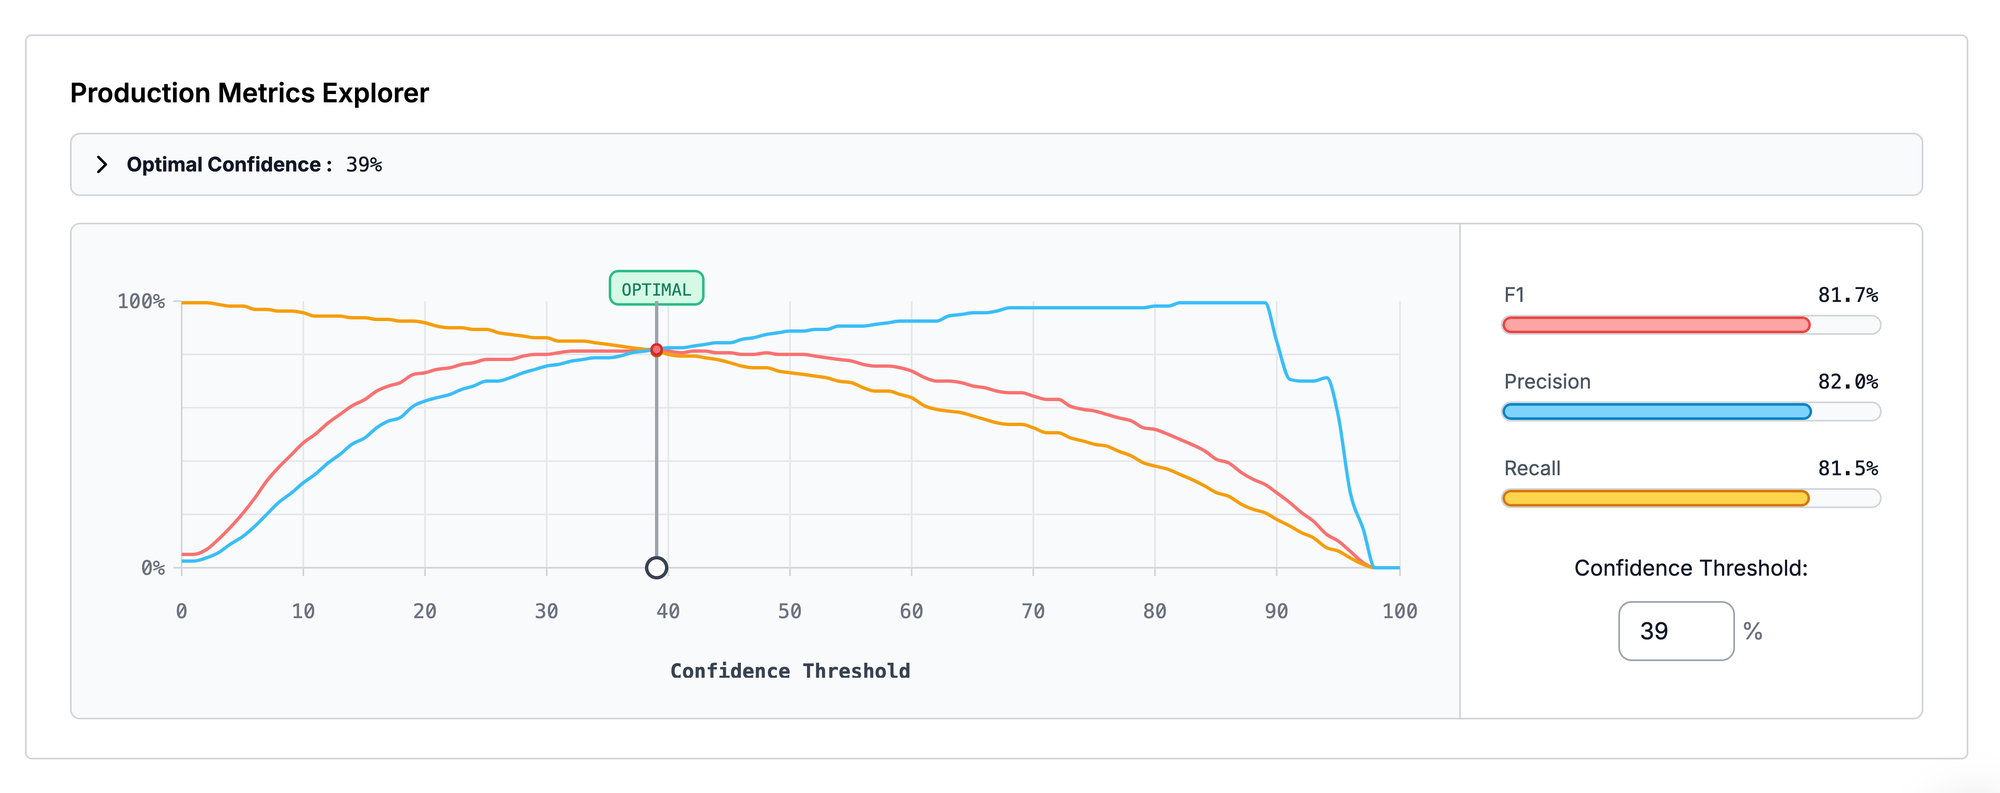
Roboflow also provides macro Precision, Recall and F1 on the best confidence level (the one that optimizes F1) across all classes, offering additional insights for imbalanced datasets or frequent false positives.
Macro precision and macro recall compute precision and recall for each class separately, then average them so every class counts equally. Macro F1 computes the F1 score (2PR/(P+R)) for each class and averages those F1s. A weak class drags these macro metrics down, which is especially useful on imbalanced datasets.
Why Standardized Metrics Matter
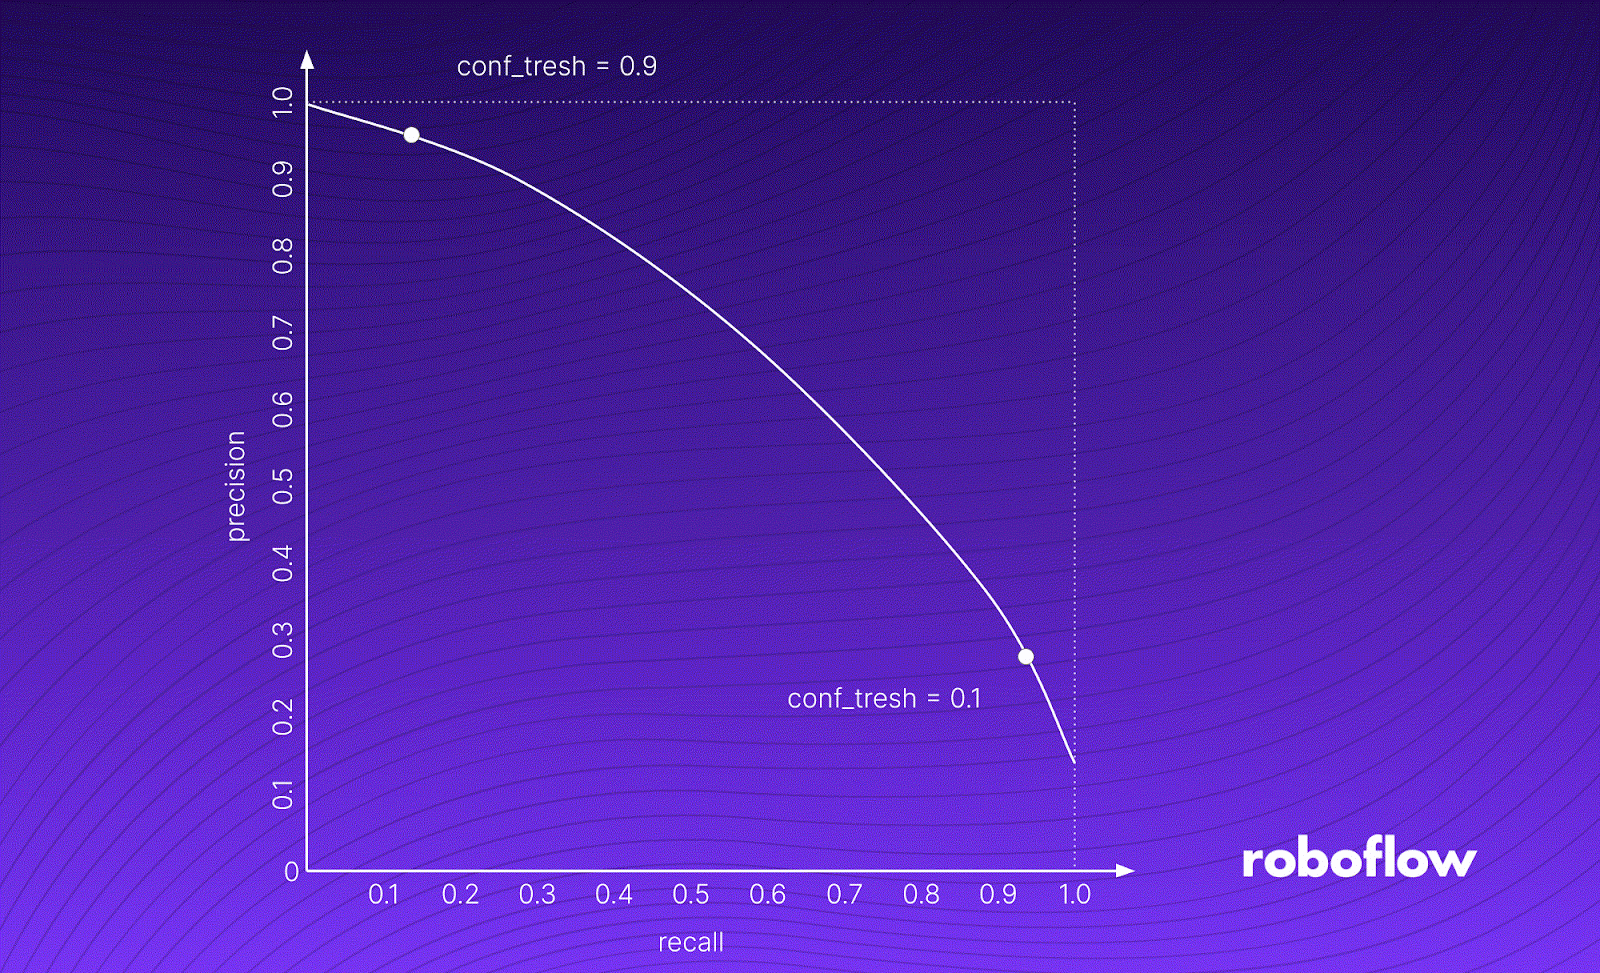
mAP evaluates how well a model detects and localizes objects by calculating precision across multiple Intersection-over-Union (IoU) thresholds, typically from 0.50 to 0.95, and then averaging the results. Higher mAP values indicate better detection and localization performance.
The mAP calculation is standard, although can be implemented incorrectly, and a helpful common comparison metric when choosing between models. See our explanation of mAP to go deeper on how it’s calculated.
Model performance can vary significantly depending on evaluation methodology. Without standardized metrics, comparisons between models are unreliable. The COCO Evaluation framework addresses this by ensuring evaluations are fair and consistent.
Introduced by Microsoft with the COCO dataset in 2014, the COCO Evaluation Framework quickly became the industry standard for benchmarking object detection models. The COCO dataset includes:
- 330K images (>200K labeled)
- 1.5 million object instances
- 80 object categories
This framework offers a rigorous, reproducible approach for evaluating detection models and is widely used across research and industry.
Recent research on the RF100-VL benchmark shows that improvements on COCO don’t always translate to real-world performance. For example, while YOLOv11 outperforms YOLOv8 on COCO, both perform nearly the same on RF100-VL — a dataset with fewer images but far more classes, created specifically to measure real-world performance rather than benchmark-specific gains. Even increasing model size only improves performance by about 2–3 mAP on RF100-VL, suggesting that many detectors are overfitting to COCO rather than truly generalizing.
How Unverified Metrics Are Causing Problems
Metrics reported on validation sets often appear overly optimistic because models are explicitly optimized for them. True performance evaluation requires independent test sets containing a diverse mix of images and scenarios that the model has not seen during training or validation.
Some models, such as those in the YOLO family, report metrics using evaluation settings that differ from production environments. For instance:
- Using larger input sizes (e.g., 672 pixels on the longest side) during validation.
- Applying slower, accuracy-enhancing Non-Maximum Suppression (NMS) only during validation.
- Evaluating with more detections (maxDets=300) compared to the COCO standard (maxDets=100).
While these practices can improve reported scores, they may not reflect actual production performance.
Evaluating Model Performance: Practical Example
Consider a real-world comparison for YOLOv11n performance on the COCO dataset:
This example underscores why standardized evaluations are critical for understanding true model performance.
How to Reliably Evaluate Your Own Models
Evaluating your datasets is simple with Supervision, which aligns perfectly with COCO Evaluation methodology using pycocotools. Supervision works seamlessly with YOLO and many other dataset formats, simplifying the evaluation process.
Going forward, Roboflow’s in-app training will use Supervision for evaluations by default, ensuring greater consistency and reliability.
Conclusion
Standardized metrics like mAP and COCO Evaluation enable fair, accurate model comparisons. Verified Model Metrics in Roboflow provide transparent insights into real-world performance and give you a consistent evaluation of your models.
By adopting standardized and verified metrics, you can confidently select the best computer vision models for production.
Cite this Post
Use the following entry to cite this post in your research:
Trevor Lynn. (Aug 1, 2025). Launch: Verified Model Metrics. Roboflow Blog: https://blog.roboflow.com/roboflow-verified-model-metrics/