

Shop floor data collection is the process of recording what happens during production: unit counts, cycle times, defects, changeovers, downtime, and safety events. You can automate it with cameras by pairing a custom RF-DETR model with Roboflow Workflows, which turn detections into timestamped, structured production records with evidence images.
Shop floor data collection is how a factory knows what actually happened during production. Most of that data is still entered by hand, so it arrives late, aggregated, and without the context needed to act on it.
This article explains what shop floor data collection involves, compares common collection methods, and shows how to automate shop floor data collection with cameras. We will build a custom RF-DETR model and a Roboflow Workflow that turns what a camera observes into timestamped, structured production records with evidence images attached.
What Is Shop Floor Data Collection?
Shop floor data collection is the process of recording what happens during production: how many units were completed, how long each production cycle took, when defects occurred, how long a changeover lasted, when a machine stopped, and whether required safety procedures were followed.
In most manufacturing plants, this information is collected through Manufacturing Execution System (MES) forms, production terminals, tablets, barcode scans, paper records, or operator-entered reason codes. This depends on someone noticing an event, interpreting it correctly, and entering it into a system.
That creates a potential gap between what physically happens on the line and what eventually appears in a report.
Cameras can close this gap because a camera already observes products moving, operators working, machines cycling, materials accumulating, defects appearing, and production states changing. With computer vision, those observations become structured shop floor data.
The important output of a computer vision model is a production record such as:
- Unit 4,281 crossed the completion point at 10:42:16.
- The time since the previous completed unit was 3.4 seconds.
- A damaged seal was observed on Line 2 during Work Order 5187.
- The packaging station remained blocked for 94 seconds.
- The first unit of the new SKU appeared 11 minutes after the previous SKU ended.
- A worker entered a controlled area without the required eye protection.
Shop Floor Data Collection Methods Compared
Most plants run several shop floor data collection methods at once. Each captures a different part of production, at a different cost, with a different failure mode.
The Cost of Collecting Shop Floor Data After the Fact
The main problem with manual shop floor data collection is not simply the time required to enter information in the system. The problem is that the resulting data may be delayed, incomplete, disconnected from its original context, or aggregated too early. Consider two common examples:
Delayed OEE Information
An operator may enter the total number of products manufactured, rejected units, downtime, and the reasons codes at the end of a shift. This information may later appear on an Overall Equipment Effectiveness (OEE) dashboard. But by then it may be too late for the production team to fix the problem. For example, a report may show that production slowed down between 11:00 a.m. and noon. However, it may not explain whether the slowdown was caused by:
- Products were moving farther apart on the conveyor.
- The conveyor stopped briefly several times.
- A station later in the production line was blocked.
- A manual assembly task was taking longer than usual.
- The line was being changed to produce a different product.
- Materials were building up in front of a machine.
- More defective products were being removed from the line.
Unexplained Scrap
Scrap is often recorded only as a total number for a shift, batch, or work order. This may be enough for accounting, but it does not always explain why the scrap occurred. For example, suppose 37 rejected packages are recorded during the afternoon shift. This number alone does not show whether:
- All 37 defects happened within five minutes.
- The problem slowly increased during the shift.
- The defects started immediately after a product changeover.
- Only one product variant was affected.
- The problem occurred at a particular machine position.
- The defects looked similar or were caused by different failure modes.
What Cameras Can Capture as Shop Floor Data
Cameras can do more than inspect products. They can collect different types of shop floor data from the same production area. A camera captures images or video and a vision model identifies important objects, activities, or conditions.
The business logic then decides when an observation should be recorded as a production event. The useful output is not a single image, video frame, or bounding box. It is a structured event record that can be stored, analyzed, and used to understand production performance over time.
Counts and Throughput
A detection count is not automatically a production count. If a product appears in 20 consecutive video frames, a model may detect it 20 times. The shop floor record should still represent one physical unit. A production counting pipeline therefore needs an event boundary.
A common boundary is a virtual line placed across the conveyor after the final operation. The system tracks each unit and creates an event only when its unique track crosses that line in the permitted direction. The resulting event might contain:
- Event ID.
- Completion timestamp.
- Product class.
- Tracker ID.
- Line and station identifiers.
- Camera identifier.
- SKU or work order.
- Shift.
- Model version.
- Evidence image.
Individual events can then be aggregated into units per minute, units per hour, total shift output, or output by product variant.
Cycle Times
A camera can measure more than one type of cycle time. The system must first define which operational interval matters. For a simple conveyor with evenly completed products, cycle time may be measured as the time between two consecutive completion events:
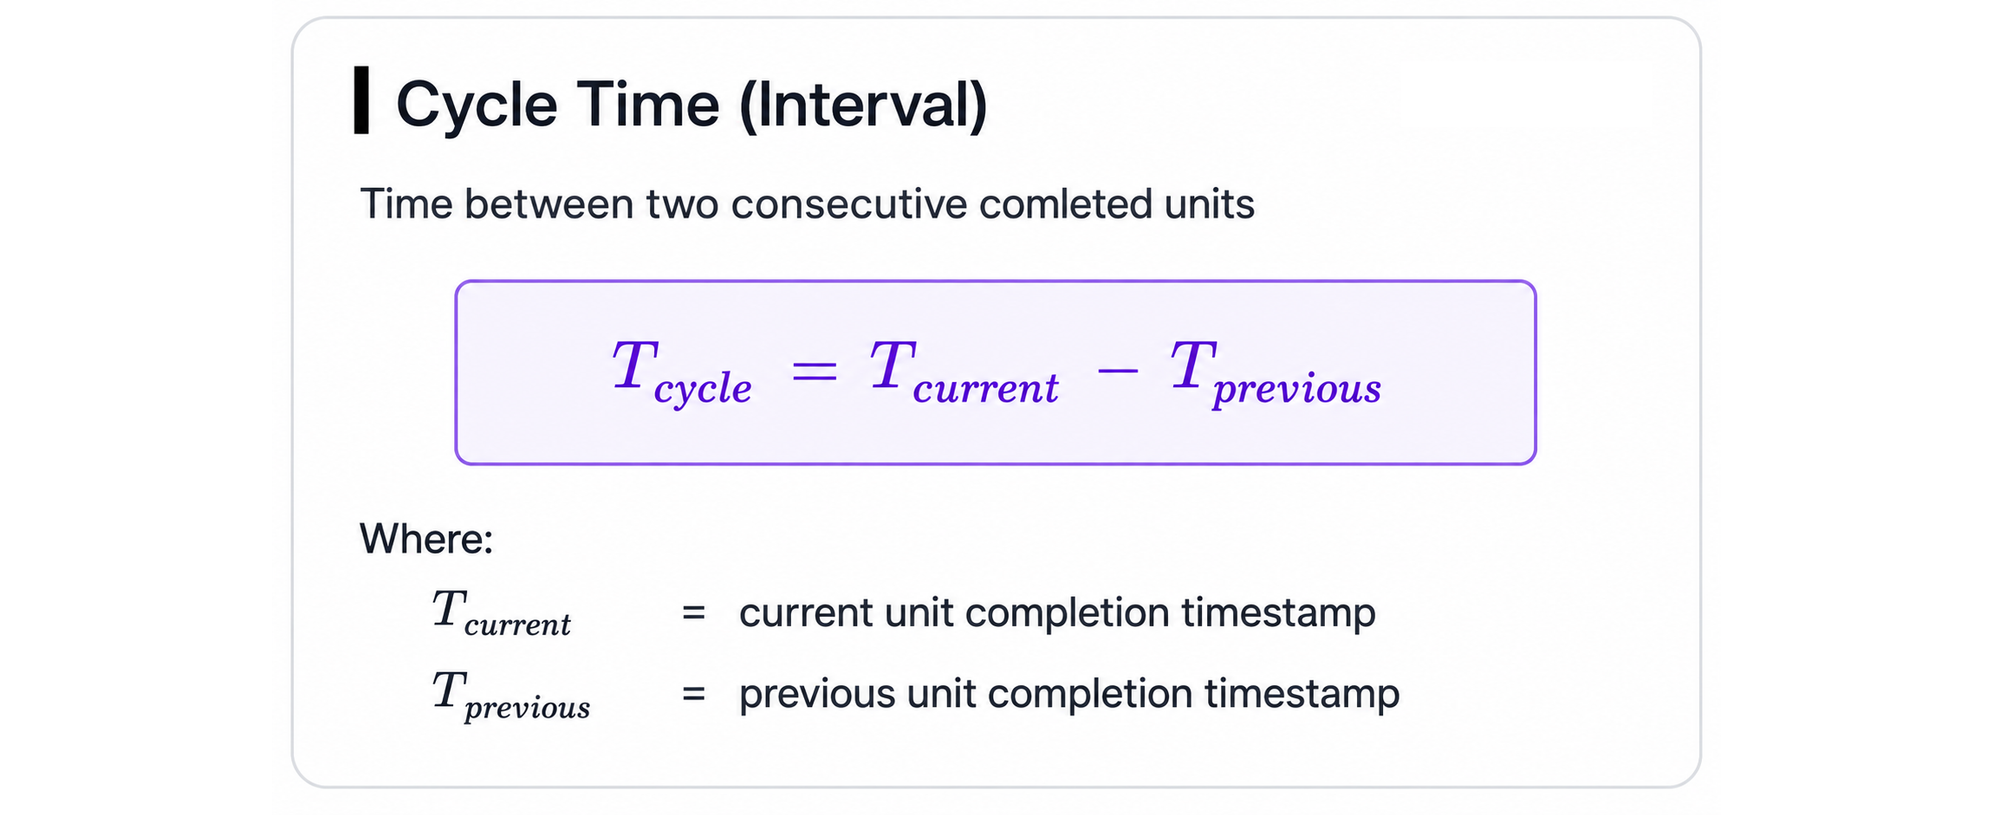
This represents the rate at which completed units leave the observed process. It is often useful for identifying slowing output, irregular spacing, micro-stoppages, or accumulating delays. For a station-level process, cycle time is measured between an entry boundary and an exit boundary. The camera observes the following sequence.
- A product enters the station.
- The station performs the operation.
- The product leaves the station.
- The elapsed time becomes the station cycle duration.
The camera can also measure how long a product remains inside a defined area. This is useful for manual workstations, inspection cells, filling operations, loading areas, and other processes where the relevant question is dwell time rather than conveyor speed.
A cycle event should include both the duration and its context. A value of 18 seconds is more useful when it is associated with the product type, station, work order, operator team, shift, and evidence frame.
Defect Occurrences
A quality-inspection model may return several predictions for every frame. Shop floor data collection should convert those predictions into one defect occurrence per affected unit or inspection cycle. For example, suppose a model detects a damaged package seal. The Workflow can:
- Associate the defect with the tracked package.
- Confirm that the confidence or business threshold has been met.
- Prevent the same package from generating repeated events.
- Attach the defect class and model confidence.
- Save the original and annotated images.
- Add the line, product, shift, batch, and work-order metadata.
- Create a defect event.
- Route the result to a quality system or operator interface.
The record can be used to calculate defect rates, identify recurring defect types, locate periods of process instability, and review questionable predictions.
Changeover Duration
Changeovers are often recorded using a manually entered start time and completion time. A camera can add independently observed milestones. For example:
- The final acceptable unit of SKU A crosses the completion point.
- No product is completed for a period.
- Setup activity takes place.
- The first unit of SKU B enters the line.
- The first acceptable unit of SKU B crosses the completion point.
- Stable production of SKU B begins.
These milestones support several changeover measurements:
- Last good unit to first new unit.
- Last good unit to first acceptable new unit.
- First new unit to stable production rate.
- Total time with no completed output.
Safety and PPE Events
Safety applications should also produce events rather than continuous streams of person detections. A PPE Workflow might create a record only when all relevant conditions are satisfied:
- A person is inside a controlled zone.
- A required item is not detected.
- The condition persists beyond a short validation period.
- The event is not already active.
- The camera and zone are approved for this use.
Machine-State Data
Many machine states have visual effects even when the machine does not expose the required telemetry. A camera may observe:
- Whether products are moving.
- Whether material is accumulating.
- Whether the infeed is empty.
- Whether the outfeed is blocked.
- Whether a press or actuator is cycling.
- Whether a stack light has changed.
- Whether an access door is open.
- Whether an operator is intervening.
- Whether a machine display shows a particular state.
Workflow logic can combine these observations over time to classify a visible operating state such as:
- Running.
- Idle.
- Starved.
- Blocked.
- Changeover.
- Manual intervention.
- Unknown.
The unknown state is important. A camera can report what is visually supported, but it should not invent an internal fault condition that cannot be confirmed from the image. When PLC tags are available, visual state data can supplement rather than replace them. The camera may show that material has accumulated in front of a machine while the PLC provides the machine’s internal fault code. Combining both sources creates a more complete production record.
How Vision-Based Shop Floor Data Collection Works
A practical vision-based data collection pipeline can be represented as:
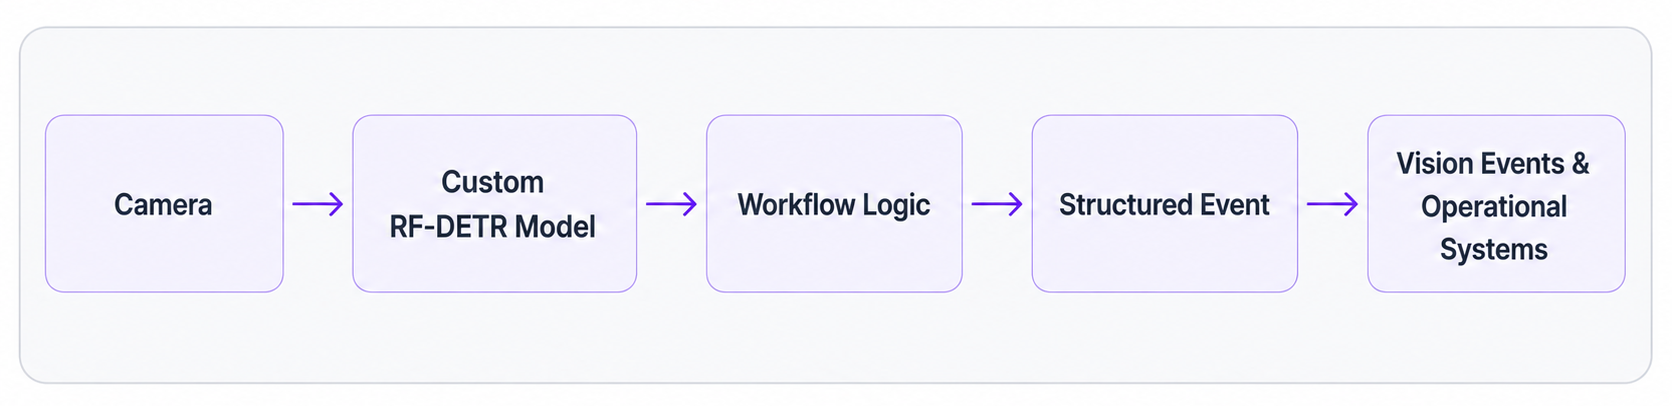
Each stage has a different responsibility.
1. The Camera Observes the Operational Boundary
The camera should be positioned around the production question being measured. For example:
- For unit counting, it should clearly observe a point that every completed unit must cross.
- For cycle measurement, it may need to observe the entry and exit of a station.
- For changeovers, it should capture enough product detail to distinguish the previous SKU from the next one.
- For machine-state monitoring, it may need to show material flow, moving machine elements, status indicators, or the interaction between adjacent stations.
The best camera position is therefore not always the position that shows the largest area. It is the position that makes the event boundary unambiguous. Consistent lighting, focus, exposure, and mounting are also part of data quality.
2. A Custom RF-DETR Model Converts Images into Domain Observations
A custom RF-DETR model identifies the visual concepts required by the application. Depending on the project, the model may be trained to recognize:
- Completed products.
- Different product variants.
- Defect categories.
- Required components.
- People and PPE.
- Machine positions.
- Containers, pallets or packages.
- Material accumulation.
- Relevant process states.
The classes should be designed around the events the operation needs to record. For example, a generic class called box may be sufficient for a basic counting application. A changeover application may instead require sku_a_box, sku_b_box, setup_sample, and production_unit. A quality application may require separate classes for acceptable units and specific defect types. RF-DETR supplies the visual observations. It does not by itself determine which observations should become shop floor records.
3. Roboflow Workflows Applies the Event Logic
Roboflow Workflows connects the model to the temporal and operational logic that turns predictions into usable data. A Workflow can combine model inference with object tracking, line crossing, zone analysis, detection filtering, logic and branching, object counting, property generation, prediction storage, and external integrations. Workflows can be deployed through Roboflow-managed infrastructure or run on supported edge hardware through Roboflow Inference. The Workflow answers questions that a detector cannot answer alone:
- Has this physical unit already been counted?
- Did it cross the correct boundary?
- Was it moving in the permitted direction?
- How long did it remain in the station?
- Is the condition persistent or visible in only one frame?
- Does the observation meet the quality rule?
- Which production metadata should be attached?
- Should the event be stored, sent, displayed, or ignored?
This is where frame-level predictions become event-level data. A Workflow for production counting might perform the following operations:
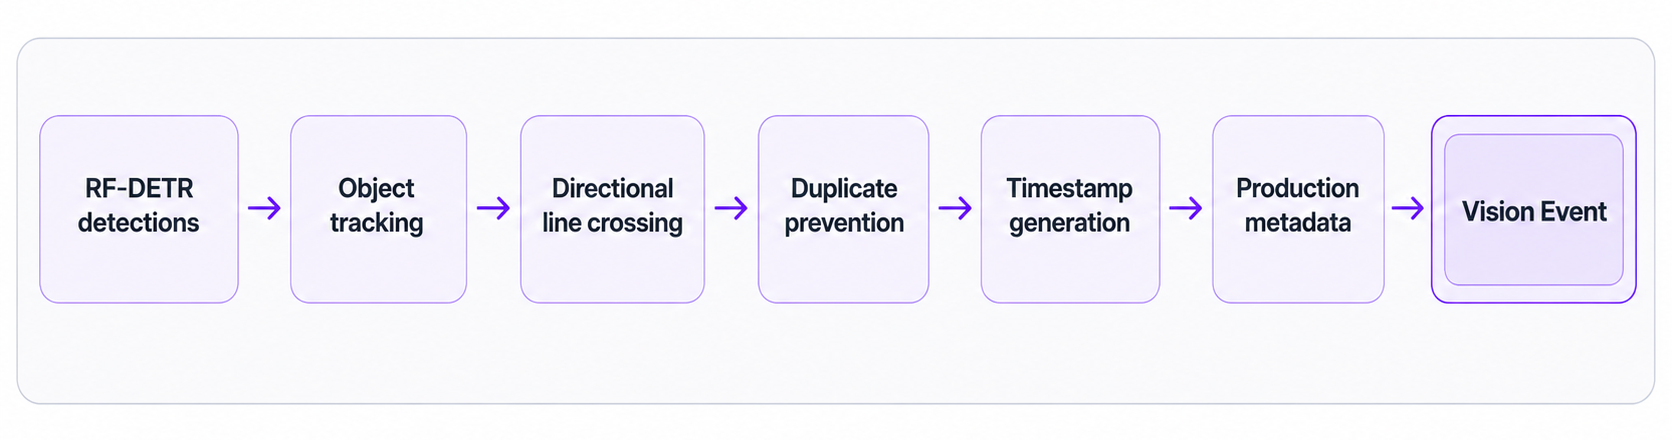
A quality inspection workflow might use a different structure:
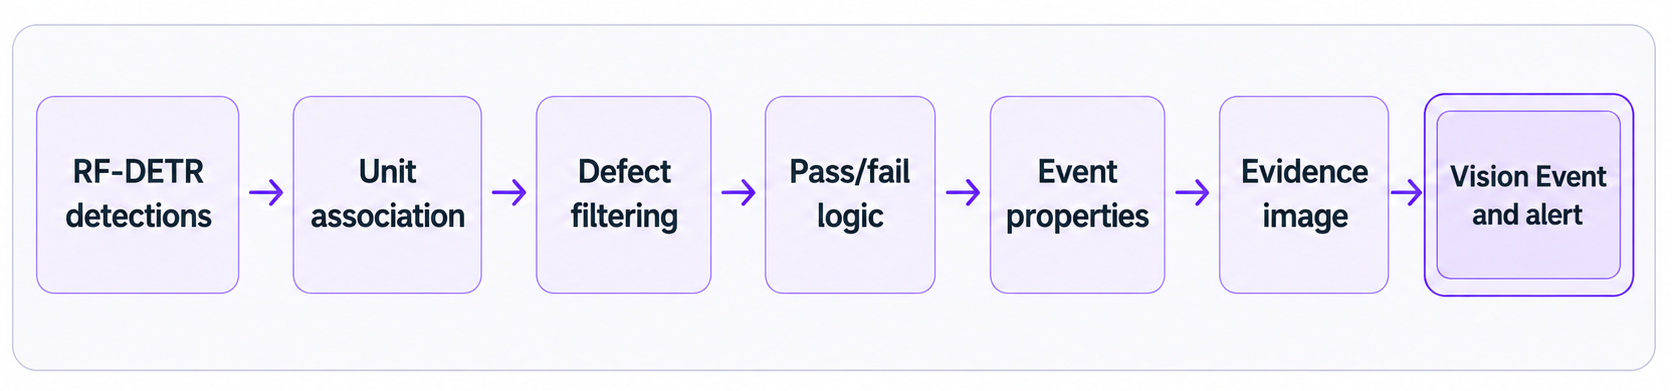
The model can remain the same while the event logic changes according to the operational requirement.
4. The Workflow Creates a Structured Event
A structured event is a compact record of an occurrence that matters to the operation. Take the following example:
{
  "event_id": "line2-unit-4281",
  "event_type": "unit_completed",
  "event_time": "2026-08-05T10:42:16.214+05:30",
  "facility_id": "plant-001",
  "line_id": "line-2",
  "station_id": "packaging-exit",
  "camera_id": "camera-07",
  "product_class": "sealed_carton",
  "production_sequence": 4281,
  "tracker_id": 37,
  "cycle_interval_seconds": 3.4,
  "shift": "A",
  "work_order": "WO-5187",
  "sku": "CTN-500-B",
  "model_version": "carton-flow/7",
  "image_reference": "vision-event-image-reference"
}
A defect event could use the same overall structure while adding fields such as:
{
  "event_type": "quality_defect",
  "defect_class": "damaged_seal",
  "quality_status": "fail",
  "confidence": 0.94,
  "disposition": "pending_review"
}
A reliable event schema should include several categories of information:
- Identity: A unique event ID that downstream systems can use to prevent duplicate records.
- Time: The time the physical event occurred, not only the time it was later inserted into a database.
- Source: The facility, line, station, camera, Workflow, and model version that produced the event.
- Subject: The product, tracked object, batch, SKU, or person-related safety condition associated with the event.
- Measurement: The count, duration, state, defect class, or other operational value.
- Context: The shift, work order, lot, recipe, production mode, or changeover identifier.
- Evidence: An original or annotated image that allows the event to be verified.
The schema should be defined before the team builds the dashboard. The central design question is:
What record must exist after the physical event is no longer visible?
5. Vision Events Stores the Visual Record
Roboflow Vision Events can serve as the vision system of record: the durable layer that stores what deployed vision applications observed. Vision Events can retain model predictions, input or output images, timestamps, device information, and application-specific metadata in a searchable location. Events can be sent from a Workflow, created through the API, or synchronized from supported edge deployments. This does not mean Vision Events must replace the MES, historian, quality management system, or ERP. Instead, it preserves the visual observation and its evidence while downstream systems receive the fields relevant to their responsibilities. For example:
- Vision Events stores the defect image, prediction, line, SKU, confidence, model version, and review status.
- The MES receives a failed-unit or production-completion transaction.
- The historian receives cycle-time and machine-state values.
- The quality system receives the defect category and disposition workflow.
- The PLC receives the immediate pass, fail, hold, or reject signal.
- A spreadsheet receives pilot-stage event rows for initial analysis.
Vision Events makes it possible to move from an aggregated number back to the events and images that produced it. It also provides a central view across cameras, production lines, facilities, and regions, with filtering based on event metadata.
Worked Example: Count Conveyor Units and Log Cycle Times
Consider a conveyor carrying sealed cartons away from a packaging station. A camera is positioned above the conveyor exit, where every completed carton passes through the same visible area. See the illustration in following video:
Product packaging
The production team wants to collect:
- The number of completed cartons.
- The video timestamp at which each carton completes the process.
- The cycle time between consecutive completed cartons.
- Average and median cycle time.
- Estimated production rate in units per minute and hour.
- The number of unusually slow cycles.
- Evidence images for completed units and slow-cycle events.
- Production context such as line, station, shift, SKU, and work order.
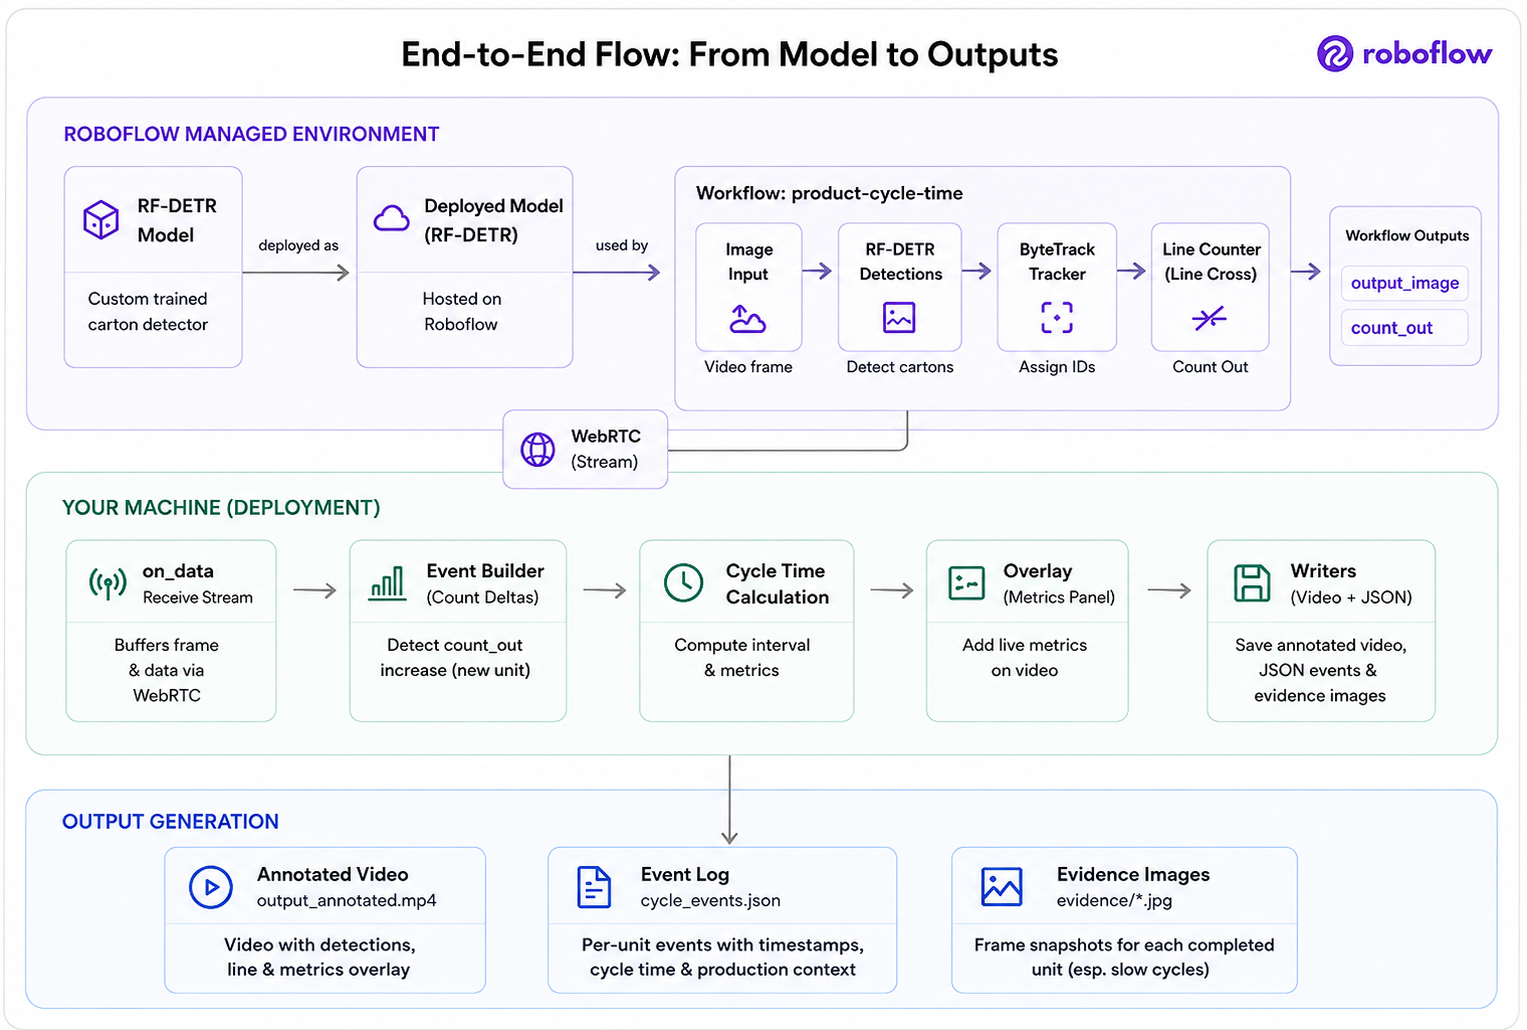
This example uses a Roboflow Workflow to detect, track, count, and visualize the cartons. A separate Python deployment application processes a recorded video, calculates the cycle time, updates a JSON event log, saves evidence images, and creates an annotated output video.
Workflow Structure
The Workflow contains the following blocks:
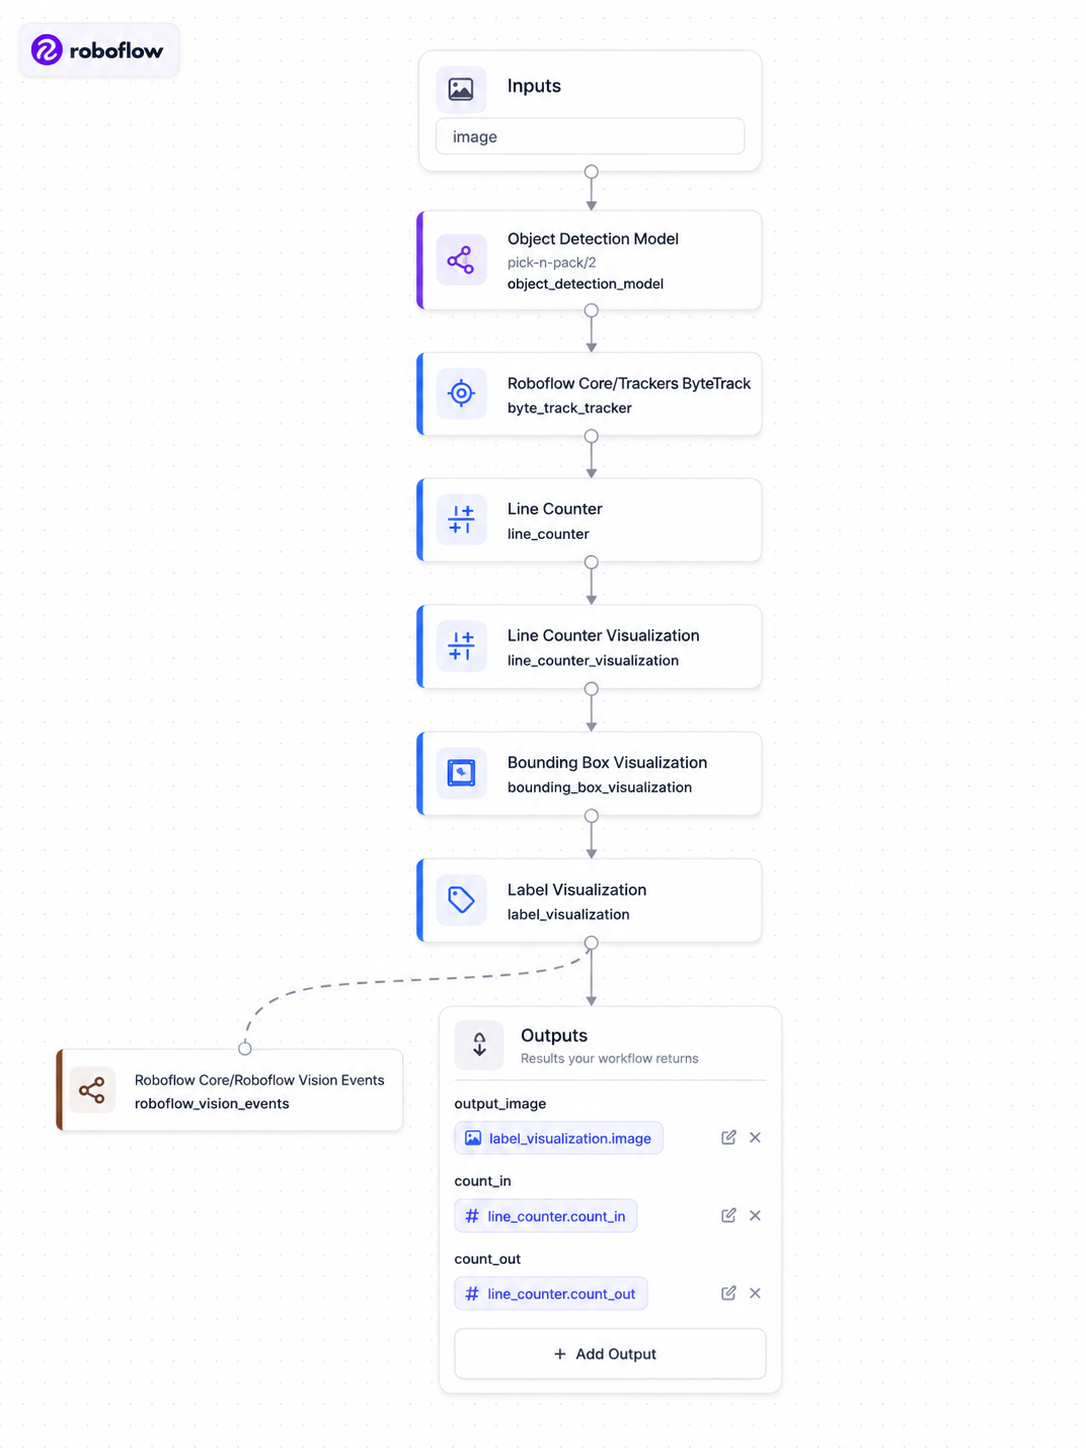
The final Workflow results are sent to:
- Vision Events, for storing selected visual observations.
- Workflow Outputs, which return:
output_imagecount_out
The Line Counter is configured so that a carton moving through the completion line in the production direction increases count_out. The deployment application therefore uses only count_out. The Workflow handles the visual processing, while the deployment application handles the cycle-time calculation and local event logging.
Detect and Track Each Carton
The custom RF-DETR model detects cartons in each video frame. A carton remains visible across many consecutive frames. Counting every detection would therefore count the same carton several times. The ByteTrack Tracker solves this problem by assigning a temporary tracking identity to each carton and maintaining that identity while the carton moves through the camera view. The tracking identity is local to the video. It does not need to be the product’s official serial number. Its purpose is to help the Line Counter recognize that detections in several frames belong to the same physical carton. This allows the Workflow to count a carton once when it crosses the defined line instead of once per frame.
Define the Completion Event
A carton is treated as completed when its tracked position crosses the virtual line at the conveyor exit in the configured direction. When this happens, the Workflow increases the cumulative count_out value:
Before crossing: count_out = 7
After crossing: count_out = 8
The deployment application compares the current count_out value with the value from the previous frame. An increase of one means that one new carton has crossed the completion line. The application then creates a new unit_completed event. A carton does not create an event simply because it is visible. It must cross the configured line in the correct direction. A carton that remains near the line for several frames should still increase the count only once. This provides a clear and repeatable definition of production completion:
A completed unit is a uniquely tracked carton that crosses the configured exit line and increases count_out.Process the Recorded Video
The deployment application uses VideoFileSource to send the recorded video to the Workflow. Real-time processing is disabled so that the system can buffer and process every video frame rather than attempting to match the original playback speed. For every processed frame, the application receives:
output_image
count_out
output_image contains the Workflow visualizations, including the line counter, bounding boxes, and labels. The application decodes this image, adds a compact shop floor metrics panel, displays it in an OpenCV window, and writes it to an annotated output video. count_out contains the cumulative number of cartons that have crossed the completion line. Roboflow’s WebRTC video interface supports video files as an input source and can return Workflow outputs through the data channel during processing.
Calculate the Cycle Time
For a recorded video, the application uses the frame’s position in the source video rather than the computer’s processing time. The preferred timestamp is calculated from the video metadata:
Video timestamp = presentation timestamp × time baseIf this metadata is unavailable, the application uses:
Video timestamp = frame ID ÷ source video FPSWhen count_out increases, the application stores the corresponding video timestamp as the completion time of that carton. The cycle interval is then calculated as:
Cycle interval = Current completion time − Previous completion time
Suppose the application records these two events:
Carton 7 completed at 00:00:24.258
Carton 8 completed at 00:00:27.661
The cycle interval for Carton 8 is:
27.661 − 24.258 = 3.403 secondsThe event for Carton 8 therefore receives:
{
  "event_type": "unit_completed",
  "count_out": 8,
  "video_timestamp": "00:00:27.661",
  "cycle_interval_seconds": 3.403
}
The first completed carton does not have a cycle interval because there is no previous carton with which to compare it. Its cycle status is recorded as first_unit.
Create a Record for Each Unit
Each time count_out increases, the application creates a structured JSON record for the completed unit. A simplified record looks like this:
{
  "event_id": "line-2-unit-000008-frame-829",
  "event_type": "unit_completed",
  "event_time_utc_processed": "2026-08-05T05:12:18.902Z",
  "video_timestamp_seconds": 27.661,
  "video_timestamp": "00:00:27.661",
  "frame_id": 829,
  "direction": "out",
  "production_sequence": 8,
  "count_out": 8,
  "cycle_interval_seconds": 3.403,
  "cycle_status": "normal",
  "slow_cycle_threshold_seconds": 6.0,
  "instantaneous_units_per_minute": 17.631,
  "line_id": "line-2",
  "station_id": "conveyor-exit",
  "shift": "A",
  "sku": "CTN-500-B",
  "work_order": "WO-5187",
  "product_name": "sealed_carton",
  "evidence_image_path": "shop_floor_cycle_data/evidence/line-2-unit-000008-frame-829.jpg"
}
The event contains two different types of time information:
video_timestampshows when the carton crossed the line within the source video.event_time_utc_processedrecords when the deployment application processed and saved the event.
For cycle-time measurement, the video timestamp is used because processing speed may be faster or slower than the original video playback speed.
Calculate Production Metrics
As more cartons cross the line, the application uses the event history to calculate:
- Latest cycle time.
- Average cycle time.
- Median cycle time.
- Minimum cycle time.
- Maximum cycle time.
- Cycle-time standard deviation.
- Estimated units per minute.
- Estimated units per hour.
- Number of slow cycles.
- Percentage of cycles above the slow-cycle threshold.
The estimated production rate is calculated from the average cycle time:
Units per minute = 60 / Average cycle time in secondsFor example, if the average cycle time is four seconds:
60 / 4 = 15The estimated production rate is therefore 15 cartons per minute. Median cycle time is shown alongside the average. A small number of long interruptions can increase the average, while the median better represents the cycle time experienced by a typical unit.
Display the Results on the Video
The deployment application adds a compact metrics panel to each output frame using colors from the Supervision Roboflow palette. Each field appears on a separate line:
SHOP FLOOR METRICS

Video time          00:00:27.661
Completed units     8
Latest cycle        3.403 s
Average cycle       3.403 s
Median cycle        3.403 s
Production rate     17.63 units/min
Slow cycles         0
Status              Normal
The panel uses shades from the Roboflow palette so labels and values are easy to separate at a glance. The status row changes shade depending on whether the latest cycle was normal, slow, or unavailable. The processed frames are written to:
output_annotated.mp4This produces a reviewable video containing the original Workflow annotations together with the calculated production metrics.
Record Slow-Cycle Exceptions
The deployment code defines a configurable slow-cycle threshold:
SLOW_CYCLE_SECONDS = 6.0Suppose one carton crosses the line at 00:00:41.273 and the next carton crosses at 00:00:58.273. The cycle interval is:
58.273 − 41.273 = 17.000 secondsBecause 17 seconds is greater than the six-second threshold, the event is marked as slow:
{
  "event_type": "unit_completed",
  "count_out": 13,
  "frame_id": 1746,
  "video_timestamp": "00:00:58.273",
  "cycle_interval_seconds": 17.0,
  "cycle_status": "slow",
  "slow_cycle_threshold_seconds": 6.0,
  "instantaneous_units_per_minute": 3.529
}
The application also saves the Workflow-annotated frame associated with the event. The evidence image may show:
- A large gap between cartons.
- Material building up before a machine.
- An empty conveyor infeed.
- An operator intervention.
- A carton stopped near the completion point.
- A blocked downstream station.
The evidence image does not automatically identify the root cause. It preserves the visible production context so that an engineer or operator can investigate the event.
Keep the JSON File Updated
The application maintains one JSON document throughout video processing. It is updated whenever:
- A new carton crosses the line.
- A Workflow error occurs.
- A configured number of frames has been processed.
- Video processing finishes.
The JSON document contains:
Session information
Production metadata
Current summary
Warnings
Individual unit events
Atomic file writing is used so that another dashboard or application does not read a partially written JSON file while an update is in progress. The output folder is organized as:
shop_floor_cycle_data/
├── output_annotated.mp4
├── product_cycle_events.json
└── evidence/
    ├── line-2-unit-000001-frame-115.jpg
    ├── line-2-unit-000002-frame-218.jpg
    ├── line-2-unit-000008-frame-829.jpg
    └── ...
This structure provides both aggregated production metrics and the individual records from which those metrics were calculated.
Handle Production Edge Cases
A conveyor-counting application should also handle conditions that do not appear in a simple demonstration.
- The first unit has no cycle time: The first crossing establishes the starting timestamp. Cycle time begins with the second completed unit.
- Two units cross in one frame: If
count_outincreases by more than one in a single frame, the application knows that several units crossed but does not know their individual sub-frame timestamps. It creates the unit records but sets their individual cycle intervals tonullrather than recording inaccurate zero-second values. - The counter resets: If
count_outbecomes smaller than its previous value, the application records a counter-reset warning and clears the previous completion timestamp. This prevents a false cycle interval from being calculated across two counting sessions. - Temporary occlusion: A carton may briefly disappear behind another carton or part of the machine. The tracker should reconnect the detections to the same physical carton when possible.
- Stopped cartons: A carton may remain close to the line for several frames. It should create only one completion event.
- Side-by-side cartons: Two cartons may reach the line at nearly the same time. The detector and tracker must maintain separate identities.
- Removed cartons: A carton taken off the conveyor before reaching the line should not be recorded as completed.
- Product recirculation: A unit returning through the camera view after inspection or rework may require additional logic to prevent it from being counted as a new completed unit.
- Camera or Workflow interruption: A missing result should not automatically be interpreted as zero production. In the current deployment application, if one frame does not contain
count_out, the most recent valid value is retained.
These cases show why an accurate object detector alone is not enough. Reliable shop floor data also depends on tracking, line configuration, event definitions, timestamp handling, and duplicate prevention.
Store and Route the Results
The current implementation creates two related records. First, the Workflow can use its Vision Events block to store selected visual observations. Vision Events is designed to retain important model or Workflow events together with visual information and custom source or production metadata. Second, the deployment application stores the calculated cycle-time records locally in product_cycle_events.json. This local record contains fields calculated outside the Workflow, including:
- Video completion timestamp.
- Cycle interval.
- Cycle status.
- Estimated production rate.
- Shift, line, SKU, and work order.
- Evidence-image path.
In the current implementation, the cycle-time fields are not automatically added to the Vision Event created inside the Workflow. To store the calculated cycle interval in Vision Events as well, the deployment application could send the completed JSON event through the Vision Events API as custom metadata. Roboflow Vision Events supports custom metadata such as line, shift, part number, and other use-case-specific fields. The same JSON records can later be forwarded to:
- An MES endpoint through an API or webhook.
- An industrial data platform.
- A quality-management system.
- A production dashboard.
- A spreadsheet during an initial pilot.
- A PLC integration service when an immediate machine response is required.
Output of Count Conveyor Units and Log Cycle Times workflow
Getting Shop Floor Data Where It Needs to Go
A computer vision system becomes operationally useful when its events arrive in the systems where production teams already work. Different systems need different parts of the event.
Vision Events Dashboards
Vision Events provides the visual operational layer. Teams can use it to review:
- Event volume over time.
- Production counts.
- Pass and fail trends.
- Defect categories.
- Events from a particular camera or line.
- Results associated with a specific SKU, lot or work order.
- Images from slow-cycle periods.
- Events that require operator review.
- Differences between sites or shifts.
The value of this dashboard is that the trend and its underlying visual evidence remain connected. A defect-rate spike is not only a point on a chart. It can be opened as a collection of defect events with images and metadata. A cycle-time increase can be traced to the completion records generated during that period. Vision Events also exposes APIs for querying event data, making it possible to create application-specific dashboards or integrate the records into broader analytics environments.
MES
The MES usually needs production transactions and process context rather than full model outputs. Relevant events may include:
- Unit completed.
- Unit rejected.
- Inspection passed.
- Inspection failed.
- Operation started.
- Operation completed.
- Changeover started.
- First acceptable unit produced.
- Line became blocked.
- Line resumed.
The MES payload should contain a stable event ID so retries do not create duplicate production records. It should also use the event occurrence time rather than only the integration receipt time. This is especially important when the network is temporarily unavailable and events are delivered later.
Historian or Time-Series Platform
A plant historian is well suited to measurements that change over time. Vision events can be transformed into tags or time-series values such as:
- Current units per minute.
- Latest cycle interval.
- Rolling median cycle time.
- Number of defects in the current period.
- Current machine-state classification.
- Seconds in blocked state.
- Occupancy of a staging area.
- Work-in-progress count.
- PPE compliance ratio.
Not every video frame should become a historian record. The Workflow should reduce the visual stream into meaningful values or state transitions before transmission.
Spreadsheet
A spreadsheet is a practical starting point for a limited pilot. Each event can become one row containing:
- Timestamp.
- Event type.
- Line.
- Station.
- SKU.
- Work order.
- Tracker or unit reference.
- Cycle interval.
- Quality status.
- Defect category.
- Image link.
- Review status.
A spreadsheet helps production and engineering teams validate whether the proposed fields are useful before a formal MES or historian integration is built. It should not become the permanent architecture for a large multi-line deployment, but it can reveal which data fields, filters, thresholds, and summaries the eventual system must support.
Webhooks and APIs
A webhook can send an event as soon as the Workflow determines that something important happened. This works well for:
- Posting a completed-unit transaction.
- Opening a quality incident.
- Sending a slow-cycle exception.
- Updating a lightweight production application.
- Triggering an operator notification.
- Appending a row through an integration service.
- Forwarding the event to a message queue.
An API provides more control when another application needs to query events, retrieve evidence, reconcile records, or request data for a particular date, line, shift, or work order. The integration should send the structured event, not the raw video stream. Operational systems generally need a small JSON object that states what happened and where to find the associated evidence.
PLC and Machine-Control Integration
PLC integration serves a different purpose from dashboard or MES integration. The MES needs a production record. The PLC may need an immediate decision:
- Accept.
- Reject.
- Hold.
- Stop.
- Divert.
- Continue.
- Request operator review.
That control path may require local inference, deterministic timing, fail-safe behavior, defined handshake logic, and communication through the protocols already used by the plant. Roboflow Workflows supports enterprise integration paths for sending vision outputs to industrial systems, including OPC UA, MQTT, Modbus TCP, SQL Server, and PLC-oriented connections.
Where Inference Runs on a Shop Floor
For production lines that require immediate decisions or must continue operating through internet interruptions, inference should run close to the camera. Roboflow AI1 combines an industrial camera, onboard NVIDIA edge compute, integrated illumination, and Roboflow deployment software in one unit. It can run RF-DETR models and workflows at the production station, allowing counting, inspection, timing, and control logic to execute without sending every frame to the cloud. Local execution reduces the delay between observation and action and prevents continuous video upload from becoming a network requirement.
Cloud infrastructure remains valuable for centralized management and multi-site analysis. A practical architecture can make decisions locally, store or buffer events at the edge, and synchronize structured records for fleet-wide dashboards, comparisons, reporting, and model improvement. Vision Events can then provide a common historical view across cameras and facilities while the production line continues to use local inference for time-sensitive operations. Roboflow supports cloud, dedicated, self-hosted, and edge deployment paths for Workflows, allowing the runtime location to follow the latency, connectivity, security, and management requirements of the application.
Build Around the Event, Not the Video Feed
Automating shop floor data collection with computer vision begins by asking: What production event needs to be recorded automatically?
Start building your shop floor data collection application with Roboflow for free today.
Further reading:


Cite this Post
Use the following entry to cite this post in your research:
Timothy M. (Jul 29, 2026). Shop Floor Data Collection: How to Automate It with Computer Vision. Roboflow Blog: https://blog.roboflow.com/shop-floor-data-collection/