
This article was contributed to the Roboflow blog by Abirami Vina.
Measuring changes to our environment is an important part of understanding progress made toward a more sustainable world. Historically, measuring the world around us required time-intensive human monitoring and measurement by a small number of expert scientists. Thanks to advances in AI, we can now automate and scale understanding changes to our environment with the use of computer vision.
In this guide, you’ll learn how to build a remote sensing system, powered by computer vision, to measure distinct characteristics within aerial images. This process can be applied to understand changes in waterways, measure crop health, understand forest density, monitor deforestation, and many more environmental use cases.
Let’s begin!
The Importance of Sustainability in Today’s World
The idea of living in our world in a manner that won’t affect future generations in a negative way is known as sustainability. Sustainability has become quite the buzzword in recent years, with multinational corporations turning towards eco-friendly choices and pushing a green movement. Because of this, terms like Environmental, Social, and Governance (ESG) criteria have also gained popularity.
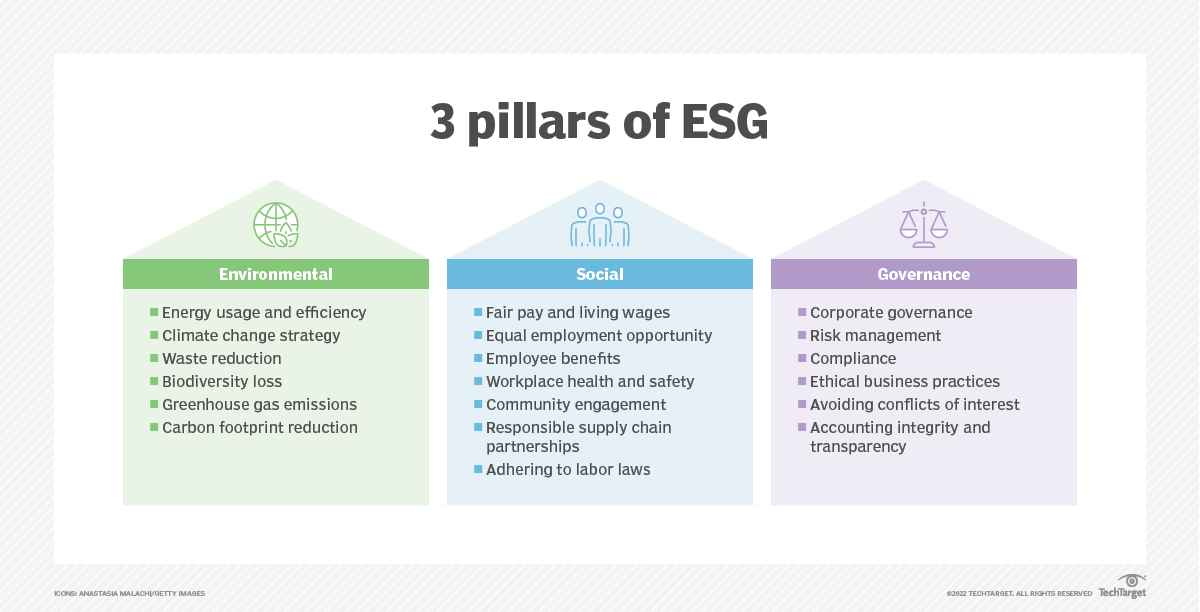
ESG is a set of criteria investors, companies, and stakeholders use to evaluate a company's performance and impact in these three key areas. By incorporating ESG principles, companies can drive positive change, foster social inclusion, mitigate environmental harm, and ultimately build a more sustainable and equitable future for their stakeholders and the planet.
The question we’ll answer today is specifically how computer vision models can help.
How Can Computer Vision Help Measure ESG?
Computer vision has the potential to support sustainability efforts across diverse domains. For example, computer vision can be applied to achieve precise environmental monitoring, enabling the identification of deforestation, pollution, and other ecological changes (by analyzing satellite images, data from drones, etc).
The robot in the below image exceeds the ability of human vision to identify and classify all items on waste streams – by material, object, and even brand. Computer vision can aid in automating waste sorting processes at recycling facilities.
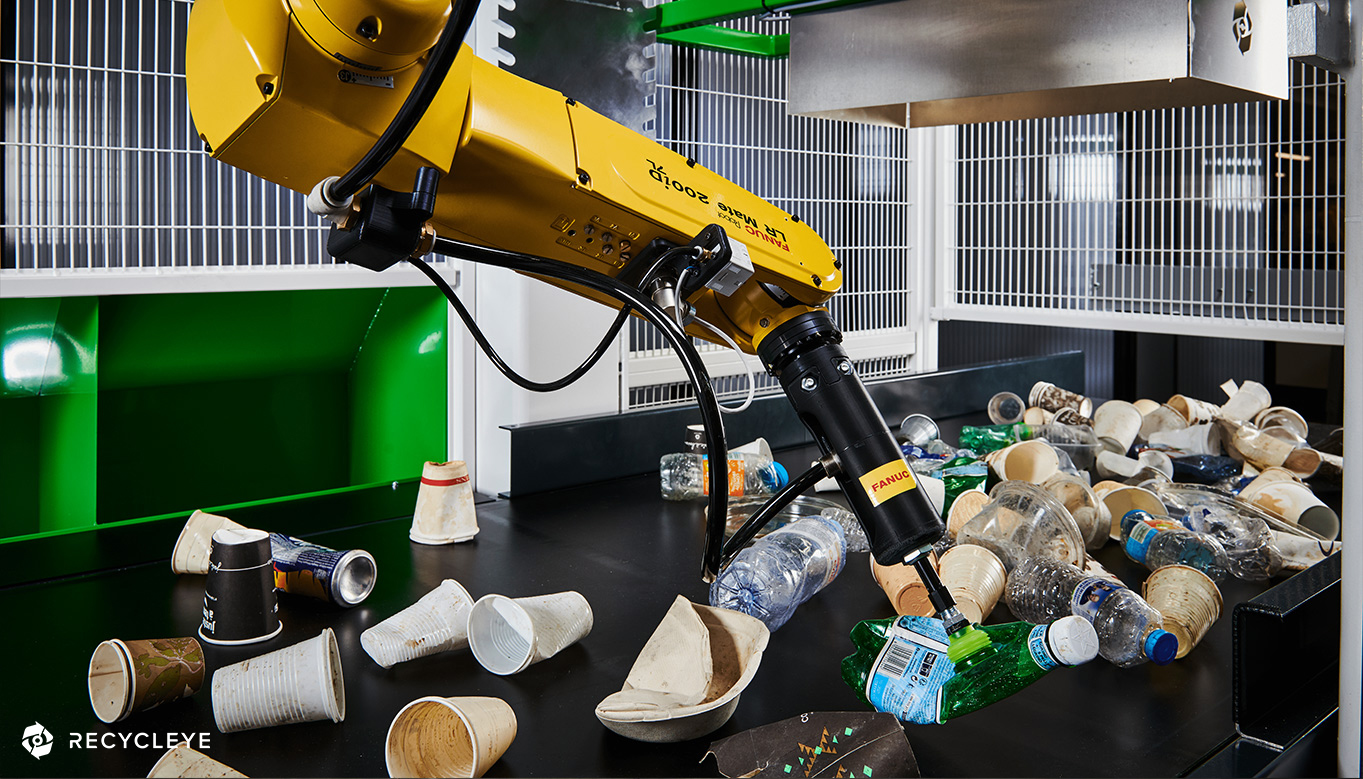
Accurately identifying and sorting different materials from incoming waste streams enhances recycling rates, reduces contamination, and optimizes resource recovery.
Further, agriculture can be made smart with the help of image analytics. Computer vision applications can assess crop health, monitor plant growth, and detect pest infestations.
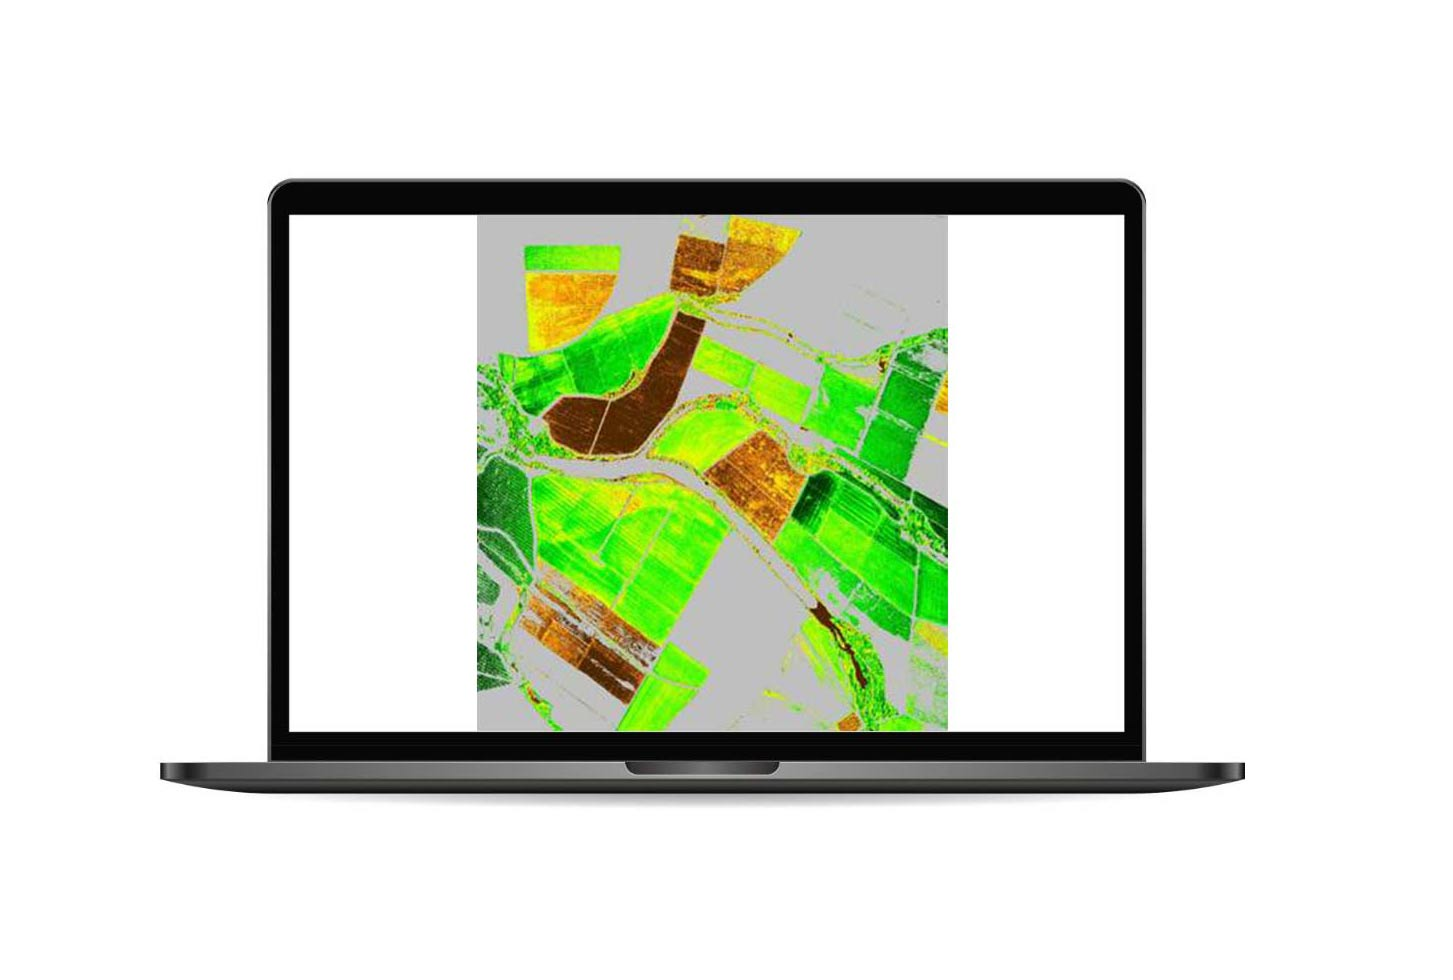
By providing farmers with timely information, they can optimize pesticide and water usage, leading to sustainable farming practices.
Measuring Sustainability KPIs with Computer Vision
Sustainability Key Performance Indicators (KPIs) are quantifiable measures to evaluate an organization's progress in attaining its sustainability objectives. These metrics enable organizations to assess their environmental, social, and economic influence. Common sustainability KPIs include greenhouse gas (GHG) emissions, energy consumption, water usage, and waste generation and diversion. Organizations can monitor their sustainability performance, set targets, and create responsible practices for a more sustainable future.
Using Computer Vision to Calculate Sustainability KPIs
Gathering and analyzing various data parameters is essential to calculate sustainability KPIs accurately. These parameters often involve complex environmental, social, and economic measurements which are physically present in the real world, requiring remote sensing to understand them. Computer vision can assist in arriving at these parameters efficiently and accurately.
In the context of social sustainability, computer vision can be used to assess factors like population density or the distribution of essential amenities like schools, hospitals, and community centers.
How to Detect Different Parts of an Aerial Image Using Computer Vision
Our objective is to use object detection to break up the image or area into distinct regions to calculate the built-up area. Let’s get right into it!
Step 1: Preparing a Dataset
If you already have the necessary data, feel free to proceed to the next step!
Collect Computer Vision Data
Since model performance relies heavily on gathering suitable data, our first step will be to collect relevant data (aerial images of large areas with various objects to train for, like buildings, parks, roads, etc.)
Some tools that Roboflow offers to help with data collection are Roboflow Collect and Roboflow Universe. Roboflow Collect is an automated data collection tool that allows you to gather data using a webcam and directly upload it to Roboflow. Roboflow Universe is a thriving community housing over 200,000 computer vision datasets spanning diverse use cases.
For illustrative purposes in this guide, we will work with this dataset from Roboflow Universe. The dataset features annotated aerial images of a park.
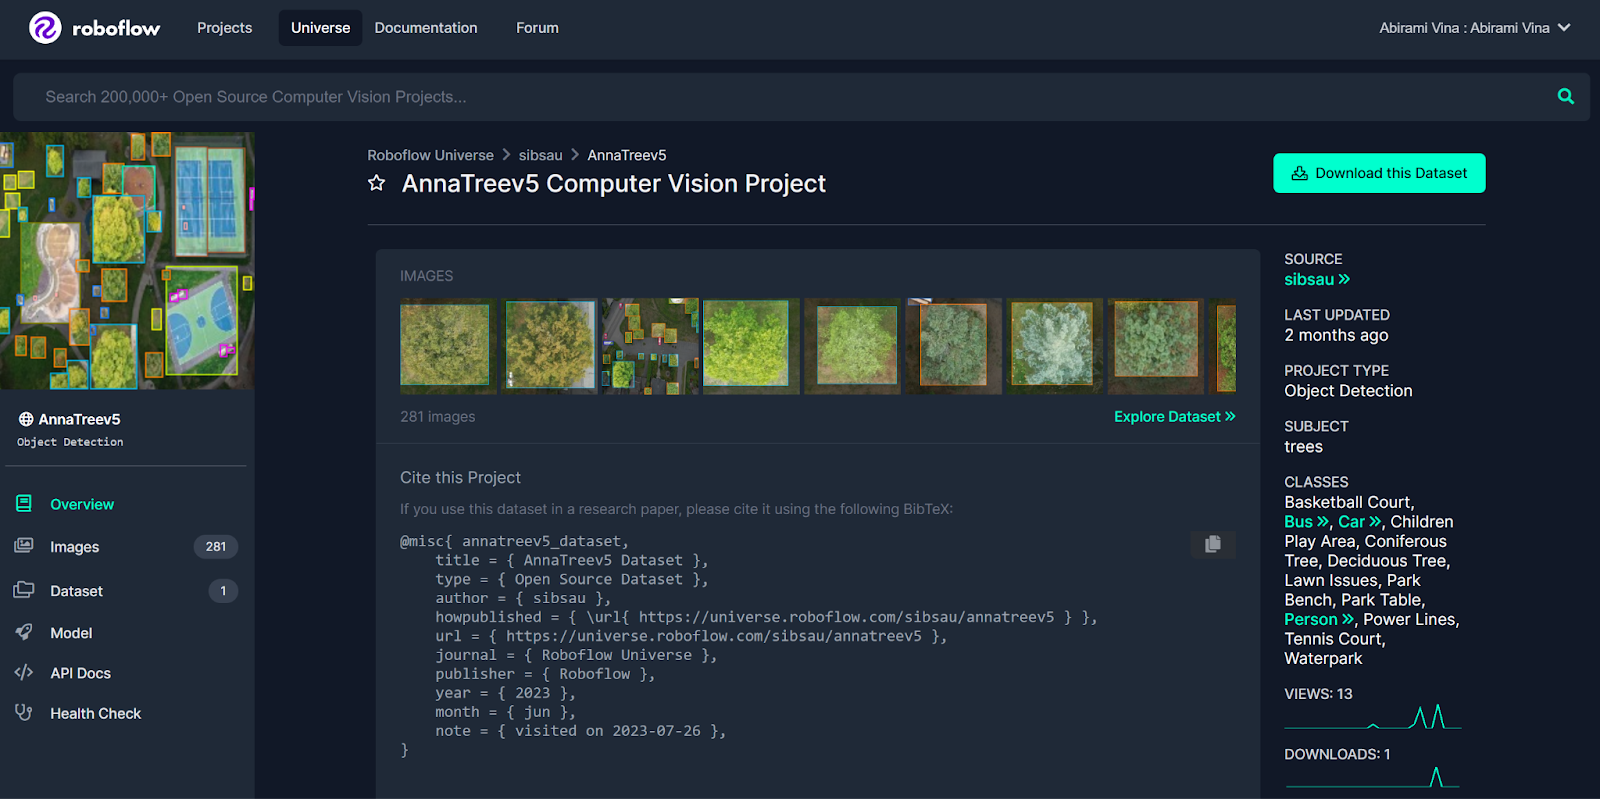
To download this dataset, click “Download this Dataset” on the Universe project page, then click the checkbox to download the dataset as a ZIP file. Unzip this file, as we will use the data in the next step.
Upload Data to Roboflow
Now that you’ve collected data, you can upload it to Roboflow.
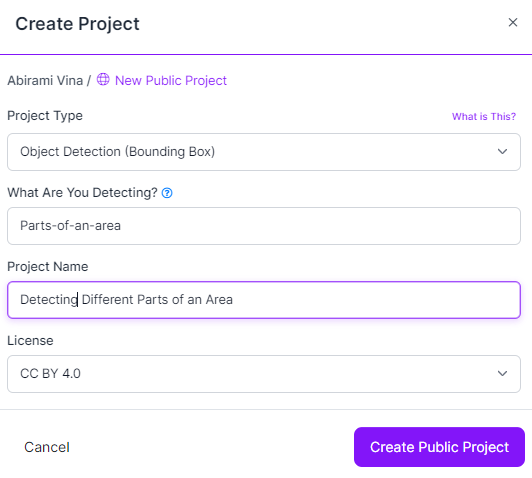
To upload, create a Roboflow account, then click “Create New Project” on the dashboard, as shown in the image below.
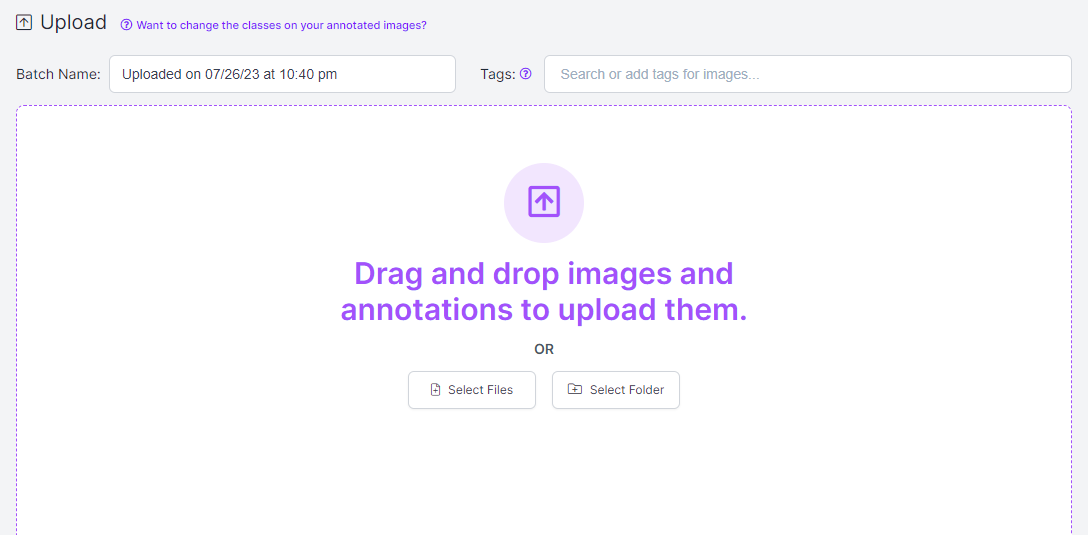
You can drag and drop all images and annotations you want to use to train your model, as shown below.
With our images uploaded, the next step would be annotating images. The dataset used in this guide has already been annotated, and the next step can be skipped. In case you are using a different dataset, the following instructions will be helpful.
Annotate Data with Roboflow
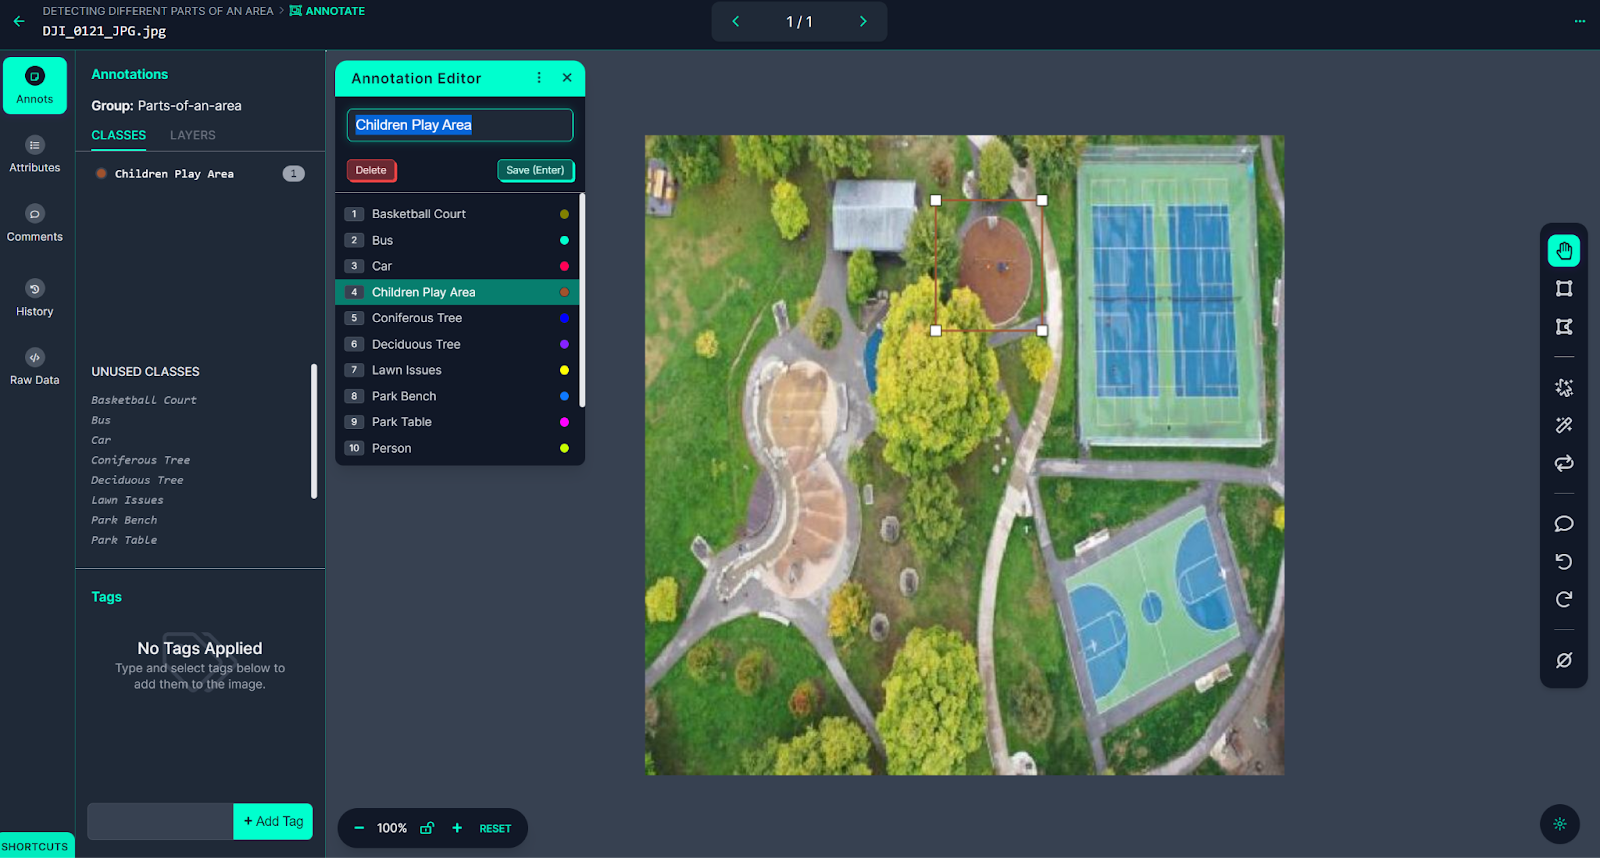
Roboflow Annotate is an annotation tool that provides an interactive web interface to annotate images. Click “Annotate” in the sidebar of your project in the Roboflow dashboard, then click an image to start annotating. This will open the image in an annotation view, as shown below.
To mark the image with annotations, click on the bounding box tool located in the right sidebar. Use your cursor to draw boxes around each object of interest. Once a box is drawn, you will be prompted to select a class to associate with the annotation. You can choose from pre-existing classes or create a new one. To save the annotation, simply press the Enter key on your keyboard.
Roboflow offers several tools to streamline the annotation process, one of which is the Smart Polygon feature. Smart Polygon allows for the annotation of images using polygons, which can improve model performance. Previously, creating polygon annotations took more time compared to bounding boxes. However, with Smart Polygon, the process becomes much faster and simpler.
To utilize Smart Polygon, click on the magic wand icon in the right sidebar. Follow the on-screen instructions to configure the Smart Polygon feature. Once set up, hover your cursor over any object in the image, and Smart Polygon will suggest an annotation. This intelligent recommendation system saves time and effort during the annotation process. For further details and insights into using Smart Polygon effectively, you can refer to the Roboflow Annotate documentation.
The next step is to create a dataset version.
Create a Dataset Version
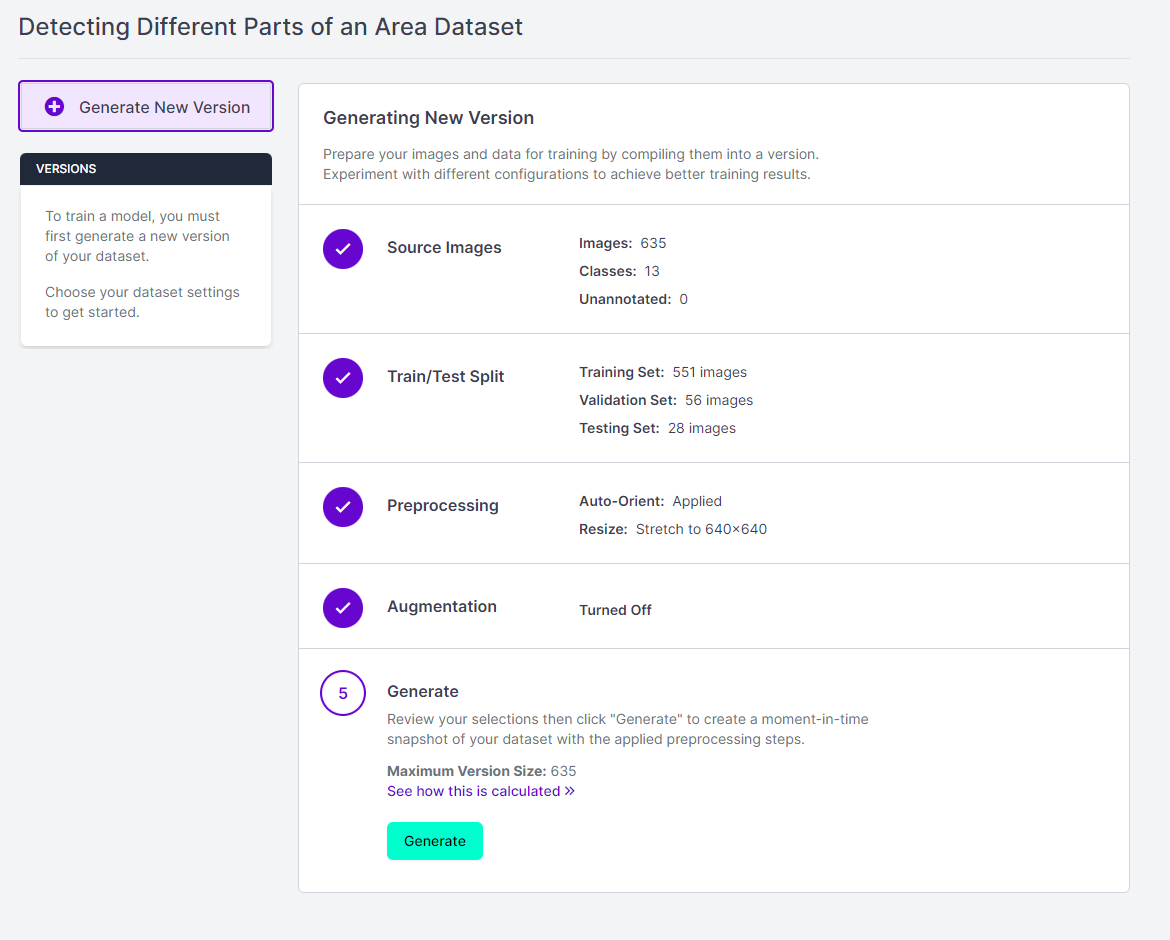
To create a dataset version, click “Generate” in the Roboflow sidebar. While you can configure the data preprocessing and augmentation steps, it is better to set no pre-processing or augmentation steps for the first version of a model. It lets you get an idea of your annotated data’s performance. Click on the “Generate” button, as shown below, to create a dataset version.
Creating a dataset version may require a few minutes based on the dataset's size. After successfully generating the dataset version, we are ready to train our model!
Step 2: Train Your Remote Sensing Model
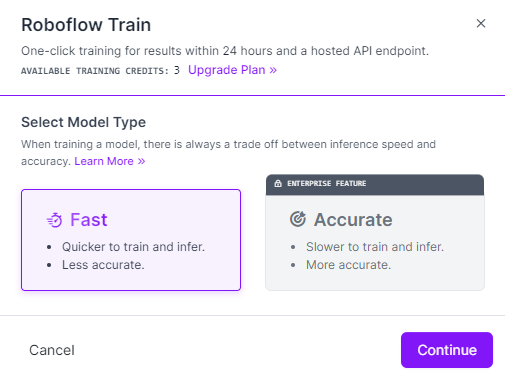
Training computer vision models on Roboflow is a breeze with Roboflow Train. Simply click on "Train a Model" on the dataset version page you were directed to after creating a dataset version. From there, you will be prompted to choose a training option. Click on the "Fast" training option to proceed, as shown below.
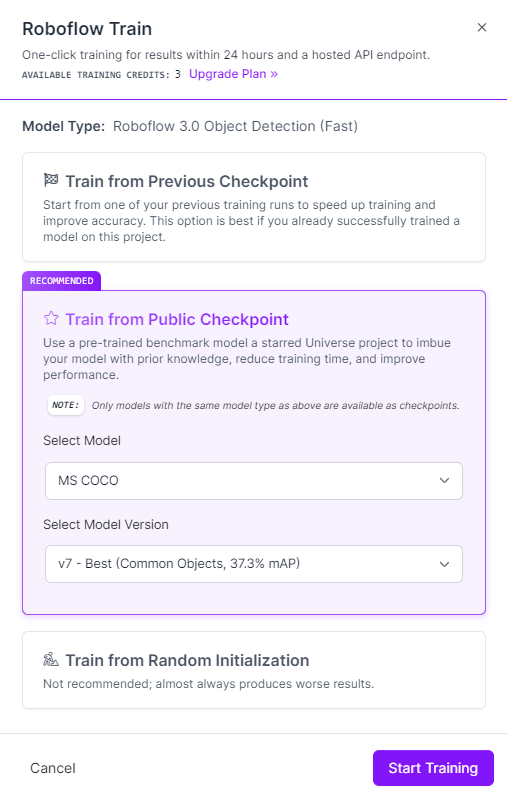
In the next pop-up, select the "Train from Public Checkpoint" option and ensure that "MS COCO" is chosen, as shown below. For the initial version of your model, we strongly recommend training from the MS COCO checkpoint.
Once you've completed all the on-screen instructions, a cloud-hosted computer will be allocated to handle your training job. The duration of model training will vary based on the number of images you have utilized. As the model trains, a graph on the page will continuously update, displaying the model's performance for each training step, as shown below.
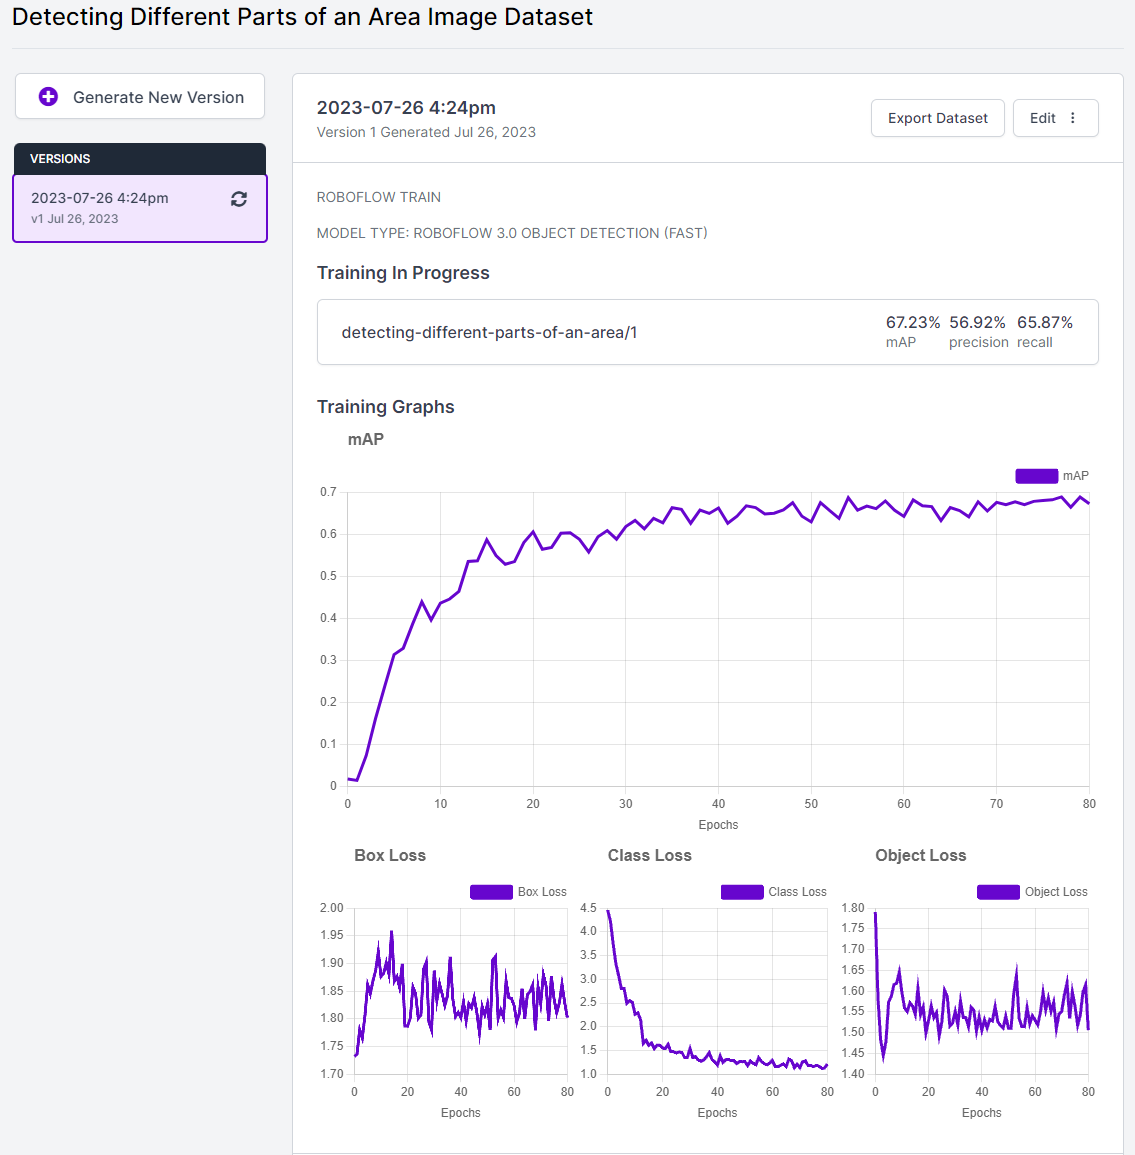
As soon as your model is ready for use, you will receive a notification via email.
Step 3: Testing a Computer Vision Model
Testing Your Model with the Roboflow Deploy Page
Once your model has completed the training process, you can put it to the test using the Roboflow Deploy page, as shown below. Simply navigate to the Roboflow sidebar and click on "Deploy."
A box will appear, allowing you to run inference on images from your test set (i.e., images not used during training) to assess how your model performs on unseen data. Additionally, you can upload new images for further testing and evaluation.
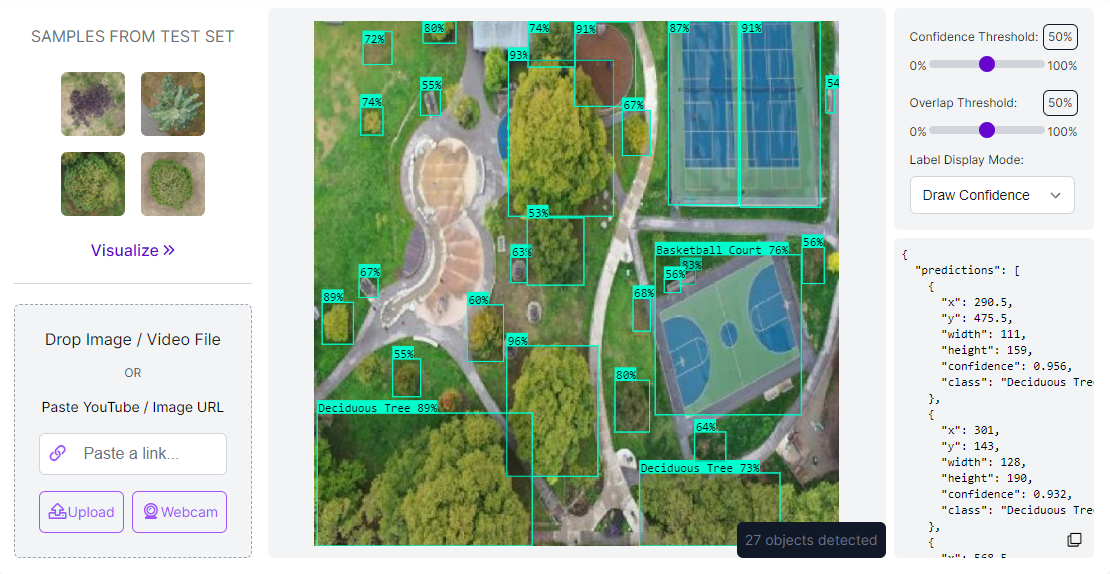
You can see that the model successfully detects different areas in the park.
Testing an Image Locally and Calculating the Built-Up Area
Here’s the link to the Google Collab notebook used to test and calculate the built-up area: notebook.
We can test the model locally by ‘pip’ installing the Roboflow library and loading the Roboflow workspace and project to access the model as follows:
#load Roboflow workspace and project to access your model
#the API key for your model can be found in the sample code provided on the Roboflow Deploy page

rf = Roboflow(api_key="############")
project = rf.workspace().project("detecting-different-parts-of-an-area")
model = project.version(1).model
We can run the model on a local image and visualize the predicted image as follows:
# run the model on a local image and save the predicted image

model.predict(r"test.jpg", confidence=40, overlap=30).save("prediction.jpg")

#read the predicted image and visualize it in the notebook

img=cv2.imread("prediction.jpg")
plt.axis("off")
plt.imshow(cv2.cvtColor(img, cv2.COLOR_BGR2RGB))
plt.show()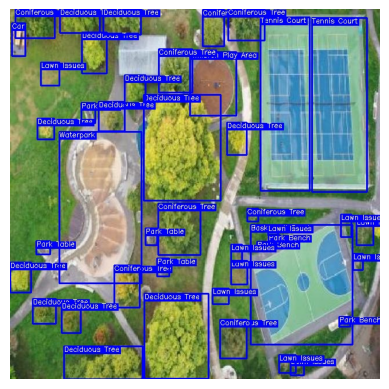
To understand the model predictions, we can run the model on an image and print the predictions as follows:
#run the model on a local image and print the detections

detections = model.predict(r"test.jpg", confidence=40, overlap=30).json()
pred = detections['predictions']
total_area=int(detections["image"]["width"])*int(detections["image"]["height"])
print(pred,total_area)
Further, we can use the coordinates of the center of the detected bounding boxes to calculate the area of the bounding boxes as follows:
for bounding_box in pred:
    #using the center point of the detected objects to calculate their bounding boxes
    x1 = bounding_box['x'] - bounding_box['width'] / 2
    x2 = bounding_box['x'] + bounding_box['width'] / 2
    y1 = bounding_box['y'] - bounding_box['height'] / 2
    y2 = bounding_box['y'] + bounding_box['height'] / 2
    box = (x1, x2, y1, y2)

    #calculating the area that each object takes up in the image

    xDiff = abs(x1 - x2) # Using absolute value to ignore negatives
    yDiff = abs(y1 - y2)

    area = xDiff * yDiff
(To further understand the breakdown of the output, please check out the notebook.) Based on this data, the built-up area of the image can be broken down as shown:
#the output

Of total area: 409600 pixels
#############################################
There are 13 Deciduous Trees
That composes 17.011962890625 % of the area
There are 8 Coniferous Trees
That composes 6.5166015625 % of the area
There are 1 Children Play Areas
That composes 2.1484375 % of the area
There are 2 Tennis Courts
That composes 13.206787109375002 % of the area
There are 4 Park Tables
That composes 0.640380859375 % of the area
There are 3 Park Benchs
That composes 0.24072265625 % of the area
There are 1 Basketball Courts
That composes 8.89453125 % of the area
There are 1 Waterparks
That composes 9.0830078125 % of the area
#############################################
The built-up area of this image is 33.332763671875 % of the total area
Step 4: Deploy Model to Production
Having a model ready is a significant milestone, but the next question is: how can you deploy the model in production? Roboflow offers an array of SDKs and tools tailored for deploying your model efficiently. You can deploy your model on various devices, including NVIDIA Jetson, Raspberry Pi, Luxonis OAK, Web (via roboflow.js), iOS, and CPU devices (via Docker).
To explore the specifics of each deployment option available for your model, refer to the deployment compatibility matrix featured in the Roboflow documentation. Once you've decided on a deployment option, configuring the respective device(s) for using your model is the next step. Each option listed above links to comprehensive guides for a seamless setup.
Regardless of the deployment device you choose, you can develop logic aligning with your business requirements, just as we did in this guide to calculate the built-up area.
By leveraging the deployment capabilities offered by Roboflow, you can seamlessly integrate your model into real-world applications, driving innovation and efficiency in your projects.
Conclusion
With the combination of sustainability awareness and the latest advancements in computer vision technology, we have the tools and knowledge to drive positive change and make a lasting impact on the planet. By accurately measuring sustainability KPIs, such as greenhouse gas emissions, energy consumption, water usage, and waste generation, computer vision empowers organizations to track their progress and make informed decisions toward a greener future.
By leveraging the potential of computer vision to enhance our understanding of the environment and promote responsible practices, we can collectively work towards a more sustainable and thriving world for generations to come.
Cite this Post
Use the following entry to cite this post in your research:
Trevor Lynn. (Jul 28, 2023). How to Use Computer Vision for Environment Monitoring. Roboflow Blog: https://blog.roboflow.com/computer-vision-environmental-impact-monitoring/